 🏗️ New Construction
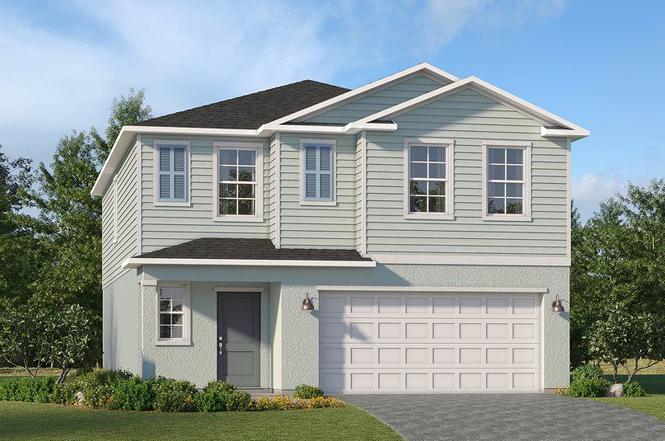
Edison Plan · North Fort Myers, FL
Flood risk No data
- FEMA flood zone
- —
- Chance of flooding over 30 yrs
- —
- Est. flood insurance / yr
- —
Fire risk No data
- Est. fire insurance / yr
- —
Heat risk No data
- Hot days now (above threshold)
- —
- Hot days in 30 yrs
- —
Wind risk No data
- Chance of severe wind over 30 yrs
- —
Air-quality risk No data
- Unhealthy air days now
- —
- Unhealthy air days in 30 yrs
- —
Risk factors via First Street. Map © Google.
Why this score? — see what drove the F grade
The composite is a weighted blend of 9 inputs, each scored 0–100. Each bar is that input's sub-score; the figure is the points it added to the 100-point composite (weight × sub-score).
- ARV discount +7.5/15.0
- Cash flow +5.6/30.0
- Condition / age +4.8/5.0
- Schools +4.6/10.0
- Livability +3.7/5.0
- Rent growth +3.5/5.0
- Appreciation +2.4/10.0
- 1% rule +1.1/10.0
- DSCR +0.0/10.0
$355,999
🖨 Deal sheet (PDF) 📄 Offer letter ✓ Due diligence
Listing remarks
The first floor of this new two-story home is host to an open-concept layout that combines the kitchen with the living and dining areas, and an outdoor patio is easily reached off the main living space. Upstairs, five bedrooms surround a versatile loft, including the luxe owner's suite, complete with a generous walk-in closet and en-suite bathroom.
Key facts
- Walk-in closet
- En-suite bathroom
- Outdoor patio
Tags
Property features AI
Finance
- Financial info: Listing is active
Exterior
- Parking: 2-car garage (2 total parking spaces)
- Home design: Single-family new construction, Edison plan
- Construction: Built as part of 2026 inventory (new construction)
- Exterior features: Address: Punta Gorda, FL (15330 Jadestone Dr)
Interior
- Bedrooms: 5 bedrooms
- Bathrooms: 2 full bathrooms and 1 half bathroom (2.5 total)
- Interior features: Open plan living area of 2112; New construction (Edison plan)
Neighborhood map
What this means for you Summary
Snapshot
- This is a 5-bed/2.5-bath single-family listed at $356k. Condition is rated excellent.
Deal economics
- At list price, monthly cash flow is $-1k ($-12k/yr) — negative.
- To cash-flow at today's rent, offer at most $338k (4.9% below list).
- To meet the 1% rule (rent ≥ 1% of price), the offer needs to be $296k (16.8% below list).
- Recommended offer: $296k (16.8% below list) — sets the bar for 1% rule.
Location & tenants
- Location reads 74/100 on livability (#269 in FL, #4,409 nationally) — a middle-class / working-renter tenant base. Strengths: cost of living A+, housing A+, health & safety A+; Watch: employment C-, amenities F, commute F.
- Charlotte (suburban): math 54% / reading 54% proficiency, ranked #22 of 73 in FL (top 30%) — acceptable for families but not a draw, mixed tenant base, ~2y average lease.
- Zoned schools: East Elementary School (math 67% / reading 68%, grade B+, #435 of 2,144 statewide, top 21%, 761 students, 52% FRL); Punta Gorda Middle School (math 54% / reading 52%, grade C+, #209 of 571 statewide, top 37%, 1,120 students, 41% FRL); Charlotte High School (math 44% / reading 46%, grade D-, #228 of 667 statewide, top 35%, 1,994 students, 41% FRL).
- Market conditions: Rents rising fast (+4.1%/yr); 1044 active listings in the ZIP; 3 comparable units currently listed for rent nearby; rentals at typical pace (median 23d on market — plan ~3-4 weeks tenant-placement turnaround); 4,585 units permitted in Charlotte County in 2024 (703 in 5+ unit buildings).
- At $2,961/mo this rent would consume 49% of the median local household income ($72k/yr) (locally 43% of renters already pay >50% of income on rent) — very limited rent-growth headroom before tenants either downsize or default.
Forward outlook
- Local home prices are declining (-3.0%/yr); year-one equity from $3k of loan paydown is wiped out by about $15k of value loss. Plan a longer hold.
- Charlotte County population projected at +24% by 2050 — long-run rental-demand tailwind backs the buy-and-hold thesis.
Negotiation context
- It's been on market 125 days — a 12% lower offer ($313k) is reasonable based on typical stale-listing flexibility.
Questions for the listing agent
- What do current leases actually rent for vs. the listed asking? Can we see a recent rent roll and the last 12 months of T-12 income?
- It's been on market 125 days. Have you received any prior offers? Is the seller open to a 17% concession, seller financing, or rate buy-down credit?
- Why hasn't it sold? Are there any deal-killer items the seller is aware of (foundation, flood, title, zoning, code violations)?
- Is there a deadline driving the sale (1031 exchange, divorce, estate, relocation)? That informs how much negotiation room exists.
- The area grade is low — what's the realistic commute time and amenity access for the typical tenant pool here? Any planned neighborhood developments (good or bad) we should know about?
- What's the average days-on-market for RENTAL listings here right now (not sales)? A rising rental-DOM trend means longer vacancies and softer asking-rent achievability than the comps imply.
- What's the recent tenant-quality profile in this submarket — average credit score on applications, eviction rate, late-payment / NSF rate, and stable-employment percentage? A property-management company in the area should have these aggregated.
- How much new for-sale + rental construction is in the pipeline within 1–3 miles? Heavy new supply typically softens prices + rents 12–24 months out; constrained supply supports both.
Investment metrics
- 1% rule
- 0.61% ✗
- Cap rate
- 3.78%
- Cash-on-cash
- -8.98%
- DSCR
- 0.60
- GRM
- 13.7
CMA / ARV
- ARV (on-the-fly)
- $485,760
- Comps found
- 5
Show comp detail 5 sales within ~0.75 mi
| Address | Dist | Beds/Ba | Sqft | Sold | Price | $/sf | Match |
|---|---|---|---|---|---|---|---|
| 15023 Bluewater Rd | 0.29mi | 4/3.0 (-1) | 2,032 (-4%) | 6mo | $467,000 | $230 | 68 |
| 14999 Jadestone Dr | 0.37mi | 4/3.0 (-1) | 2,032 (-4%) | 10mo | $370,000 | $182 | 62 |
| 15820 Elina Sky Dr | 0.58mi | 4/3.0 (-1) | 1,977 (-6%) | 14mo | $550,000 | $278 | 44 |
| 15918 Mulrion Blvd | 0.66mi | 4/3.5 (-1) | 2,320 (+10%) | 10mo | $410,145 | $177 | 36 |
| 16035 Mulrion Blvd | 0.73mi | 4/3.0 (-1) | 1,895 (-10%) | 16mo | $470,000 | $248 | 28 |
Match score weights: distance 35% · size 25% · config 20% · recency 20%. Top-matched comps best support the ARV.
Projected returns pro-forma
-3.0% appreciation · 4.13% rent growth · sell at horizon
- IRR
- -31.0%
- Equity multiple
- -0.03×
- Total profit
- $-140,083
- Equity at exit
- $72,428
- IRR
- -29.1%
- Equity multiple
- -0.40×
- Total profit
- $-190,969
- Equity at exit
- $42,000
Cash invested: $136,013 (down + closing). Projections, not guarantees.
Landlord ↔ Tenant lean methodology
- Overall (STATE)
- 87 Strongly Landlord-Friendly
- State Florida
- 87 Strongly Landlord-Friendly · R+3
- County
- — inherits STATE
- City
- — inherits STATE
ZIP-level market 33982
- Home prices YoY
- -1.2%
- Rents YoY
- 4.1%
- Active inventory
- 1044
- Price-to-rent
- 10.0×
Monthly cashflow live
- Estimated rent
- $2,961 medium interval (Pro) →
- Mortgage (P&I)
- −$2,547
- Tax est. 1.5%
- −$607 /mo · $7,286/yr
- Insurance
- −$202
- HOA
- −$0
- Vacancy / Maint / Mgmt
- −$622
- Net cashflow
- $-1,018
Break-even live
Sensitivity live
| Price | -10% $-682 | -5% $-850 | +0% $-1,018 | +5% $-1,186 | +10% $-1,353 |
|---|---|---|---|---|---|
| Rent | -10% $-1,252 | -5% $-1,135 | +0% $-1,018 | +5% $-901 | +10% $-784 |
| Rate | -1.0pp $-773 | -0.5pp $-894 | base $-1,018 | +0.5pp $-1,144 | +1.0pp $-1,272 |
UW: 25.0% down · 7.5% · 30yr · 1.5% tax · 5.0% vac · 8.0% maint · 8.0% mgmt
Financing live
Cash to close
- Down payment
- $121,440
- Closing costs
- $14,573
- Reserves months
- —
- Total cash needed
- —
Loan-product check · same deal, 3 products live
Conventional
25% down · 7.5% · 30yr
- Down + closing
- —
- Monthly P&I
- —
- Monthly cashflow
- —
- DSCR
- —
- Eligible?
- —
Personal DTI + credit; lowest rate.
DSCR
20% down · 8.5% · 30yr
- Down + closing
- —
- Monthly P&I
- —
- Monthly cashflow
- —
- DSCR
- —
- Eligible?
- —
No personal income docs; deal must DSCR.
Hard money
10% down · 12.0% · 12mo
- Down + closing
- —
- Monthly P&I
- —
- Monthly cashflow
- —
- DSCR
- —
- Eligible?
- —
Short-term bridge; refi at stabilization.
Rent comps 3 comps
| Address | Beds | Baths | Sqft | Rent | $/sqft | DOM | Units | Dist |
|---|---|---|---|---|---|---|---|---|
| 44229 Saddlewood Ct Punta Gorda, FL | 4.0 | 2.0 | 1675 | $2,395 | $1.43 | 23d | 1 | 1.10mi |
| 44229 Saddlewood Ct Punta Gorda, FL | 4.0 | 2.0 | 1675 | $2,350 | $1.40 | 15d | 1 | 1.10mi |
| 16397 Preservation Blvd Punta Gorda, FL | 4.0 | 3.5 | 2353 | $2,800 | $1.19 | 23d | 1 | 1.43mi |
Listing history 15 events
-
2026-06-22days on market $355,999 Active 125 DOM
-
2026-06-18days on market $355,999 Active 122 DOM
-
2026-06-17days on market $355,999 Active 121 DOM
-
2026-06-16days on market $355,999 Active 120 DOM
-
2026-06-15days on market $355,999 Active 119 DOM
-
2026-06-14days on market $355,999 Active 117 DOM
-
2026-06-13days on market $355,999 Active 116 DOM
-
2026-06-10days on market $355,999 Active 114 DOM
-
2026-06-09days on market $355,999 Active 113 DOM
-
2026-06-08days on market $355,999 Active 112 DOM
-
2026-06-05days on market $355,999 Active 108 DOM
-
2026-06-02days on market $355,999 Active 106 DOM
-
2026-06-01days on market $355,999 Active 105 DOM
-
2026-05-31days on market $355,999 Active 104 DOM
-
2026-05-30days on market $355,999 Active 103 DOM
ⓘ Source: listings_history table (triggers on properties + properties_extension) + one-shot
backfill from property_details.listing_events for pre-trigger history.
Nearby sold comps map
Loading sold comps map…
Walkable amenities ~0.75 mi
Loading nearby amenities…
Taxation est. · year 1
- Rental income
- $35,533
- − Mortgage interest
- −$27,210
- − Property taxes
- −$7,286
- − Insurance
- −$2,429
- − Repairs & maintenance
- −$2,843
- − Management
- −$2,843
- − Depreciation
- −$14,131
- Taxable loss
- −$21,209
- Est. tax savings @ 24.0%
- +$5,090
- After-tax cash flow
- $-7,122/yr
For passive investors: Depreciation is non-cash, so a rental often shows a tax loss while cash-flowing — sheltering income. Rental losses are passive: they offset passive income freely, and up to $25,000/yr can offset ordinary (W-2) income if you actively participate and your MAGI is under $100k (phasing out to $0 by $150k); unused losses carry forward. On sale, claimed depreciation is recaptured at up to 25%, and gains may owe capital-gains tax (a 1031 exchange can defer both). Figures are a year-1 estimate at your 24.0% rate — not tax advice; consult a CPA.
Condition & rehab AI · 13 photos
This new two-story home is in excellent condition with no visible repairs needed. It offers a great layout and is move-in ready.
Value-add opportunities
- Both Landscaping — Enhances curb appeal and adds value
- Both Painting — Fresh paint can make the home look more appealing
- Both Lighting — Modern lighting can improve the home's ambiance and value
Renovation cost estimate screening
Value-add ROI direction
- Both Landscaping — Enhances curb appeal and adds value ↑
- Both Painting — Fresh paint can make the home look more appealing ↑
- Both Lighting — Modern lighting can improve the home's ambiance and value ↑
ⓘ Cost ranges are severity-bucket heuristics (US national rule-of-thumb). Get contractor quotes + a written scope before underwriting a rehab budget.
Schools (NCES district)
- District
- Charlotte
- NCES district ID
- 1200240
- Math proficiency
- 54% ▼ -6.00%
- Reading proficiency
- 54% ▼ -1.00%
- Median HH income
- $44,864
- Composite
- 45.62/100
- National rank
- #2586
- State rank
- #22 of 73 in FL
Livability — North Fort Myers
- Score
- 74/100
- State rank
- #269
- US rank
- #4409
Category grades
Schools grade is shown separately in the Schools card above.
Census & demographics
- County
- Charlotte County · 196,994 people
- City population
- 57,035
- Metro
- Punta Gorda, FL
- Population (ZIP)
- 13,006
- Household income
- $72,443
- Rent vs Own
- Severe rent burden
- 43.0
Population outlook (Charlotte County) Hauer SSP2
- Today (2025)
- 198,646 people
- By 2030
- 210,507 · +6.0%
- By 2040
- 230,857 · +16.2%
- By 2050
- 247,148 · +24.4%
- By 2075
- 281,777 · +41.8%
- By 2100
- 293,609 · +47.8%
Race, ethnicity, and origin ACS 2023
- Neighborhood character
- Predominantly White (81%)
- Race & ethnicity
- White 81% Two or more races 8% Hispanic / Latino 7% Black 7%
- Hispanic origin (detail)
- Puerto Rican 2% Cuban 3%
- Common ancestry
- Lithuanian 3% Iranian 3% Slovak 3%
- Foreign-born
- 6% · Canada, Jamaica
- Languages at home
- 93% English-only · Spanish 5% German/W. Germanic 1% Arabic 1%
Political lean MEDSL · Charlotte
- 2024 margin
- Solid R (+34.0) · D 32.7% · R 66.7%
- 2008→2024 swing
- -26.7pp toward R · 2008: -7.2pp · 2024: -34.0pp
- All cycles
- 2024: R+34.0 2020: R+26.6 2016: R+27.8 2012: R+14.3 2008: R+7.2
Not yet ingested
- Civics
- —
Market trends
- HPI YoY
- ▼ -5.25%
- Current HPI
- 448.5895
- Rent YoY
- ▲ 4.13%
- Metro
- Punta Gorda, FL
- State GDP YoY
- ▲ 3.28%
- F500 in state
- 36
Industry mix (Fortune 500 HQ in FL)
| Industry | F500 HQs | Revenue |
|---|---|---|
| Industrial Technology | 2 | $29B |
|
||
| Insurance | 2 | $17B |
|
||
| Retail | 1 | $60B |
|
||
| Technology Distribution | 1 | $58B |
|
||
| Homebuilding | 1 | $35B |
|
||
| Technology Manufacturing | 1 | $35B |
|
||
Cash-flow waterfall
monthlySold comps — $/sqft
last 12 mo · ≤1 miLoading sold comps…