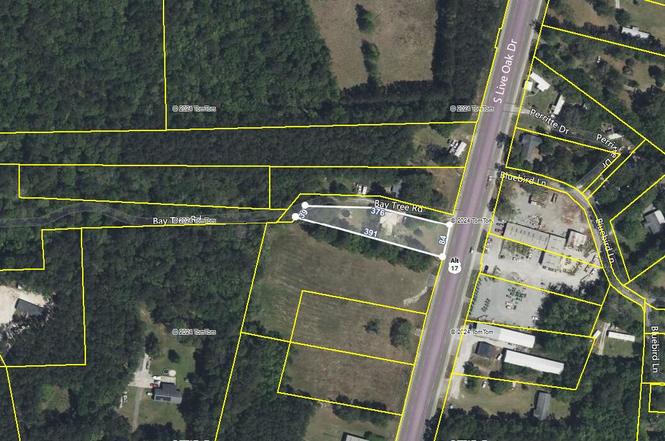
2063 S Live Oak Dr · Moncks Corner, SC
Flood risk 1/10 · Minimal
- FEMA flood zone
- X (unshaded)
- Chance of flooding over 30 yrs
- 0.0%
- Est. flood insurance / yr
- $507 – $1,088
Fire risk 4/10 · Minor
- Est. fire insurance / yr
- $783 – $1,453
Heat risk 8/10 · Major
- Hot days now (above 107°F)
- 7 days/yr
- Hot days in 30 yrs
- 17 days/yr
Wind risk 8/10 · Major
- Chance of severe wind over 30 yrs
- 97.0%
Air-quality risk 2/10 · Minimal
- Unhealthy air days now
- 2 days/yr
- Unhealthy air days in 30 yrs
- 2 days/yr
Risk factors via First Street. Map © Google.
Why this score? — see what drove the B grade
The composite is a weighted blend of 9 inputs, each scored 0–100. Each bar is that input's sub-score; the figure is the points it added to the 100-point composite (weight × sub-score).
- Cash flow +27.9/30.0
- ARV discount +15.0/15.0
- DSCR +9.9/10.0
- 1% rule +6.8/10.0
- Schools +3.6/10.0
- Livability +3.4/5.0
- Rent growth +3.2/5.0
- Condition / age +2.5/5.0
- Appreciation +0.0/10.0
$179,900
🖨 Deal sheet 📄 Offer letter ✓ Due diligence
Listing remarks
Great property with major road frontage on Hwy 17A/S. Live Oak Dr. This could be a great commercial property with surrounding neighbors approval of easement usage. Buyer would have to apply for rezoning with Berkeley County. The property is currently zoned R2, but there are 4 properties to the left zoned GC. The property is being sold for land value, but the manufactured home will convey with sale as-is. The seller will make no repairs.
Key facts
- 0.61 acre lot
- Built 1997
- Listed 262 days
Property features AI
Exterior
- Parking: Off-street parking
- Utilities: Septic tank; BCW & SA water; Berkeley Electric Co-Op power
- Home design: Manufactured / Mobile home (double wide); One story; Ground-level entry
- Construction: Vinyl skirting; Asphalt roof; Fee simple ownership
- Exterior features: Level lot
Interior
- Kitchen: Eat-in kitchen
- Bedrooms: 3 bedrooms (master bedroom on the lower level)
- Flooring: Carpet
- Bathrooms: 2 bathrooms
- Heating & cooling: Cooling: Other
- Interior features: Ceiling - blown insulation; Eat-in kitchen; Family room
- Laundry & utility: Washer hookup; Electric dryer hookup
Neighborhood map
What this means for you Summary
Snapshot
- This is a 3-bed/2.0-bath manufactured listed at $180k.
Deal economics
- At list price, monthly cash flow is $553 ($7k/yr) — positive.
- The deal already cash-flows at list — no discount required.
- Meets the 1% rule at list price ($2k rent vs $180k).
- Recommended offer: $158k (12.0% below list) — sets the bar for market timing.
- Cap rate 10.0% vs local median 4.3% in Moncks Corner — top-decile yield for the area; either an underpriced asset or a hidden risk that comps aren't pricing in. Stress-test before assuming the spread holds.
Location & tenants
- Location reads 67/100 on livability (#99 in SC) — a middle-class / working-renter tenant base. Strengths: housing A+, health & safety A+, cost of living A; Watch: crime C-, amenities F, commute F.
- Berkeley 01 (suburban): math 35% / reading 48% proficiency, ranked #30 of 80 in SC (top 38%) — families likely to look elsewhere, expect single-tenant / working-renter base with shorter leases.
- Zoned schools: Whitesville Elementary (math 34% / reading 39%, grade F, #328 of 597 statewide, top 55%, 1,031 students, 62% FRL); Berkeley Middle (math 19% / reading 32%, grade F, #162 of 229 statewide, top 71%, 1,403 students, 57% FRL); Berkeley High (math 36% / reading 83%, grade C+, #110 of 196 statewide, top 58%, 1,776 students, 50% FRL).
- Market conditions: Rents rising (+2.8%/yr); 642 active listings in the ZIP; solid renter incomes; 3,183 units permitted in Berkeley County in 2024 (580 in 5+ unit buildings).
- This rent runs 31% of the median local income ($83k/yr) — at the standard rent-burdened threshold; future hikes will face affordability resistance.
Forward outlook
- Local home prices are declining (-3.0%/yr); year-one equity from $1k of loan paydown is wiped out by about $5k of value loss. Plan a longer hold.
- Berkeley County population projected at +48% by 2050 — long-run rental-demand tailwind backs the buy-and-hold thesis.
- At projected returns (-3.0% appreciation + 2.8% rent growth), your $50k cash investment doubles in ~9 years — after that, you're playing with house money.
Negotiation context
- It's been on market 262 days — a 12% lower offer ($158k) is reasonable based on typical stale-listing flexibility.
- 2 sale attempts; this cycle's ask has dropped $45k (20%) from the opening price — seller is motivated, your offer sets the floor, not the list.
- Current owner paid $37k; list at $180k implies a 386% gain — meaningful room to come down on a strong offer.
Risks & watch-outs
- Climate carrying-cost: severe wind risk, 97% chance of damaging wind over 30y; extreme-heat days projected 7→17/yr by 2055 (HVAC capex compounding) — expect insurance premiums to compound above CPI over the hold.
Questions for the listing agent
- It's been on market 262 days. Have you received any prior offers? Is the seller open to a 12% concession, seller financing, or rate buy-down credit?
- Why hasn't it sold? Are there any deal-killer items the seller is aware of (foundation, flood, title, zoning, code violations)?
- Is there a deadline driving the sale (1031 exchange, divorce, estate, relocation)? That informs how much negotiation room exists.
- Schools are D-rated, which usually means shorter tenancies and higher turnover. Who's the typical renter profile here, and what's been the actual vacancy rate?
- What's the average days-on-market for RENTAL listings here right now (not sales)? A rising rental-DOM trend means longer vacancies and softer asking-rent achievability than the comps imply.
- What's the recent tenant-quality profile in this submarket — average credit score on applications, eviction rate, late-payment / NSF rate, and stable-employment percentage? A property-management company in the area should have these aggregated.
- How much new for-sale + rental construction is in the pipeline within 1–3 miles? Heavy new supply typically softens prices + rents 12–24 months out; constrained supply supports both.
Investment metrics
- 1% rule
- 1.18% ✓
- Cap rate
- 9.98%
- Cash-on-cash
- 13.18%
- DSCR
- 1.59
- GRM
- 7.0
CMA / ARV
- ARV (on-the-fly)
- $256,704
- Comps found
- 4
Show comp detail 4 sales within ~0.75 mi
| Address | Dist | Beds/Ba | Sqft | Sold | Price | $/sf | Match |
|---|---|---|---|---|---|---|---|
| 212 Langham Ct | 0.55mi | 3/2.0 | 1,308 (-3%) | 3mo | $250,000 | $191 | 67 |
| 208 Langham Ct | 0.56mi | 3/2.0 | 1,308 (-3%) | 12mo | $249,444 | $191 | 60 |
| 204 Langham Ct | 0.57mi | 3/2.0 | 1,308 (-3%) | 13mo | $249,444 | $191 | 58 |
| 122 Liferidge Ct | 0.57mi | 3/2.0 | 1,308 (-3%) | 14mo | $249,444 | $191 | 58 |
Match score weights: distance 35% · size 25% · config 20% · recency 20%. Top-matched comps best support the ARV.
Projected returns pro-forma
-3.0% appreciation · 2.77% rent growth · sell at horizon
- IRR
- 2.9%
- Equity multiple
- 1.11×
- Total profit
- $5,548
- Equity at exit
- $26,824
- IRR
- 12.2%
- Equity multiple
- 1.95×
- Total profit
- $48,032
- Equity at exit
- $15,554
Cash invested: $50,372 (down + closing). Projections, not guarantees.
Landlord ↔ Tenant lean methodology
- Overall (STATE)
- 90 Strongly Landlord-Friendly
- State South Carolina
- 90 Strongly Landlord-Friendly · R+6
- County
- — inherits STATE
- City
- — inherits STATE
ZIP-level market 29461
- Home prices YoY
- -13.9%
- Rents YoY
- 2.8%
- Active inventory
- 642
- Price-to-rent
- 7.0×
Monthly cashflow live
- Estimated rent
- $2,128 medium interval (Pro) →
- Mortgage (P&I)
- −$943
- Tax from tax record
- −$110 /mo · $1,320/yr
- Insurance
- −$75
- HOA
- −$0
- Vacancy / Maint / Mgmt
- −$447
- Net cashflow
- $553
Break-even live
UW: 25.0% down · 7.5% · 30yr · 1.5% tax · 5.0% vac · 8.0% maint · 8.0% mgmt
Financing live
Cash to close
- Down payment
- $44,975
- Closing costs
- $5,397
- Reserves months
- —
- Total cash needed
- —
Loan-product check · same deal, 3 products live
Conventional
25% down · 7.5% · 30yr
- Down + closing
- —
- Monthly P&I
- —
- Monthly cashflow
- —
- DSCR
- —
- Eligible?
- —
Personal DTI + credit; lowest rate.
DSCR
20% down · 8.5% · 30yr
- Down + closing
- —
- Monthly P&I
- —
- Monthly cashflow
- —
- DSCR
- —
- Eligible?
- —
No personal income docs; deal must DSCR.
Hard money
10% down · 12.0% · 12mo
- Down + closing
- —
- Monthly P&I
- —
- Monthly cashflow
- —
- DSCR
- —
- Eligible?
- —
Short-term bridge; refi at stabilization.
Listing history 22 events
-
2026-06-18days on market $179,900 Active 262 DOM
-
2026-06-17days on market $179,900 Active 261 DOM
-
2026-06-16days on market $179,900 Active 260 DOM
-
2026-06-15days on market $179,900 Active 259 DOM
-
2026-06-13days on market $179,900 Active 257 DOM
-
2026-06-13days on market $179,900 Active 256 DOM
-
2026-06-10days on market $179,900 Active 254 DOM
-
2026-06-09days on market $179,900 Active 253 DOM
-
2026-06-08days on market $179,900 Active 252 DOM
-
2026-06-07days on market $179,900 Active 251 DOM
-
2026-06-05days on market $179,900 Active 248 DOM
-
2026-06-03days on market $179,900 Active 247 DOM
-
2026-06-03days on market $179,900 Active 246 DOM
-
2026-06-01days on market $179,900 Active 245 DOM
-
2026-05-31days on market $179,900 Active 244 DOM
-
2026-02-17price $179,900
-
2026-01-12price $199,900
-
2025-09-29$225,000 Active
-
2025-09-28historical
-
2025-05-11historical Active Under Contract
-
2025-01-17$300,000 Active
-
1984-09-05soldstatus $37,000
ⓘ Source: listings_history table (triggers on properties + properties_extension) + one-shot
backfill from property_details.listing_events for pre-trigger history.
Tax reassessment forecast SC · Resets to sale price
- Current annual tax
- $1,320 · $110/mo
- Projected year-2 tax
- $1,320 · $110/mo
- Expected delta
- $0/yr ($0/mo · 0.0%)
ⓘ Screening estimate from a state-policy table — verify with the county assessor before closing.
Climate risk First Street
- Flood 1/10 Low FEMA zone X (unshaded) · 0% chance over 30 yrs
- Wildfire 4/10 Moderate
- Heat 8/10 Severe 7 d/yr ≥107°F today · 17 d/yr by 30 yrs out
- Wind 8/10 Severe 97% chance of damaging wind over 30 yrs
- Air quality 2/10 Low 2 unhealthy d/yr today · 2 by 30 yrs out
Nearby sold comps map
Loading sold comps map…
Walkable amenities ~0.75 mi
Loading nearby amenities…
Taxation est. · year 1
- Rental income
- $25,542
- − Mortgage interest
- −$10,077
- − Property taxes
- −$1,320
- − Insurance
- −$900
- − Repairs & maintenance
- −$2,043
- − Management
- −$2,043
- − Depreciation
- −$5,233
- Taxable income
- $3,925
- Est. tax owed @ 24.0%
- −$942
- After-tax cash flow
- $5,696/yr
For passive investors: Depreciation is non-cash, so a rental often shows a tax loss while cash-flowing — sheltering income. Rental losses are passive: they offset passive income freely, and up to $25,000/yr can offset ordinary (W-2) income if you actively participate and your MAGI is under $100k (phasing out to $0 by $150k); unused losses carry forward. On sale, claimed depreciation is recaptured at up to 25%, and gains may owe capital-gains tax (a 1031 exchange can defer both). Figures are a year-1 estimate at your 24.0% rate — not tax advice; consult a CPA.
Schools (NCES district)
- District
- Berkeley 01
- NCES district ID
- 4501170
- Math proficiency
- 35% ▼ -8.00%
- Reading proficiency
- 48% ▼ -2.00%
- Median HH income
- $52,724
- Composite
- 35.95/100
- National rank
- #4799
- State rank
- #30 of 80 in SC
Livability — Moncks Corner
- Score
- 67/100
- State rank
- #99
- US rank
- #10812
Category grades
Schools grade is shown separately in the Schools card above.
Census & demographics
- County
- Berkeley County · 198,768 people
- City population
- 43,816
- Metro
- Charleston-North Charleston, SC
- Population (ZIP)
- 43,816
- Household income
- $82,666
- Rent vs Own
- Severe rent burden
- 815.0
Population outlook (Berkeley County) Hauer SSP2
- Today (2025)
- 254,184 people
- By 2030
- 279,677 · +10.0%
- By 2040
- 329,379 · +29.6%
- By 2050
- 375,557 · +47.8%
- By 2075
- 476,740 · +87.6%
- By 2100
- 535,945 · +110.8%
Race, ethnicity, and origin ACS 2023
- Neighborhood character
- Majority White (61%)
- Race & ethnicity
- White 61% Black 29% Hispanic / Latino 6% Two or more races 5%
- Hispanic origin (detail)
- Mexican 2% Puerto Rican 2%
- Common ancestry
- Lithuanian 1% Slovak 1% Romanian 1%
- Foreign-born
- 3% · Canada
- Languages at home
- 96% English-only · Spanish 3%
Political lean MEDSL · Berkeley
- 2024 margin
- R (+16.3) · D 41.1% · R 57.4% · Other 1.4%
- 2008→2024 swing
- -3.2pp toward R · 2008: -13.1pp · 2024: -16.3pp
- All cycles
- 2024: R+16.3 2020: R+11.7 2016: R+17.4 2012: R+18.9 2008: R+13.1
Not yet ingested
- Civics
- —
Market trends
- HPI YoY
- ▼ -52.95%
- Current HPI
- 328.7212
- Rent YoY
- ▲ 2.77%
- Metro
- Charleston-North Charleston, SC
- State GDP YoY
- ▲ 4.51%
- F500 in state
- 2
Industry mix (Fortune 500 HQ in SC)
| Industry | F500 HQs | Revenue |
|---|---|---|
| Packaging | 1 | $7B |
|
||
Price history
+386.2% since first listed7 events — show timeline
- 2026-02-17 Price Changed $179,900 Charleston Trident MLS
- 2026-01-12 Price Changed $199,900 Charleston Trident MLS
- 2025-09-29 Listed $225,000 Charleston Trident MLS
- 2025-09-28 Listing Removed — Charleston Trident MLS
- 2025-05-11 Contingent — Charleston Trident MLS
- 2025-01-17 Listed $300,000 Charleston Trident MLS
- 1984-09-05 Sold (Public Records) $37,000 Public Records
Property tax history
+1.2%/yrLatest (2025): $1,320 · +2.5% YoY. Source: county tax records.
Cash-flow waterfall
monthlySold comps — $/sqft
last 12 mo · ≤1 miLoading sold comps…