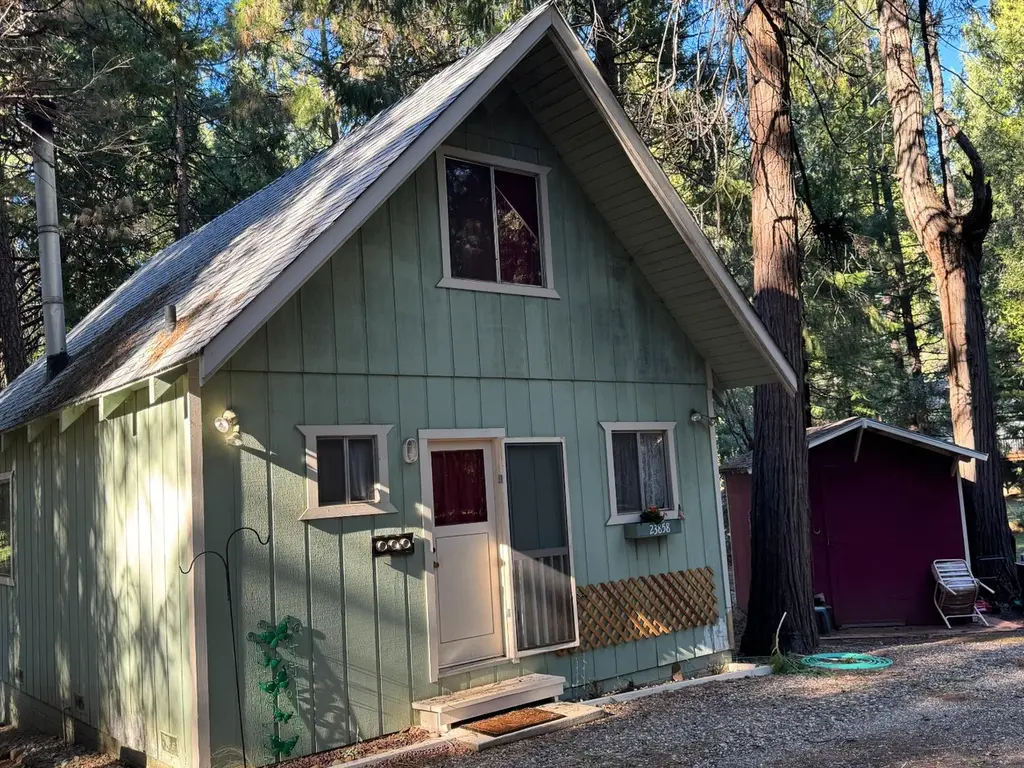
23858 Fiddletown Rd · Lockwood, CA
Flood risk 1/10 · Minimal
- FEMA flood zone
- X (unshaded)
- Chance of flooding over 30 yrs
- 0.0%
- Est. flood insurance / yr
- $507 – $1,088
Fire risk 8/10 · Major
- Est. fire insurance / yr
- $659 – $1,223
Heat risk 4/10 · Minor
- Hot days now (above 97°F)
- 5 days/yr
- Hot days in 30 yrs
- 13 days/yr
Wind risk 1/10 · Minimal
- Chance of severe wind over 30 yrs
- —
Air-quality risk 10/10 · Severe
- Unhealthy air days now
- 26 days/yr
- Unhealthy air days in 30 yrs
- 33 days/yr
Risk factors via First Street. Map © Google.
Why this score? — see what drove the D grade
The composite is a weighted blend of 9 inputs, each scored 0–100. Each bar is that input's sub-score; the figure is the points it added to the 100-point composite (weight × sub-score).
- Cash flow +16.5/30.0
- ARV discount +7.5/15.0
- DSCR +5.1/10.0
- 1% rule +3.4/10.0
- Livability +3.2/5.0
- Schools +2.7/10.0
- Rent growth +2.5/5.0
- Condition / age +2.5/5.0
- Appreciation +0.0/10.0
$225,000
🖨 Deal sheet (PDF) 📄 Offer letter ✓ Due diligence
Listing remarks
Cabin on 2 plus acres w/ 2 separate lots (APN#'s: 023-510-021 & 022). 3 bedroom septic installed in 2014, great well per seller! Awesome location 45 min to Kirkwood, minutes to town of Volcano for great dining & entertainment! No restriction for animals, great opportunity for horses w/ quick access to national forest. Cabin has been well maintained newer roof & exterior paint, plus shed/workshop. Enjoy the two acres or build another home. Don't miss the chance to own this great cabin in the foothills. No drive by's - flag lot.
Key facts
- 2.13 acre lot
- Parking
- Built 1974
Property features AI
Finance
- HOA & community: No homeowners association
Exterior
- Parking: No garage; Unpaved driveway/sidewalks
- Utilities: Well water; Septic system (see remarks); 220V in kitchen
- Home design: Detached single-family home; Original condition; 2 stories; Built in 1974
- Construction: Shingle/composition roof
- Exterior features: Private, low-maintenance lot; Dead-end location; Flag lot with irregular shape; Shed(s) on property; Allows horses
Interior
- Kitchen: Free-standing refrigerator; Free-standing electric range; Kitchen/family combo with laminate counters
- Bedrooms: 1 bedroom (upper level)
- Flooring: Carpet; Linoleum
- Bathrooms: 1 full bathroom with tub/shower and window
- Heating & cooling: Wall furnace; Wood stove; Ceiling fan(s)
- Interior features: Living room with attached deck; Uncovered deck; Living room fireplace
- Laundry & utility: No laundry hookups inside
Neighborhood map
What this means for you Summary
Snapshot
- This is a 1-bed/1.0-bath single-family listed at $225k.
Deal economics
- At list price, monthly cash flow is $133 ($2k/yr) — positive.
- The deal already cash-flows at list — no discount required.
- To meet the 1% rule (rent ≥ 1% of price), the offer needs to be $189k (15.8% below list).
- Recommended offer: $189k (15.8% below list) — sets the bar for 1% rule.
Location & tenants
- Location reads 63/100 on livability (#455 in CA) — a middle-class / working-renter tenant base. Strengths: housing A+, employment A-, commute B; Watch: crime F, amenities F, cost of living F.
- Amador County Unified (town): math 23% / reading 37% proficiency, ranked #330 of 517 in CA (top 64%) — families likely to look elsewhere, expect single-tenant / working-renter base with shorter leases.
- Zoned schools: Sutter Creek Elementary (math 32% / reading 37%, grade F, #719 of 1,571 statewide, top 48%, 380 students, 38% FRL); Ione Junior High (math 14% / reading 34%, grade F, #364 of 498 statewide, top 74%, 393 students, 40% FRL); Amador High (math 17% / reading 42%, grade F, #750 of 1,170 statewide, top 66%, 702 students, 35% FRL) — zoned schools at 38% FRL track the district average.
- Market conditions: 32 active listings in the ZIP; 66 units permitted in Amador County in 2024 (0 in 5+ unit buildings).
Forward outlook
- Local home prices are declining (-3.0%/yr); year-one equity from $2k of loan paydown is wiped out by about $7k of value loss. Plan a longer hold.
- Amador County population projected at -15% by 2050 — secular population decline; favor cash flow + early exit over multi-decade hold.
Negotiation context
- It's been on market 20 days — a 2% lower offer ($222k) is reasonable based on typical stale-listing flexibility.
- Current owner paid $125k; list at $225k implies a 80% gain — meaningful room to come down on a strong offer.
Risks & watch-outs
- Climate carrying-cost: severe wildfire risk — expect insurance premiums to compound above CPI over the hold.
Questions for the listing agent
- Built in 1974 — when were the roof, HVAC, electrical panel, plumbing, and water heater last replaced?
- Is there a deadline driving the sale (1031 exchange, divorce, estate, relocation)? That informs how much negotiation room exists.
- Schools are F-rated, which usually means shorter tenancies and higher turnover. Who's the typical renter profile here, and what's been the actual vacancy rate?
- Crime grade is F in this area — have there been break-ins, vandalism, or insurance claims at this property in the last 3 years? What carrier currently insures it and at what premium?
- The area grade is low — what's the realistic commute time and amenity access for the typical tenant pool here? Any planned neighborhood developments (good or bad) we should know about?
- What's the average days-on-market for RENTAL listings here right now (not sales)? A rising rental-DOM trend means longer vacancies and softer asking-rent achievability than the comps imply.
- What's the recent tenant-quality profile in this submarket — average credit score on applications, eviction rate, late-payment / NSF rate, and stable-employment percentage? A property-management company in the area should have these aggregated.
- How much new for-sale + rental construction is in the pipeline within 1–3 miles? Heavy new supply typically softens prices + rents 12–24 months out; constrained supply supports both.
Investment metrics
- 1% rule
- 0.84% ✗
- Cap rate
- 7.00%
- Cash-on-cash
- 2.54%
- DSCR
- 1.11
- GRM
- 9.9
CMA / ARV
- ARV (on-the-fly)
- $139,776
- Comps found
- 1
Show comp detail 1 sale within ~0.75 mi
| Address | Dist | Beds/Ba | Sqft | Sold | Price | $/sf | Match |
|---|---|---|---|---|---|---|---|
| 23858 Fiddletown Rd | 0.00mi | 1/1.0 | 896 (0%) | 0mo | $140,000 | $156 | 100 |
Match score weights: distance 35% · size 25% · config 20% · recency 20%. Top-matched comps best support the ARV.
Projected returns pro-forma
-3.0% appreciation · 3.0% rent growth · sell at horizon
- IRR
- -12.3%
- Equity multiple
- 0.55×
- Total profit
- $-28,054
- Equity at exit
- $33,548
- IRR
- -3.3%
- Equity multiple
- 0.78×
- Total profit
- $-13,853
- Equity at exit
- $19,454
Cash invested: $63,000 (down + closing). Projections, not guarantees.
Landlord ↔ Tenant lean methodology
- Overall (STATE)
- 18 Strongly Tenant-Friendly
- State California
- 18 Strongly Tenant-Friendly · D+13
- County
- — inherits STATE
- City
- — inherits STATE
ZIP-level market 95689
- Home prices YoY
- -29.6%
- Active inventory
- 32
- Price-to-rent
- 9.9×
Monthly cashflow live
- Estimated rent
- $1,895 medium interval (Pro) →
- Mortgage (P&I)
- −$1,180
- Tax from tax record
- −$90 /mo · $1,076/yr
- Insurance
- −$94
- HOA
- −$0
- Vacancy / Maint / Mgmt
- −$398
- Net cashflow
- $133
Break-even live
Sensitivity live
| Price | -10% $261 | -5% $197 | +0% $133 | +5% $70 | +10% $6 |
|---|---|---|---|---|---|
| Rent | -10% $-16 | -5% $59 | +0% $133 | +5% $208 | +10% $283 |
| Rate | -1.0pp $247 | -0.5pp $191 | base $133 | +0.5pp $75 | +1.0pp $16 |
UW: 25.0% down · 7.5% · 30yr · 1.5% tax · 5.0% vac · 8.0% maint · 8.0% mgmt
Financing live
Cash to close
- Down payment
- $56,250
- Closing costs
- $6,750
- Reserves months
- —
- Total cash needed
- —
Loan-product check · same deal, 3 products live
Conventional
25% down · 7.5% · 30yr
- Down + closing
- —
- Monthly P&I
- —
- Monthly cashflow
- —
- DSCR
- —
- Eligible?
- —
Personal DTI + credit; lowest rate.
DSCR
20% down · 8.5% · 30yr
- Down + closing
- —
- Monthly P&I
- —
- Monthly cashflow
- —
- DSCR
- —
- Eligible?
- —
No personal income docs; deal must DSCR.
Hard money
10% down · 12.0% · 12mo
- Down + closing
- —
- Monthly P&I
- —
- Monthly cashflow
- —
- DSCR
- —
- Eligible?
- —
Short-term bridge; refi at stabilization.
Listing history 1 events
-
2014-04-10soldstatus $125,000
ⓘ Source: listings_history table (triggers on properties + properties_extension) + one-shot
backfill from property_details.listing_events for pre-trigger history.
Tax reassessment forecast CA · Resets to sale price
- Current annual tax
- $1,076 · $90/mo
- Projected year-2 tax
- $1,710 · $142/mo
- Expected delta
- +$634/yr (+$53/mo · 58.8%)
ⓘ Screening estimate from a state-policy table — verify with the county assessor before closing.
Climate risk First Street
- Flood 1/10 Low FEMA zone X (unshaded) · 0% chance over 30 yrs
- Wildfire 8/10 Severe
- Heat 4/10 Moderate 5 d/yr ≥97°F today · 13 d/yr by 30 yrs out
- Wind 1/10 Low
- Air quality 10/10 Extreme 26 unhealthy d/yr today · 33 by 30 yrs out
Nearby sold comps map
Loading sold comps map…
Walkable amenities ~0.75 mi
Loading nearby amenities…
Taxation est. · year 1
- Rental income
- $22,736
- − Mortgage interest
- −$12,603
- − Property taxes
- −$1,076
- − Insurance
- −$1,125
- − Repairs & maintenance
- −$1,819
- − Management
- −$1,819
- − Depreciation
- −$6,545
- Taxable loss
- −$2,253
- Est. tax savings @ 24.0%
- +$541
- After-tax cash flow
- $2,141/yr
For passive investors: Depreciation is non-cash, so a rental often shows a tax loss while cash-flowing — sheltering income. Rental losses are passive: they offset passive income freely, and up to $25,000/yr can offset ordinary (W-2) income if you actively participate and your MAGI is under $100k (phasing out to $0 by $150k); unused losses carry forward. On sale, claimed depreciation is recaptured at up to 25%, and gains may owe capital-gains tax (a 1031 exchange can defer both). Figures are a year-1 estimate at your 24.0% rate — not tax advice; consult a CPA.
Schools (NCES district)
- District
- Amador County Unified
- NCES district ID
- 0602450
- Math proficiency
- 23% ▼ -9.00%
- Reading proficiency
- 37% ▼ -10.00%
- Median HH income
- $55,428
- Composite
- 26.67/100
- National rank
- #7163
- State rank
- #330 of 517 in CA
Livability — Lockwood
- Score
- 63/100
- State rank
- #455
- US rank
- #15482
Category grades
Schools grade is shown separately in the Schools card above.
Census & demographics
- Census place
- Lockwood, CA
- City population
- 1,065
- Population (ZIP)
- 1,065
Population outlook (Amador County) Hauer SSP2
- Today (2025)
- 35,295 people
- By 2030
- 34,147 · -3.3%
- By 2040
- 31,618 · -10.4%
- By 2050
- 29,913 · -15.2%
- By 2075
- 27,308 · -22.6%
- By 2100
- 23,465 · -33.5%
Race, ethnicity, and origin ACS 2023
- Neighborhood character
- Predominantly White (77%)
- Race & ethnicity
- White 77% Two or more races 5% Hispanic / Latino 5% Asian 3%
- Common ancestry
- Slovak 6% Iranian 5% Italian 1%
- Foreign-born
- 6% · Canada
- Languages at home
- 87% English-only · Spanish 5% French/Haitian/Cajun 4% German/W. Germanic 3%
Political lean MEDSL · Amador
- 2024 margin
- Strong R (+27.8) · D 34.7% · R 62.6% · Other 2.7%
- 2008→2024 swing
- -13.2pp toward R · 2008: -14.6pp · 2024: -27.8pp
- All cycles
- 2024: R+27.8 2020: R+24.4 2016: R+25.2 2012: R+19.0 2008: R+14.6
Not yet ingested
- Civics
- —
Market trends
- HPI YoY
- ▼ -60.91%
- Current HPI
- 144.8647
- Rent YoY
- —
- Metro
- —
- State GDP YoY
- ▲ 3.21%
- F500 in state
- 116
Industry mix (Fortune 500 HQ in CA)
| Industry | F500 HQs | Revenue |
|---|---|---|
| Technology | 27 | $1,492B |
|
||
| Financial Services | 3 | $174B |
|
||
| Retail | 3 | $44B |
|
||
| Insurance | 3 | $26B |
|
||
| Media / Entertainment | 2 | $115B |
|
||
| Pharmaceuticals / Biotech | 2 | $62B |
|
||
Price history
1 event — show timeline
- 2014-04-10 Sold (Public Records) $125,000 Public Records
Property tax history
+5.1%/yrLatest (2025): $1,076 · +4.2% YoY. Source: county tax records.
Cash-flow waterfall
monthlySold comps — $/sqft
last 12 mo · ≤1 miLoading sold comps…