401 Hill Side Rd · Summer Set, MO
Flood risk 1/10 · Minimal
- FEMA flood zone
- X (unshaded)
- Chance of flooding over 30 yrs
- 0.0%
- Est. flood insurance / yr
- $507 – $1,088
Fire risk 5/10 · Moderate
- Est. fire insurance / yr
- $1,054 – $1,958
Heat risk 4/10 · Minor
- Hot days now (above 105°F)
- 7 days/yr
- Hot days in 30 yrs
- 20 days/yr
Wind risk 2/10 · Minimal
- Chance of severe wind over 30 yrs
- 1.0%
Air-quality risk 2/10 · Minimal
- Unhealthy air days now
- 1 days/yr
- Unhealthy air days in 30 yrs
- 1 days/yr
Risk factors via First Street. Map © Google.
Why this score? — see what drove the B- grade
The composite is a weighted blend of 9 inputs, each scored 0–100. Each bar is that input's sub-score; the figure is the points it added to the 100-point composite (weight × sub-score).
- Cash flow +30.0/30.0
- 1% rule +10.0/10.0
- DSCR +10.0/10.0
- ARV discount +7.5/15.0
- Schools +4.3/10.0
- Rent growth +2.5/5.0
- Livability +2.5/5.0
- Condition / age +2.5/5.0
- Appreciation +0.0/10.0
$74,520
🖨 Deal sheet (PDF) 📄 Offer letter ✓ Due diligence
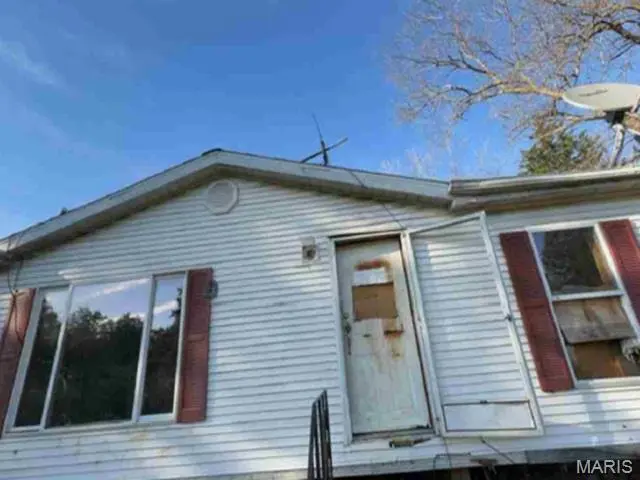
Listing remarks
Great opportunity on this mobile home. It offers approximately 1,344 square feet of living space with 3 bedrooms and 2 bathrooms. Built in 2017 repairs and updates are needed but has potential. Property sold "AS-IS" without contingencies, repairs, warranties, guarantees or representation as to listing accuracy, property information, photo or other depiction included or described herein. Inspect prior bidding. Auction.
Key facts
- 5.6 acre lot
- Built 2017
- Listed 12 days
Property features AI
Finance
- Other: Seller may consider concessions; No home warranty
- Financial info: Lease not considered
Exterior
- Utilities: Well water; Septic tank sewer; Electric service: Ameren
- Home design: Manufactured home (residential); Single-story
- Construction: Built with other/unspecified construction materials
- Exterior features: Front yard and back yard
Interior
- Bedrooms: Three bedrooms, all on the main level
- Bathrooms: Two full bathrooms, both on the main level
- Heating & cooling: No heating listed; No cooling listed
- Interior features: Six total rooms
Neighborhood map
What this means for you Summary
Snapshot
- This is a 3-bed/2.0-bath manufactured listed at $75k.
Deal economics
- At list price, monthly cash flow is $451 ($5k/yr) — positive.
- The deal already cash-flows at list — no discount required.
- Meets the 1% rule at list price ($1k rent vs $75k).
Location & tenants
- Location reads: area grade B — affects rentability + tenant quality, not the cash-flow math above.
- Sunrise R-IX (rural): math 45% / reading 50% proficiency, ranked #141 of 535 in MO (top 26%) — families likely to look elsewhere, expect single-tenant / working-renter base with shorter leases.
- Zoned schools: Sunrise Elem. (math 42% / reading 47%, grade F, #413 of 1,115 statewide, top 42%, 333 students, 42% FRL) — zoned schools at 42% FRL track the district average.
- Market conditions: 150 active listings in the ZIP; 807 units permitted in Jefferson County in 2024 (104 in 5+ unit buildings).
Forward outlook
- Local home prices are declining (-3.0%/yr); year-one equity from $515 of loan paydown is wiped out by about $2k of value loss. Plan a longer hold.
- At projected returns (-3.0% appreciation + 3.0% rent growth), your $21k cash investment doubles in ~5 years — after that, you're playing with house money.
Negotiation context
- Only 13 days on market — expect competitive offers; lowballing is unlikely to land.
Risks & watch-outs
- Climate carrying-cost: moderate wildfire risk — expect insurance premiums to compound above CPI over the hold.
Questions for the listing agent
- Is there a deadline driving the sale (1031 exchange, divorce, estate, relocation)? That informs how much negotiation room exists.
- What's the average days-on-market for RENTAL listings here right now (not sales)? A rising rental-DOM trend means longer vacancies and softer asking-rent achievability than the comps imply.
- What's the recent tenant-quality profile in this submarket — average credit score on applications, eviction rate, late-payment / NSF rate, and stable-employment percentage? A property-management company in the area should have these aggregated.
- How much new for-sale + rental construction is in the pipeline within 1–3 miles? Heavy new supply typically softens prices + rents 12–24 months out; constrained supply supports both.
Investment metrics
- 1% rule
- 1.54% ✓
- Cap rate
- 13.56%
- Cash-on-cash
- 25.94%
- DSCR
- 2.15
- GRM
- 5.4
CMA / ARV
No comps found within radius.
Projected returns pro-forma
-3.0% appreciation · 3.0% rent growth · sell at horizon
- IRR
- 19.6%
- Equity multiple
- 1.80×
- Total profit
- $16,635
- Equity at exit
- $11,111
- IRR
- 27.9%
- Equity multiple
- 3.46×
- Total profit
- $51,404
- Equity at exit
- $6,443
Cash invested: $20,866 (down + closing). Projections, not guarantees.
Landlord ↔ Tenant lean methodology
- Overall (STATE)
- 81 Strongly Landlord-Friendly
- State Missouri
- 81 Strongly Landlord-Friendly · R+10
- County
- — inherits STATE
- City
- — inherits STATE
ZIP-level market 63020
- Home prices YoY
- -21.9%
- Active inventory
- 150
- Price-to-rent
- 5.4×
Monthly cashflow live
- Estimated rent
- $1,150 medium interval (Pro) →
- Mortgage (P&I)
- −$391
- Tax from tax record
- −$36 /mo · $428/yr
- Insurance
- −$31
- HOA
- −$0
- Vacancy / Maint / Mgmt
- −$242
- Net cashflow
- $451
Break-even live
Sensitivity live
| Price | -10% $493 | -5% $472 | +0% $451 | +5% $430 | +10% $409 |
|---|---|---|---|---|---|
| Rent | -10% $360 | -5% $406 | +0% $451 | +5% $496 | +10% $542 |
| Rate | -1.0pp $489 | -0.5pp $470 | base $451 | +0.5pp $432 | +1.0pp $412 |
UW: 25.0% down · 7.5% · 30yr · 1.5% tax · 5.0% vac · 8.0% maint · 8.0% mgmt
Financing live
Cash to close
- Down payment
- $18,630
- Closing costs
- $2,236
- Reserves months
- —
- Total cash needed
- —
Loan-product check · same deal, 3 products live
Conventional
25% down · 7.5% · 30yr
- Down + closing
- —
- Monthly P&I
- —
- Monthly cashflow
- —
- DSCR
- —
- Eligible?
- —
Personal DTI + credit; lowest rate.
DSCR
20% down · 8.5% · 30yr
- Down + closing
- —
- Monthly P&I
- —
- Monthly cashflow
- —
- DSCR
- —
- Eligible?
- —
No personal income docs; deal must DSCR.
Hard money
10% down · 12.0% · 12mo
- Down + closing
- —
- Monthly P&I
- —
- Monthly cashflow
- —
- DSCR
- —
- Eligible?
- —
Short-term bridge; refi at stabilization.
Listing history 19 events
-
2026-06-18days on market $74,520 Active 13 DOM
-
2026-06-17days on market $74,520 Active 12 DOM
-
2026-06-16days on market $74,520 Active 11 DOM
-
2026-06-15days on market $74,520 Active 10 DOM
-
2026-06-13days on market $74,520 Active 8 DOM
-
2026-06-12days on market $74,520 Active 7 DOM
-
2026-06-09days on market $74,520 Active 4 DOM
-
2026-06-08days on market $74,520 Active 3 DOM
-
2026-06-07remarks 421-char remark
-
2026-06-07pricedays on market $74,520 Active 2 DOM
-
2026-06-05days on market $81,000 Active 147 DOM
-
2026-06-04days on market $81,000 Active 145 DOM
-
2026-06-02days on market $81,000 Active 144 DOM
-
2026-06-01days on market $81,000 Active 143 DOM
-
2026-05-31days on market $81,000 Active 142 DOM
-
2026-04-23price $81,000
-
2026-03-23price $86,388
-
2026-02-12price $93,900
-
2026-01-09$102,000 Active
ⓘ Source: listings_history table (triggers on properties + properties_extension) + one-shot
backfill from property_details.listing_events for pre-trigger history.
Tax reassessment forecast MO · Resets to sale price
- Current annual tax
- $428 · $36/mo
- Projected year-2 tax
- $723 · $60/mo
- Expected delta
- +$295/yr (+$25/mo · 68.8%)
ⓘ Screening estimate from a state-policy table — verify with the county assessor before closing.
Climate risk First Street
- Flood 1/10 Low FEMA zone X (unshaded) · 0% chance over 30 yrs
- Wildfire 5/10 Major
- Heat 4/10 Moderate 7 d/yr ≥105°F today · 20 d/yr by 30 yrs out
- Wind 2/10 Low 100% chance of damaging wind over 30 yrs
- Air quality 2/10 Low 1 unhealthy d/yr today · 1 by 30 yrs out
Nearby sold comps map
Loading sold comps map…
Walkable amenities ~0.75 mi
Loading nearby amenities…
Taxation est. · year 1
- Rental income
- $13,801
- − Mortgage interest
- −$4,174
- − Property taxes
- −$428
- − Insurance
- −$373
- − Repairs & maintenance
- −$1,104
- − Management
- −$1,104
- − Depreciation
- −$2,168
- Taxable income
- $4,450
- Est. tax owed @ 24.0%
- −$1,068
- After-tax cash flow
- $4,345/yr
For passive investors: Depreciation is non-cash, so a rental often shows a tax loss while cash-flowing — sheltering income. Rental losses are passive: they offset passive income freely, and up to $25,000/yr can offset ordinary (W-2) income if you actively participate and your MAGI is under $100k (phasing out to $0 by $150k); unused losses carry forward. On sale, claimed depreciation is recaptured at up to 25%, and gains may owe capital-gains tax (a 1031 exchange can defer both). Figures are a year-1 estimate at your 24.0% rate — not tax advice; consult a CPA.
Schools (NCES district)
- District
- Sunrise R-IX
- NCES district ID
- 2929820
- Math proficiency
- 45% ▬ 0.00%
- Reading proficiency
- 50% ▼ -5.00%
- Median HH income
- $50,854
- Composite
- 42.9/100
- National rank
- #6711
- State rank
- #141 of 535 in MO
Livability — Summer Set
No livability data for this city. (Only ~50 U.S. cities are tracked.)
Census & demographics
- Population (ZIP)
- 20,357
Population outlook (Jefferson County) Hauer SSP2
- Today (2025)
- 235,088 people
- By 2030
- 238,365 · +1.4%
- By 2040
- 240,156 · +2.2%
- By 2050
- 234,651 · -0.2%
- By 2075
- 214,569 · -8.7%
- By 2100
- 179,697 · -23.6%
Race, ethnicity, and origin ACS 2023
- Neighborhood character
- Predominantly White (88%)
- Race & ethnicity
- White 88% Two or more races 10% Hispanic / Latino 1%
- Common ancestry
- Lithuanian 5% Iranian 2% Italian 1%
- Foreign-born
- 1% · Canada
- Languages at home
- 98% English-only · Spanish 1%
Political lean MEDSL · Jefferson
- 2024 margin
- Solid R (+36.7) · D 31.0% · R 67.7% · Other 1.3%
- 2008→2024 swing
- -39.3pp toward R · 2008: 2.5pp · 2024: -36.7pp
- All cycles
- 2024: R+36.7 2020: R+33.9 2016: R+35.3 2012: R+12.7 2008: D+2.5
Not yet ingested
- Civics
- —
Market trends
- HPI YoY
- ▼ -60.90%
- Current HPI
- 217.2807
- Rent YoY
- —
- Metro
- —
- State GDP YoY
- ▲ 1.84%
- F500 in state
- 20
Industry mix (Fortune 500 HQ in MO)
| Industry | F500 HQs | Revenue |
|---|---|---|
| Healthcare | 1 | $163B |
|
||
| Insurance | 1 | $21B |
|
||
| Industrial Technology | 1 | $17B |
|
||
| Retail | 1 | $16B |
|
||
| Industrial Distribution | 1 | $10B |
|
||
| Utilities | 1 | $9B |
|
||
Price history
-20.6% since first listed4 events — show timeline
- 2026-04-23 Price Changed $81,000 MARIS as Distributed by MLS Grid
- 2026-03-23 Price Changed $86,388 MARIS as Distributed by MLS Grid
- 2026-02-12 Price Changed $93,900 MARIS as Distributed by MLS Grid
- 2026-01-09 Listed $102,000 MARIS as Distributed by MLS Grid
Property tax history
+3.1%/yrLatest (2025): $428 · +6.3% YoY. Source: county tax records.
Cash-flow waterfall
monthlySold comps — $/sqft
last 12 mo · ≤1 miLoading sold comps…