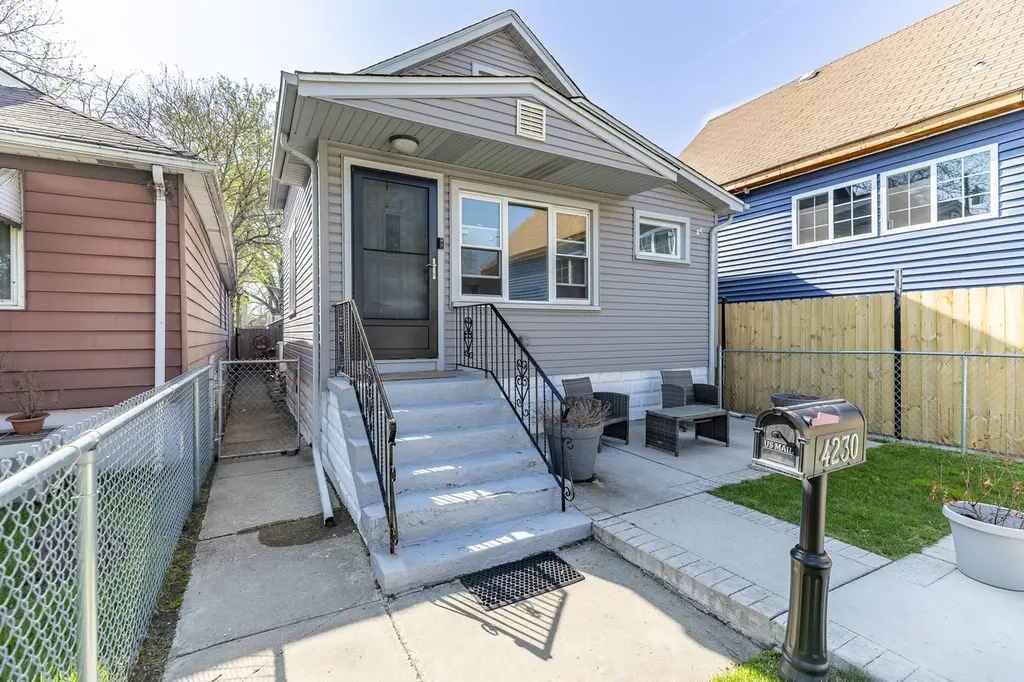
4230 Tod Ave · East Chicago, IN
Flood risk 1/10 · Minimal
- FEMA flood zone
- X (unshaded)
- Chance of flooding over 30 yrs
- 0.0%
- Est. flood insurance / yr
- $473 – $860
Fire risk 1/10 · Minimal
- Est. fire insurance / yr
- $717 – $1,331
Heat risk 3/10 · Minor
- Hot days now (above 101°F)
- 7 days/yr
- Hot days in 30 yrs
- 15 days/yr
Wind risk 2/10 · Minimal
- Chance of severe wind over 30 yrs
- 1.0%
Air-quality risk 4/10 · Minor
- Unhealthy air days now
- 5 days/yr
- Unhealthy air days in 30 yrs
- 6 days/yr
Risk factors via First Street. Map © Google.
Why this score? — see what drove the B grade
The composite is a weighted blend of 9 inputs, each scored 0–100. Each bar is that input's sub-score; the figure is the points it added to the 100-point composite (weight × sub-score).
- Cash flow +26.4/30.0
- ARV discount +12.9/15.0
- DSCR +9.0/10.0
- 1% rule +6.1/10.0
- Appreciation +4.8/10.0
- Rent growth +4.5/5.0
- Livability +3.2/5.0
- Condition / age +2.5/5.0
- Schools +0.8/10.0
$127,000
🖨 Deal sheet 📄 Offer letter ✓ Due diligence
Listing remarks MLS
QUICK POSSESSION ON THIS 2 BEDROOM BUNGALOW. LARGE YARD, CLOSE TO SCHOOLS, SHOPPING AND TRANSPORTATION. TAXES REFLECT HOMESTEAD AND OLD AGE EXEMPTIONS.
Key facts
- 3,549 sq ft lot
- Built 1920
- Listed 8 days
Property features AI
Finance
- Other: Occupant type: Owner
Exterior
- Parking: Off-street parking; Driveway; Concrete surface; Alley access
- Utilities: Public water; Public sewer; 200+ amp electric service
- Home design: One-story home; Built in 1920; Entry level: Main level with finished basement
- Construction: Vinyl siding; Shingle roof; Full, partially finished basement
- Exterior features: Neighborhood view; Back yard with chain link fencing; Private yard; Shed(s) / exterior storage; No pool
Interior
- Kitchen: Gas range; Stainless steel appliances; Refrigerator
- Bedrooms: Primary bedroom; Additional bedroom(s)
- Flooring: Tile; Vinyl
- Bathrooms: 1 full bathroom
- Heating & cooling: Hot water heating; Cooling: Other
- Interior features: Eat-in kitchen; Laminate counters; Private yard access; Storage space; Bonus room; Living room
- Laundry & utility: Washer and dryer included; Washer hookup; Gas dryer hookup; Laundry sink
Neighborhood map
What this means for you Summary
Snapshot
- This is a 3-bed/1.0-bath single-family listed at $127k.
Deal economics
- At list price, monthly cash flow is $331 ($4k/yr) — positive.
- The deal already cash-flows at list — no discount required.
- Meets the 1% rule at list price ($1k rent vs $127k).
Location & tenants
- Location reads 64/100 on livability (#371 in IN) — a middle-class / working-renter tenant base. Strengths: commute A+, cost of living A+, housing A; Watch: health & safety D+, schools F, crime F.
- School City Of East Chicago (suburban): math 7% / reading 15% proficiency, ranked #293 of 301 in IN (top 97%) — low school quality limits family demand, transient renter base, plan for 1-2y turnover; 89% free/reduced lunch — lower-income household profile, screen leases tightly.
- Market conditions: Rents rising fast (+8.1%/yr); 79 active listings in the ZIP; 2 comparable units currently listed for rent nearby; lower-income renter base — watch delinquency; 1,642 units permitted in Lake County in 2024 (14 in 5+ unit buildings).
- This rent runs 40% of the median local income ($42k/yr) — at the standard rent-burdened threshold; future hikes will face affordability resistance.
Forward outlook
- In year one you build about $493 of equity ($878 loan paydown + $-385 appreciation (-0.3% local appreciation)).
- Lake County population projected to shrink 7% by 2050 — rents likely to lag national; underwrite the cash flow, not the appreciation.
- At projected returns (-0.3% appreciation + 8.0% rent growth), your $36k cash investment doubles in ~6 years — after that, you're playing with house money.
Negotiation context
- Only 8 days on market — expect competitive offers; lowballing is unlikely to land.
- 3 sale attempts since 25y ago with the ask held roughly flat each time — persistent listings suggest the price (not the market) is what's stuck; bring a comps-based counter.
Risks & watch-outs
- Watch-outs: built in 1920 — expect roof / HVAC / electrical / plumbing capex.
Questions for the listing agent
- Built in 1920 — when were the roof, HVAC, electrical panel, plumbing, and water heater last replaced?
- Is there a deadline driving the sale (1031 exchange, divorce, estate, relocation)? That informs how much negotiation room exists.
- Schools are F-rated, which usually means shorter tenancies and higher turnover. Who's the typical renter profile here, and what's been the actual vacancy rate?
- Crime grade is F in this area — have there been break-ins, vandalism, or insurance claims at this property in the last 3 years? What carrier currently insures it and at what premium?
- What's the average days-on-market for RENTAL listings here right now (not sales)? A rising rental-DOM trend means longer vacancies and softer asking-rent achievability than the comps imply.
- What's the recent tenant-quality profile in this submarket — average credit score on applications, eviction rate, late-payment / NSF rate, and stable-employment percentage? A property-management company in the area should have these aggregated.
- How much new for-sale + rental construction is in the pipeline within 1–3 miles? Heavy new supply typically softens prices + rents 12–24 months out; constrained supply supports both.
Investment metrics
- 1% rule
- 1.11% ✓
- Cap rate
- 9.42%
- Cash-on-cash
- 11.17%
- DSCR
- 1.50
- GRM
- 7.5
CMA / ARV
- ARV (on-the-fly)
- $144,288
- Comps found
- 7
Show comp detail 7 sales within ~0.75 mi
| Address | Dist | Beds/Ba | Sqft | Sold | Price | $/sf | Match |
|---|---|---|---|---|---|---|---|
| 4230 Tod Ave | 0.00mi | 2/1.0 (-1) | 1,336 (0%) | 1mo | $144,000 | $108 | 94 |
| 534 Penrhyn Pl | 0.15mi | 3/1.0 | 1,248 (-7%) | 7mo | $152,000 | $122 | 76 |
| 510 W 142nd St | 0.13mi | 2/1.0 (-1) | 1,256 (-6%) | 4mo | $78,000 | $62 | 76 |
| 4227 Baring Ave | 0.24mi | 3/1.0 | 1,259 (-6%) | 5mo | $83,000 | $66 | 75 |
| 4217 Northcote Ave | 0.32mi | 3/1.0 | 1,242 (-7%) | 6mo | $110,000 | $89 | 68 |
| 4330 Olcott Ave | 0.14mi | 4/2.0 (+1) | 1,500 (+12%) | 0mo | $179,000 | $119 | 64 |
| 4206 Indianapolis Blvd | 0.15mi | 4/2.0 (+1) | 1,479 (+11%) | 22mo | $202,000 | $137 | 48 |
Match score weights: distance 35% · size 25% · config 20% · recency 20%. Top-matched comps best support the ARV.
Projected returns pro-forma
-0.3% appreciation · 8.0% rent growth · sell at horizon
- IRR
- 13.2%
- Equity multiple
- 1.65×
- Total profit
- $22,988
- Equity at exit
- $34,961
- IRR
- 21.4%
- Equity multiple
- 3.69×
- Total profit
- $95,608
- Equity at exit
- $40,526
Cash invested: $35,560 (down + closing). Projections, not guarantees.
Landlord ↔ Tenant lean methodology
- Overall (STATE)
- 90 Strongly Landlord-Friendly
- State Indiana
- 90 Strongly Landlord-Friendly · R+11
- County
- — inherits STATE
- City
- — inherits STATE
ZIP-level market 46312
- Home prices YoY
- -0.1%
- Rents YoY
- 8.1%
- Active inventory
- 79
- Price-to-rent
- 7.5×
Monthly cashflow live
- Estimated rent
- $1,411 medium interval (Pro) →
- Mortgage (P&I)
- −$666
- Tax from tax record
- −$65 /mo · $775/yr
- Insurance
- −$53
- HOA
- −$0
- Vacancy / Maint / Mgmt
- −$296
- Net cashflow
- $331
Break-even live
UW: 25.0% down · 7.5% · 30yr · 1.5% tax · 5.0% vac · 8.0% maint · 8.0% mgmt
Financing live
Cash to close
- Down payment
- $31,750
- Closing costs
- $3,810
- Reserves months
- —
- Total cash needed
- —
Loan-product check · same deal, 3 products live
Conventional
25% down · 7.5% · 30yr
- Down + closing
- —
- Monthly P&I
- —
- Monthly cashflow
- —
- DSCR
- —
- Eligible?
- —
Personal DTI + credit; lowest rate.
DSCR
20% down · 8.5% · 30yr
- Down + closing
- —
- Monthly P&I
- —
- Monthly cashflow
- —
- DSCR
- —
- Eligible?
- —
No personal income docs; deal must DSCR.
Hard money
10% down · 12.0% · 12mo
- Down + closing
- —
- Monthly P&I
- —
- Monthly cashflow
- —
- DSCR
- —
- Eligible?
- —
Short-term bridge; refi at stabilization.
Rent comps 2 comps
| Address | Beds | Baths | Sqft | Rent | $/sqft | DOM | Units | Dist |
|---|---|---|---|---|---|---|---|---|
| 4001 McCook Ave Unit 2 East Chicago, IN | 3.0 | 1.0 | 960 | $1,650 | $1.72 | 2d | 1 | 0.78mi |
| 1311 E # E Unit Columbus Dr unit 1 East Chicago, IN | 3.0 | 1.5 | 1056 | $1,350 | $1.28 | 7d | 1 | 1.25mi |
Listing history 5 events
-
2026-05-04status Pending
-
2026-04-30status Active
-
2026-04-28status Pending
-
2026-04-24$127,000 Active
-
2001-10-18$42,000 151-char remark
Show marketing remark (151 chars)
QUICK POSSESSION ON THIS 2 BEDROOM BUNGALOW. LARGE YARD, CLOSE TO SCHOOLS, SHOPPING AND TRANSPORTATION. TAXES REFLECT HOMESTEAD AND OLD AGE EXEMPTIONS.
ⓘ Source: listings_history table (triggers on properties + properties_extension) + one-shot
backfill from property_details.listing_events for pre-trigger history.
Tax reassessment forecast IN · Partial reset (capped growth)
- Current annual tax
- $775 · $65/mo
- Projected year-2 tax
- $927 · $77/mo
- Expected delta
- +$152/yr (+$13/mo · 19.7%)
ⓘ Screening estimate from a state-policy table — verify with the county assessor before closing.
Climate risk First Street
- Flood 1/10 Low FEMA zone X (unshaded) · 0% chance over 30 yrs
- Wildfire 1/10 Low
- Heat 3/10 Moderate 7 d/yr ≥101°F today · 15 d/yr by 30 yrs out
- Wind 2/10 Low 100% chance of damaging wind over 30 yrs
- Air quality 4/10 Moderate 5 unhealthy d/yr today · 6 by 30 yrs out
Nearby sold comps map
Loading sold comps map…
Walkable amenities ~0.75 mi
Loading nearby amenities…
Taxation est. · year 1
- Rental income
- $16,930
- − Mortgage interest
- −$7,114
- − Property taxes
- −$775
- − Insurance
- −$635
- − Repairs & maintenance
- −$1,354
- − Management
- −$1,354
- − Depreciation
- −$3,695
- Taxable income
- $2,003
- Est. tax owed @ 24.0%
- −$481
- After-tax cash flow
- $3,492/yr
For passive investors: Depreciation is non-cash, so a rental often shows a tax loss while cash-flowing — sheltering income. Rental losses are passive: they offset passive income freely, and up to $25,000/yr can offset ordinary (W-2) income if you actively participate and your MAGI is under $100k (phasing out to $0 by $150k); unused losses carry forward. On sale, claimed depreciation is recaptured at up to 25%, and gains may owe capital-gains tax (a 1031 exchange can defer both). Figures are a year-1 estimate at your 24.0% rate — not tax advice; consult a CPA.
Schools (NCES district)
- District
- School City Of East Chicago
- NCES district ID
- 1802880
- Math proficiency
- 7% ▼ -10.00%
- Reading proficiency
- 15% ▼ -7.00%
- Median HH income
- $28,423
- Composite
- 8.36/100
- National rank
- #9909
- State rank
- #293 of 301 in IN
Livability — East Chicago
- Score
- 64/100
- State rank
- #371
- US rank
- #13869
Category grades
Schools grade is shown separately in the Schools card above.
Census & demographics
- Census place
- East Chicago, IN
- County
- Lake County · 422,878 people
- City population
- 26,022
- Metro
- Chicago-Naperville-Elgin, IL-IN-WI
- Population (ZIP)
- 26,022
- Household income
- $42,125
- Rent vs Own
- Severe rent burden
- 1227.0
Population outlook (Lake County) Hauer SSP2
- Today (2025)
- 484,026 people
- By 2030
- 478,091 · -1.2%
- By 2040
- 462,974 · -4.3%
- By 2050
- 449,894 · -7.1%
- By 2075
- 436,169 · -9.9%
- By 2100
- 426,607 · -11.9%
Race, ethnicity, and origin ACS 2023
- Neighborhood character
- Majority Hispanic (56%)
- Race & ethnicity
- Hispanic / Latino 56% Black 36% Two or more races 11% White 7%
- Hispanic origin (detail)
- Mexican 45% Puerto Rican 6%
- Common ancestry
- Romanian 2%
- Foreign-born
- 16% · Canada
- Languages at home
- 59% English-only · Spanish 40%
Political lean MEDSL · Lake
- 2024 margin
- Lean D (+5.6) · D 52.1% · R 46.5% · Other 1.5%
- 2008→2024 swing
- -28.6pp toward R · 2008: 34.3pp · 2024: 5.6pp
- All cycles
- 2024: D+5.6 2020: D+15.1 2016: D+20.6 2012: D+31.0 2008: D+34.3
Not yet ingested
- Civics
- —
Market trends
- HPI YoY
- ▼ -0.30%
- Current HPI
- 267.9232
- Rent YoY
- ▲ 8.06%
- Metro
- Chicago-Naperville-Elgin, IL-IN-WI
- State GDP YoY
- ▲ 2.90%
- F500 in state
- 18
Industry mix (Fortune 500 HQ in IN)
| Industry | F500 HQs | Revenue |
|---|---|---|
| Industrial Machinery | 2 | $37B |
|
||
| Healthcare | 1 | $177B |
|
||
| Pharmaceuticals | 1 | $45B |
|
||
| Metals / Steel | 1 | $18B |
|
||
| Agriculture | 1 | $17B |
|
||
| Packaging | 1 | $12B |
|
||
Price history
+202.4% since first listed5 events — show timeline
- 2026-05-04 Pending — NIRA MLS as Distributed by MLS Grid
- 2026-04-30 Relisted — NIRA MLS as Distributed by MLS Grid
- 2026-04-28 Pending — NIRA MLS as Distributed by MLS Grid
- 2026-04-24 Listed $127,000 NIRA MLS as Distributed by MLS Grid
- 2001-10-18 Listed $42,000 NIRA MLS as Distributed by MLS Grid
Property tax history
+29.8%/yrLatest (2024): $775 · +11.9% YoY. Source: county tax records.
Cash-flow waterfall
monthlySold comps — $/sqft
last 12 mo · ≤1 miLoading sold comps…