8236 SW 48th Ln · Worthington Springs, FL
Flood risk No data
- FEMA flood zone
- —
- Chance of flooding over 30 yrs
- %
- Est. flood insurance / yr
- —
Fire risk No data
- Est. fire insurance / yr
- —
Heat risk No data
- Hot days now (above °F)
- days/yr
- Hot days in 30 yrs
- days/yr
Wind risk No data
- Chance of severe wind over 30 yrs
- %
Air-quality risk No data
- Unhealthy air days now
- days/yr
- Unhealthy air days in 30 yrs
- days/yr
Risk factors via First Street. Map © Google.
Why this score? — see what drove the A- grade
The composite is a weighted blend of 9 inputs, each scored 0–100. Each bar is that input's sub-score; the figure is the points it added to the 100-point composite (weight × sub-score).
- Cash flow +30.0/30.0
- DSCR +10.0/10.0
- Appreciation +10.0/10.0
- 1% rule +9.9/10.0
- ARV discount +7.5/15.0
- Schools +4.9/10.0
- Livability +3.2/5.0
- Rent growth +2.5/5.0
- Condition / age +2.5/5.0
$85,000
🖨 Deal sheet 📄 Offer letter ✓ Due diligence
Listing remarks
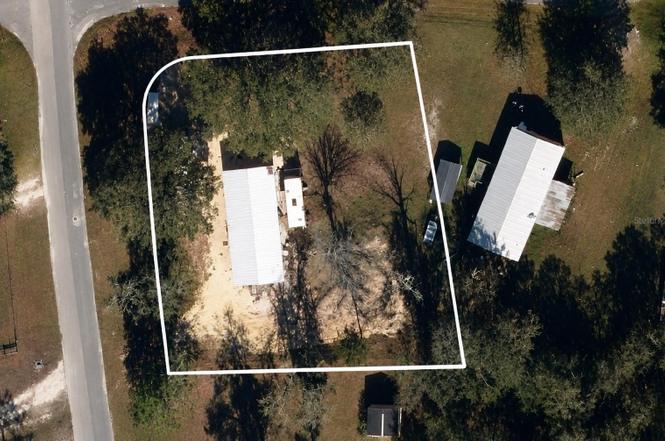
More photos coming soon. Opportunity awaits at 8236 NW 48th Lane in Lake Butler. Situated on a cleared 0.51-acre corner lot, this property features a 1990 double-wide mobile home offering approximately 1,750 square feet with a 3-bedroom, 2-bathroom layout. The mobile home has been completely gutted, providing a blank slate for renovation, redesign, or potential replacement. Electric and septic have been added, giving the next owner a head start on improving the property. With the lot already cleared and positioned on a corner, this property offers flexibility for buyers looking for a renovation project, investment opportunity, or future homesite. Located in Lake Butler, it provides space, u
Key facts
- Future homesite
- 0.51 acre lot
- Built 1990
Tags
Neighborhood map
What this means for you Summary
Snapshot
- This is a 3-bed/2.0-bath manufactured listed at $85k.
Deal economics
- At list price, monthly cash flow is $415 ($5k/yr) — positive.
- The deal already cash-flows at list — no discount required.
- Meets the 1% rule at list price ($1k rent vs $85k).
Location & tenants
- Location reads 64/100 on livability (#689 in FL) — a middle-class / working-renter tenant base. Strengths: cost of living A+, health & safety A+, housing A; Watch: employment D+, schools F, amenities F.
- Union (town): math 62% / reading 54% proficiency, ranked #17 of 73 in FL (top 23%) — acceptable for families but not a draw, mixed tenant base, ~2y average lease.
- Market conditions: 65 active listings in the ZIP; 45 units permitted in Union County in 2024 (0 in 5+ unit buildings).
Forward outlook
- In year one you build about $9k of equity ($588 loan paydown + $8k appreciation (10.0% local appreciation)).
- Union County population projected to shrink 9% by 2050 — rents likely to lag national; underwrite the cash flow, not the appreciation.
- At projected returns (10.0% appreciation + 3.0% rent growth), your $24k cash investment doubles in ~2 years — after that, you're playing with house money.
- By year 4, paydown + projected appreciation supports a ~$32k cash-out refi (75% LTV) — recoverable capital for the next deal without selling this one.
Negotiation context
- Only 1 days on market — expect competitive offers; lowballing is unlikely to land.
Questions for the listing agent
- Is there a deadline driving the sale (1031 exchange, divorce, estate, relocation)? That informs how much negotiation room exists.
- Schools are F-rated, which usually means shorter tenancies and higher turnover. Who's the typical renter profile here, and what's been the actual vacancy rate?
- What's the average days-on-market for RENTAL listings here right now (not sales)? A rising rental-DOM trend means longer vacancies and softer asking-rent achievability than the comps imply.
- What's the recent tenant-quality profile in this submarket — average credit score on applications, eviction rate, late-payment / NSF rate, and stable-employment percentage? A property-management company in the area should have these aggregated.
- How much new for-sale + rental construction is in the pipeline within 1–3 miles? Heavy new supply typically softens prices + rents 12–24 months out; constrained supply supports both.
Investment metrics
- 1% rule
- 1.49% ✓
- Cap rate
- 12.15%
- Cash-on-cash
- 20.92%
- DSCR
- 1.93
- GRM
- 5.6
CMA / ARV
- ARV (on-the-fly)
- $271,250
- Comps found
- 2
Show comp detail 2 sales within ~0.75 mi
| Address | Dist | Beds/Ba | Sqft | Sold | Price | $/sf | Match |
|---|---|---|---|---|---|---|---|
| 8274 SW 48th Ln | 0.03mi | 3/2.0 | 1,488 (-15%) | 20mo | $105,000 | $71 | 57 |
| 4829 NW 87th Ter | 0.51mi | 3/2.0 | 1,512 (-14%) | 18mo | $234,900 | $155 | 38 |
Match score weights: distance 35% · size 25% · config 20% · recency 20%. Top-matched comps best support the ARV.
Projected returns pro-forma
10.0% appreciation · 3.0% rent growth · sell at horizon
- IRR
- 39.9%
- Equity multiple
- 4.06×
- Total profit
- $72,737
- Equity at exit
- $76,575
- IRR
- 34.4%
- Equity multiple
- 9.13×
- Total profit
- $193,456
- Equity at exit
- $165,136
Cash invested: $23,800 (down + closing). Projections, not guarantees.
Landlord ↔ Tenant lean methodology
- Overall (STATE)
- 87 Strongly Landlord-Friendly
- State Florida
- 87 Strongly Landlord-Friendly · R+3
- County
- — inherits STATE
- City
- — inherits STATE
ZIP-level market 32054
- Home prices YoY
- 16.6%
- Active inventory
- 65
- Price-to-rent
- 5.6×
Monthly cashflow live
- Estimated rent
- $1,269 medium interval (Pro) →
- Mortgage (P&I)
- −$446
- Tax est. 1.5%
- −$106 /mo · $1,275/yr
- Insurance
- −$35
- HOA
- −$0
- Vacancy / Maint / Mgmt
- −$266
- Net cashflow
- $415
Break-even live
UW: 25.0% down · 7.5% · 30yr · 1.5% tax · 5.0% vac · 8.0% maint · 8.0% mgmt
Financing live
Cash to close
- Down payment
- $21,250
- Closing costs
- $2,550
- Reserves months
- —
- Total cash needed
- —
Loan-product check · same deal, 3 products live
Conventional
25% down · 7.5% · 30yr
- Down + closing
- —
- Monthly P&I
- —
- Monthly cashflow
- —
- DSCR
- —
- Eligible?
- —
Personal DTI + credit; lowest rate.
DSCR
20% down · 8.5% · 30yr
- Down + closing
- —
- Monthly P&I
- —
- Monthly cashflow
- —
- DSCR
- —
- Eligible?
- —
No personal income docs; deal must DSCR.
Hard money
10% down · 12.0% · 12mo
- Down + closing
- —
- Monthly P&I
- —
- Monthly cashflow
- —
- DSCR
- —
- Eligible?
- —
Short-term bridge; refi at stabilization.
Listing history 2 events
-
2026-06-19remarks 699-char remark
-
2026-06-19$85,000 Active 1 DOM
ⓘ Source: listings_history table (triggers on properties + properties_extension) + one-shot
backfill from property_details.listing_events for pre-trigger history.
Nearby sold comps map
Loading sold comps map…
Walkable amenities ~0.75 mi
Loading nearby amenities…
Taxation est. · year 1
- Rental income
- $15,225
- − Mortgage interest
- −$4,761
- − Property taxes
- −$1,275
- − Insurance
- −$425
- − Repairs & maintenance
- −$1,218
- − Management
- −$1,218
- − Depreciation
- −$2,473
- Taxable income
- $3,855
- Est. tax owed @ 24.0%
- −$925
- After-tax cash flow
- $4,054/yr
For passive investors: Depreciation is non-cash, so a rental often shows a tax loss while cash-flowing — sheltering income. Rental losses are passive: they offset passive income freely, and up to $25,000/yr can offset ordinary (W-2) income if you actively participate and your MAGI is under $100k (phasing out to $0 by $150k); unused losses carry forward. On sale, claimed depreciation is recaptured at up to 25%, and gains may owe capital-gains tax (a 1031 exchange can defer both). Figures are a year-1 estimate at your 24.0% rate — not tax advice; consult a CPA.
Schools (NCES district)
- District
- Union
- NCES district ID
- 1201890
- Math proficiency
- 62% ▼ -11.00%
- Reading proficiency
- 54% ▼ -7.00%
- Median HH income
- $40,908
- Composite
- 48.59/100
- National rank
- #2111
- State rank
- #17 of 73 in FL
Livability — Worthington Springs
- Score
- 64/100
- State rank
- #689
- US rank
- #14375
Category grades
Schools grade is shown separately in the Schools card above.
Census & demographics
- City population
- 156
- Population (ZIP)
- 12,467
Population outlook (Union County) Hauer SSP2
- Today (2025)
- 14,613 people
- By 2030
- 14,322 · -2.0%
- By 2040
- 13,780 · -5.7%
- By 2050
- 13,325 · -8.8%
- By 2075
- 11,965 · -18.1%
- By 2100
- 9,102 · -37.7%
Race, ethnicity, and origin ACS 2023
- Neighborhood character
- Predominantly White (75%)
- Race & ethnicity
- White 75% Black 14% Two or more races 8% Hispanic / Latino 4%
- Common ancestry
- Slovak 2% Lithuanian 1% Italian 1%
- Foreign-born
- 2% · Canada
- Languages at home
- 95% English-only · Spanish 4%
Political lean MEDSL · Union
- 2024 margin
- Solid R (+68.3) · D 15.6% · R 83.8%
- 2008→2024 swing
- -18.4pp toward R · 2008: -49.9pp · 2024: -68.3pp
- All cycles
- 2024: R+68.3 2020: R+65.3 2016: R+62.4 2012: R+49.0 2008: R+49.9
Not yet ingested
- Civics
- —
Market trends
- HPI YoY
- ▲ 33.99%
- Current HPI
- 239.3346
- Rent YoY
- —
- Metro
- —
- State GDP YoY
- ▲ 3.28%
- F500 in state
- 36
Industry mix (Fortune 500 HQ in FL)
| Industry | F500 HQs | Revenue |
|---|---|---|
| Industrial Technology | 2 | $29B |
|
||
| Insurance | 2 | $17B |
|
||
| Retail | 1 | $60B |
|
||
| Technology Distribution | 1 | $58B |
|
||
| Homebuilding | 1 | $35B |
|
||
| Technology Manufacturing | 1 | $35B |
|
||
Cash-flow waterfall
monthlySold comps — $/sqft
last 12 mo · ≤1 miLoading sold comps…