 🏗️ New Construction
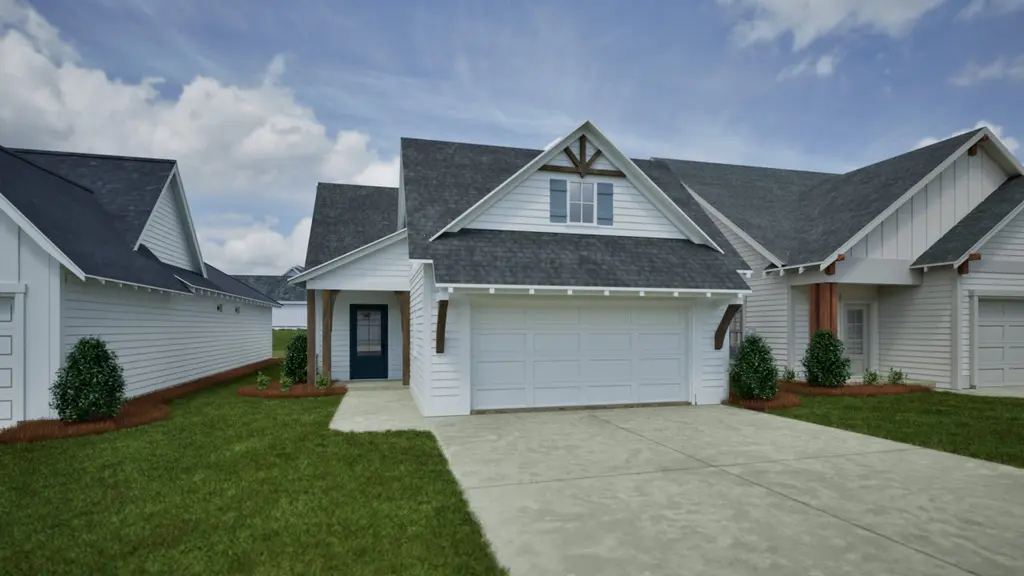
Hampton B Plan · Opelika, AL
Flood risk No data
- FEMA flood zone
- —
- Chance of flooding over 30 yrs
- —
- Est. flood insurance / yr
- —
Fire risk No data
- Est. fire insurance / yr
- —
Heat risk No data
- Hot days now (above threshold)
- —
- Hot days in 30 yrs
- —
Wind risk No data
- Chance of severe wind over 30 yrs
- —
Air-quality risk No data
- Unhealthy air days now
- —
- Unhealthy air days in 30 yrs
- —
Risk factors via First Street. Map © Google.
Why this score? — see what drove the F grade
The composite is a weighted blend of 9 inputs, each scored 0–100. Each bar is that input's sub-score; the figure is the points it added to the 100-point composite (weight × sub-score).
- ARV discount +7.5/15.0
- Rent growth +4.1/5.0
- Cash flow +3.7/30.0
- Livability +3.2/5.0
- Schools +2.9/10.0
- Condition / age +2.5/5.0
- 1% rule +0.0/10.0
- DSCR +0.0/10.0
- Appreciation +0.0/10.0
$272
🖨 Deal sheet 📄 Offer letter ✓ Due diligence
Listing remarks
Welcome to the Hampton floor plan! The Hampton features four bedrooms, two and a half bathrooms and spans across 1,535 square feet. The front of the home features a covered front porch and two car garage. As you make your way into the home, you enter into the foyer with a drop zone and powder bath leading into the open concept living room with a vaulted ceiling. The open concept living area flows seamlessly into the kitchen and dining. Beautiful windows in the dining area create a warm and inviting space. The primary bedroom and en suite is privately tucked away. Bedrooms two, three and four rest towards the back of the home along with the laundry room and full bathroom.
Key facts
- Covered front porch
- Laundry room
- Dining area
Tags
Neighborhood map
What this means for you Summary
Snapshot
- This is a 4-bed/2.5-bath single-family listed at $272.
Deal economics
- At list price, monthly cash flow is $-1k ($-14k/yr) — negative.
- The deal already cash-flows at list — no discount required.
- Meets the 1% rule at list price ($2k rent vs $272).
- Recommended offer: $263 (3.3% below list) — sets the bar for market timing.
- Cap rate 2.8% vs local median 3.8% in Opelika — below-typical yield; the buyer is paying a premium for something (appreciation thesis, condition, location) that the cap rate doesn't capture.
Location & tenants
- Location reads 63/100 on livability (#188 in AL) — a middle-class / working-renter tenant base. Strengths: cost of living A+, housing A+; Watch: schools C-, employment C-, crime F.
- Opelika City (urban): math 27% / reading 43% proficiency, ranked #45 of 129 in AL (top 35%) — families likely to look elsewhere, expect single-tenant / working-renter base with shorter leases; 62% free/reduced lunch — lower-income household profile, screen leases tightly.
- Market conditions: Rents rising fast (+6.2%/yr); 532 active listings in the ZIP; 1,858 units permitted in Lee County in 2024 (113 in 5+ unit buildings).
- This rent runs 38% of the median local income ($62k/yr) — at the standard rent-burdened threshold; future hikes will face affordability resistance.
Forward outlook
- Local home prices are declining (-3.0%/yr); year-one equity from $3k of loan paydown is wiped out by about $12k of value loss. Plan a longer hold.
- Lee County population projected at +54% by 2050 — long-run rental-demand tailwind backs the buy-and-hold thesis.
Negotiation context
- It's been on market 40 days — a 3% lower offer ($263) is reasonable based on typical stale-listing flexibility.
Risks & watch-outs
- Watch-outs: property tax is 2135.8% of price.
Questions for the listing agent
- What do current leases actually rent for vs. the listed asking? Can we see a recent rent roll and the last 12 months of T-12 income?
- It's been on market 40 days. Have you received any prior offers? Is the seller open to a 3% concession, seller financing, or rate buy-down credit?
- Property tax is high relative to price — has the assessment been appealed recently, and will the sale trigger a re-assessment?
- Is there a deadline driving the sale (1031 exchange, divorce, estate, relocation)? That informs how much negotiation room exists.
- Crime grade is F in this area — have there been break-ins, vandalism, or insurance claims at this property in the last 3 years? What carrier currently insures it and at what premium?
- The area grade is low — what's the realistic commute time and amenity access for the typical tenant pool here? Any planned neighborhood developments (good or bad) we should know about?
- What's the average days-on-market for RENTAL listings here right now (not sales)? A rising rental-DOM trend means longer vacancies and softer asking-rent achievability than the comps imply.
- What's the recent tenant-quality profile in this submarket — average credit score on applications, eviction rate, late-payment / NSF rate, and stable-employment percentage? A property-management company in the area should have these aggregated.
- How much new for-sale + rental construction is in the pipeline within 1–3 miles? Heavy new supply typically softens prices + rents 12–24 months out; constrained supply supports both.
Investment metrics
- 1% rule
- 0.50% ✗
- Cap rate
- 2.79%
- Cash-on-cash
- -12.52%
- DSCR
- 0.44
- GRM
- 16.5
CMA / ARV
- ARV (median comp)
- $387,288
- List price
- $272
- Delta
- -99.93%
- Verdict
- UNDERPRICED
- Comps
- 14 within 1.0 mi
Show comp detail 6 sales within ~0.75 mi
| Address | Dist | Beds/Ba | Sqft | Sold | Price | $/sf | Match |
|---|---|---|---|---|---|---|---|
| 161 Firefly Ln | 0.12mi | 4/2.5 | 1,535 (0%) | 3mo | $388,800 | $253 | 92 |
| 136 Firefly Ln | 0.05mi | 3/2.5 (-1) | 1,684 (+10%) | 8mo | $380,630 | $226 | 70 |
| 250 Firefly Ln | 0.21mi | 3/2.5 (-1) | 1,660 (+8%) | 3mo | $385,776 | $232 | 70 |
| 143 Firefly Ln | 0.08mi | 3/2.5 (-1) | 1,691 (+10%) | 8mo | $378,221 | $224 | 67 |
| 135 Firefly Ln | 0.07mi | 3/2.0 (-1) | 1,411 (-8%) | 12mo | $360,913 | $256 | 66 |
| 251 Firefly Ln | 0.22mi | 3/2.0 (-1) | 1,411 (-8%) | 6mo | $353,919 | $251 | 64 |
Match score weights: distance 35% · size 25% · config 20% · recency 20%. Top-matched comps best support the ARV.
Projected returns pro-forma
-3.0% appreciation · 6.25% rent growth · sell at horizon
- IRR
- -36.1%
- Equity multiple
- -0.18×
- Total profit
- $-128,213
- Equity at exit
- $57,746
- IRR
- -32.9%
- Equity multiple
- -0.62×
- Total profit
- $-175,387
- Equity at exit
- $33,486
Cash invested: $108,441 (down + closing). Projections, not guarantees.
Landlord ↔ Tenant lean methodology
- Overall (STATE)
- 90 Strongly Landlord-Friendly
- State Alabama
- 90 Strongly Landlord-Friendly · R+15
- County
- — inherits STATE
- City
- — inherits STATE
ZIP-level market 36801
- Home prices YoY
- -30.9%
- Rents YoY
- 6.2%
- Active inventory
- 532
Monthly cashflow live
- Estimated rent
- $1,955 medium interval (Pro) →
- Mortgage (P&I)
- −$2,031
- Tax est. 1.5%
- −$484 /mo · $5,809/yr
- Insurance
- −$161
- HOA
- −$0
- Vacancy / Maint / Mgmt
- −$411
- Net cashflow
- $-1,132
Break-even live
UW: 25.0% down · 7.5% · 30yr · 1.5% tax · 5.0% vac · 8.0% maint · 8.0% mgmt
Financing live
Cash to close
- Down payment
- $96,822
- Closing costs
- $11,619
- Reserves months
- —
- Total cash needed
- —
Loan-product check · same deal, 3 products live
Conventional
25% down · 7.5% · 30yr
- Down + closing
- —
- Monthly P&I
- —
- Monthly cashflow
- —
- DSCR
- —
- Eligible?
- —
Personal DTI + credit; lowest rate.
DSCR
20% down · 8.5% · 30yr
- Down + closing
- —
- Monthly P&I
- —
- Monthly cashflow
- —
- DSCR
- —
- Eligible?
- —
No personal income docs; deal must DSCR.
Hard money
10% down · 12.0% · 12mo
- Down + closing
- —
- Monthly P&I
- —
- Monthly cashflow
- —
- DSCR
- —
- Eligible?
- —
Short-term bridge; refi at stabilization.
Listing history 6 events
-
2026-06-03days on market $272 Active 40 DOM
-
2026-06-02days on market $272 Active 39 DOM
-
2026-06-01days on market $272 Active 38 DOM
-
2026-05-31days on market $272 Active 37 DOM
-
2026-05-30days on market $272 Active 36 DOM
-
2026-04-24$269 Active 631-char remark
ⓘ Source: listings_history table (triggers on properties + properties_extension) + one-shot
backfill from property_details.listing_events for pre-trigger history.
Nearby sold comps map
Loading sold comps map…
Walkable amenities ~0.75 mi
Loading nearby amenities…
Taxation est. · year 1
- Rental income
- $23,463
- − Mortgage interest
- −$21,694
- − Property taxes
- −$5,809
- − Insurance
- −$1,936
- − Repairs & maintenance
- −$1,877
- − Management
- −$1,877
- − Depreciation
- −$11,267
- Taxable loss
- −$20,998
- Est. tax savings @ 24.0%
- +$5,039
- After-tax cash flow
- $-8,543/yr
For passive investors: Depreciation is non-cash, so a rental often shows a tax loss while cash-flowing — sheltering income. Rental losses are passive: they offset passive income freely, and up to $25,000/yr can offset ordinary (W-2) income if you actively participate and your MAGI is under $100k (phasing out to $0 by $150k); unused losses carry forward. On sale, claimed depreciation is recaptured at up to 25%, and gains may owe capital-gains tax (a 1031 exchange can defer both). Figures are a year-1 estimate at your 24.0% rate — not tax advice; consult a CPA.
Schools (NCES district)
- District
- Opelika City
- NCES district ID
- 0102580
- Math proficiency
- 27% ▼ -25.00%
- Reading proficiency
- 43% ▼ -1.00%
- Median HH income
- $40,081
- Composite
- 29.34/100
- National rank
- #6541
- State rank
- #45 of 129 in AL
Livability — Opelika
- Score
- 63/100
- State rank
- #188
- US rank
- #15556
Category grades
Schools grade is shown separately in the Schools card above.
Census & demographics
- County
- Lee County · 144,175 people
- City population
- 45,973
- Metro
- Auburn-Opelika, AL
- Population (ZIP)
- 25,438
- Household income
- $62,414
- Rent vs Own
- Severe rent burden
- 1025.0
Population outlook (Lee County) Hauer SSP2
- Today (2025)
- 196,440 people
- By 2030
- 217,417 · +10.7%
- By 2040
- 259,467 · +32.1%
- By 2050
- 301,557 · +53.5%
- By 2075
- 402,186 · +104.7%
- By 2100
- 474,503 · +141.6%
Race, ethnicity, and origin ACS 2023
- Neighborhood character
- Diverse neighborhood (Simpson 0.58)
- Race & ethnicity
- White 53% Black 37% Hispanic / Latino 8% Two or more races 3% Asian 1%
- Hispanic origin (detail)
- Mexican 2% Cuban 1%
- Common ancestry
- Slovak 3% Italian 2% Serbian 2%
- Foreign-born
- 4% · Canada, Vietnam
- Languages at home
- 94% English-only · Spanish 4% Chinese 1%
Political lean MEDSL · Lee
- 2024 margin
- Strong R (+27.8) · D 35.5% · R 63.3% · Other 1.2%
- 2008→2024 swing
- -8.1pp toward R · 2008: -19.8pp · 2024: -27.8pp
- All cycles
- 2024: R+27.8 2020: R+20.1 2016: R+23.1 2012: R+19.9 2008: R+19.8
Not yet ingested
- Civics
- —
Market trends
- HPI YoY
- ▼ -116.80%
- Current HPI
- 261.6632
- Rent YoY
- ▲ 6.25%
- Metro
- Auburn-Opelika, AL
- State GDP YoY
- ▲ 2.94%
- F500 in state
- 4
Industry mix (Fortune 500 HQ in AL)
| Industry | F500 HQs | Revenue |
|---|---|---|
| Financial Services | 1 | $8B |
|
||
| Healthcare | 1 | $5B |
|
||
Cash-flow waterfall
monthlySold comps — $/sqft
last 12 mo · ≤1 miLoading sold comps…