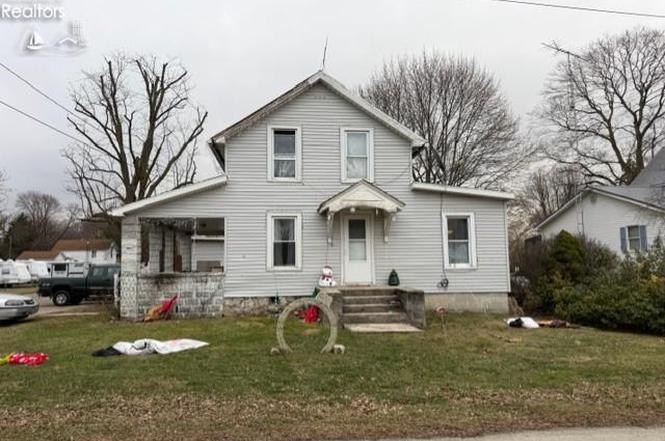
5982 N State Route 635 · Kansas, OH
Flood risk No data
- FEMA flood zone
- —
- Chance of flooding over 30 yrs
- —
- Est. flood insurance / yr
- —
Fire risk No data
- Est. fire insurance / yr
- —
Heat risk No data
- Hot days now (above threshold)
- —
- Hot days in 30 yrs
- —
Wind risk No data
- Chance of severe wind over 30 yrs
- —
Air-quality risk No data
- Unhealthy air days now
- —
- Unhealthy air days in 30 yrs
- —
Risk factors via First Street. Map © Google.
Why this score? — see what drove the B+ grade
The composite is a weighted blend of 9 inputs, each scored 0–100. Each bar is that input's sub-score; the figure is the points it added to the 100-point composite (weight × sub-score).
- Cash flow +30.0/30.0
- DSCR +10.0/10.0
- 1% rule +9.7/10.0
- Appreciation +8.0/10.0
- ARV discount +7.5/15.0
- Schools +5.4/10.0
- Livability +3.2/5.0
- Rent growth +2.5/5.0
- Condition / age +2.5/5.0
$75,000
🖨 Deal sheet 📄 Offer letter ✓ Due diligence
Listing remarks
INVESTMENT OPPORTUNITYAdd this family home to your portfolio!Featuring 3 bedrooms and 1 bathroom. This property is located in the Lakota School District. Enjoy some newer flooring on the main level and the convenience of being right in town, with little traffic. This home is close to shopping markets minutes away. A great opportunity for investors looking for value and location. Sellers will consider all reasonable offers.
Key facts
- Newer flooring
- 8,250 sq ft lot
- Garage
Tags
Property features AI
Exterior
- Parking: Off-street parking; Detached parking structure
- Utilities: Private well water; Septic tank sewer
- Home design: Single-family residential property
- Construction: Vinyl siding
- Exterior features: Asphalt and metal roof
Interior
- Bathrooms: One full bathroom
- Heating & cooling: Natural gas forced-air heating
- Interior features: Six total rooms
- Laundry & utility: Laundry located in the basement
Neighborhood map
What this means for you Summary
Snapshot
- This is a 3-bed/1.0-bath single-family listed at $75k.
Deal economics
- At list price, monthly cash flow is $351 ($4k/yr) — positive.
- The deal already cash-flows at list — no discount required.
- Meets the 1% rule at list price ($1k rent vs $75k).
- Recommended offer: $66k (12.0% below list) — sets the bar for market timing.
Location & tenants
- Location reads 65/100 on livability (#748 in OH) — a middle-class / working-renter tenant base. Strengths: schools A+, cost of living A+, crime A; Watch: amenities F, commute F, health & safety F.
- Lakota Local (rural): math 60% / reading 66% proficiency, ranked #236 of 656 in OH (top 36%) — acceptable for families but not a draw, mixed tenant base, ~2y average lease.
- Market conditions: 2 active listings in the ZIP; 45 units permitted in Seneca County in 2024 (0 in 5+ unit buildings).
Forward outlook
- In year one you build about $5k of equity ($519 loan paydown + $4k appreciation (5.9% local appreciation)).
- Seneca County population projected at -14% by 2050 — secular population decline; favor cash flow + early exit over multi-decade hold.
- At projected returns (5.9% appreciation + 3.0% rent growth), your $21k cash investment doubles in ~3 years — after that, you're playing with house money.
- By year 7, paydown + projected appreciation supports a ~$33k cash-out refi (75% LTV) — recoverable capital for the next deal without selling this one.
Negotiation context
- It's been on market 152 days — a 12% lower offer ($66k) is reasonable based on typical stale-listing flexibility.
Risks & watch-outs
- Watch-outs: built in 1900 — expect roof / HVAC / electrical / plumbing capex.
Questions for the listing agent
- It's been on market 152 days. Have you received any prior offers? Is the seller open to a 12% concession, seller financing, or rate buy-down credit?
- Built in 1900 — when were the roof, HVAC, electrical panel, plumbing, and water heater last replaced?
- Why hasn't it sold? Are there any deal-killer items the seller is aware of (foundation, flood, title, zoning, code violations)?
- Is there a deadline driving the sale (1031 exchange, divorce, estate, relocation)? That informs how much negotiation room exists.
- Schools are A-rated — typically a magnet for longer-tenancy family renters. What's the average tenant stay here, and is there a school-zone premium baked into asking?
- What's the average days-on-market for RENTAL listings here right now (not sales)? A rising rental-DOM trend means longer vacancies and softer asking-rent achievability than the comps imply.
- What's the recent tenant-quality profile in this submarket — average credit score on applications, eviction rate, late-payment / NSF rate, and stable-employment percentage? A property-management company in the area should have these aggregated.
- How much new for-sale + rental construction is in the pipeline within 1–3 miles? Heavy new supply typically softens prices + rents 12–24 months out; constrained supply supports both.
Investment metrics
- 1% rule
- 1.47% ✓
- Cap rate
- 11.91%
- Cash-on-cash
- 20.07%
- DSCR
- 1.89
- GRM
- 5.7
CMA / ARV
No comps found within radius.
Projected returns pro-forma
5.93% appreciation · 3.0% rent growth · sell at horizon
- IRR
- 32.1%
- Equity multiple
- 3.08×
- Total profit
- $43,704
- Equity at exit
- $46,796
- IRR
- 29.9%
- Equity multiple
- 6.29×
- Total profit
- $111,162
- Equity at exit
- $84,559
Cash invested: $21,000 (down + closing). Projections, not guarantees.
Landlord ↔ Tenant lean methodology
- Overall (STATE)
- 73 Landlord-Friendly
- State Ohio
- 73 Landlord-Friendly · R+6
- County
- — inherits STATE
- City
- — inherits STATE
ZIP-level market 44841
- Home prices YoY
- 2.9%
- Active inventory
- 2
- Price-to-rent
- 5.7×
Monthly cashflow live
- Estimated rent
- $1,101 medium interval (Pro) →
- Mortgage (P&I)
- −$393
- Tax est. 1.5%
- −$94 /mo · $1,125/yr
- Insurance
- −$31
- HOA
- −$0
- Vacancy / Maint / Mgmt
- −$231
- Net cashflow
- $351
Break-even live
UW: 25.0% down · 7.5% · 30yr · 1.5% tax · 5.0% vac · 8.0% maint · 8.0% mgmt
Financing live
Cash to close
- Down payment
- $18,750
- Closing costs
- $2,250
- Reserves months
- —
- Total cash needed
- —
Loan-product check · same deal, 3 products live
Conventional
25% down · 7.5% · 30yr
- Down + closing
- —
- Monthly P&I
- —
- Monthly cashflow
- —
- DSCR
- —
- Eligible?
- —
Personal DTI + credit; lowest rate.
DSCR
20% down · 8.5% · 30yr
- Down + closing
- —
- Monthly P&I
- —
- Monthly cashflow
- —
- DSCR
- —
- Eligible?
- —
No personal income docs; deal must DSCR.
Hard money
10% down · 12.0% · 12mo
- Down + closing
- —
- Monthly P&I
- —
- Monthly cashflow
- —
- DSCR
- —
- Eligible?
- —
Short-term bridge; refi at stabilization.
Listing history 17 events
-
2026-06-19days on market $75,000 Active 152 DOM
-
2026-06-18days on market $75,000 Active 151 DOM
-
2026-06-17days on market $75,000 Active 150 DOM
-
2026-06-16days on market $75,000 Active 149 DOM
-
2026-06-15days on market $75,000 Active 148 DOM
-
2026-06-14days on market $75,000 Active 146 DOM
-
2026-06-12pricedays on market $75,000 Active 145 DOM
-
2026-06-09days on market $85,000 Active 142 DOM
-
2026-06-08days on market $85,000 Active 141 DOM
-
2026-06-07days on market $85,000 Active 140 DOM
-
2026-06-05days on market $85,000 Active 138 DOM
-
2026-06-02days on market $85,000 Active 135 DOM
-
2026-06-01days on market $85,000 Active 134 DOM
-
2026-05-31days on market $85,000 Active 133 DOM
-
2026-05-30days on market $85,000 Active 132 DOM
-
2026-02-19price $85,000
-
2026-01-19$91,200 Active
ⓘ Source: listings_history table (triggers on properties + properties_extension) + one-shot
backfill from property_details.listing_events for pre-trigger history.
Nearby sold comps map
Loading sold comps map…
Walkable amenities ~0.75 mi
Loading nearby amenities…
Taxation est. · year 1
- Rental income
- $13,207
- − Mortgage interest
- −$4,201
- − Property taxes
- −$1,125
- − Insurance
- −$375
- − Repairs & maintenance
- −$1,057
- − Management
- −$1,057
- − Depreciation
- −$2,182
- Taxable income
- $3,211
- Est. tax owed @ 24.0%
- −$771
- After-tax cash flow
- $3,443/yr
For passive investors: Depreciation is non-cash, so a rental often shows a tax loss while cash-flowing — sheltering income. Rental losses are passive: they offset passive income freely, and up to $25,000/yr can offset ordinary (W-2) income if you actively participate and your MAGI is under $100k (phasing out to $0 by $150k); unused losses carry forward. On sale, claimed depreciation is recaptured at up to 25%, and gains may owe capital-gains tax (a 1031 exchange can defer both). Figures are a year-1 estimate at your 24.0% rate — not tax advice; consult a CPA.
Schools (NCES district)
- District
- Lakota Local
- NCES district ID
- 3904956
- Math proficiency
- 60% ▼ -6.00%
- Reading proficiency
- 66% ▲ 3.00%
- Median HH income
- $54,243
- Composite
- 53.95/100
- National rank
- #1400
- State rank
- #236 of 656 in OH
Livability — Kansas
- Score
- 65/100
- State rank
- #748
- US rank
- #13520
Category grades
Schools grade is shown separately in the Schools card above.
Census & demographics
- Census place
- Kansas, OH
- County
- Seneca · 70,739 people
- Population (ZIP)
- 590
- Household income
- $71,250
- Rent vs Own
Population outlook (Seneca County) Hauer SSP2
- Today (2025)
- 54,243 people
- By 2030
- 52,947 · -2.4%
- By 2040
- 49,842 · -8.1%
- By 2050
- 46,689 · -13.9%
- By 2075
- 39,889 · -26.5%
- By 2100
- 32,155 · -40.7%
Race, ethnicity, and origin ACS 2023
- Neighborhood character
- Predominantly White (95%)
- Race & ethnicity
- White 95% Two or more races 4% Hispanic / Latino 2%
- Common ancestry
- Lithuanian 2% Serbian 1% Iranian 1%
Political lean MEDSL · Seneca
- 2024 margin
- Solid R (+37.5) · D 30.7% · R 68.2% · Other 1.0%
- 2008→2024 swing
- -34.8pp toward R · 2008: -2.7pp · 2024: -37.5pp
- All cycles
- 2024: R+37.5 2020: R+34.2 2016: R+31.2 2012: R+8.4 2008: R+2.7
Not yet ingested
- Civics
- —
Market trends
- HPI YoY
- ▲ 5.93%
- Current HPI
- 208.8791
- Rent YoY
- —
- Metro
- —
- State GDP YoY
- ▲ 1.98%
- F500 in state
- 48
Industry mix (Fortune 500 HQ in OH)
| Industry | F500 HQs | Revenue |
|---|---|---|
| Insurance | 3 | $145B |
|
||
| Industrial Machinery | 3 | $49B |
|
||
| Financial Services | 3 | $24B |
|
||
| Consumer Goods | 2 | $93B |
|
||
| Aerospace / Defense | 2 | $47B |
|
||
| Utilities | 2 | $33B |
|
||
Price history
-6.8% since first listed2 events — show timeline
- 2026-02-19 Price Changed $85,000 FAOR
- 2026-01-19 Listed $91,200 FAOR
Cash-flow waterfall
monthlySold comps — $/sqft
last 12 mo · ≤1 miLoading sold comps…