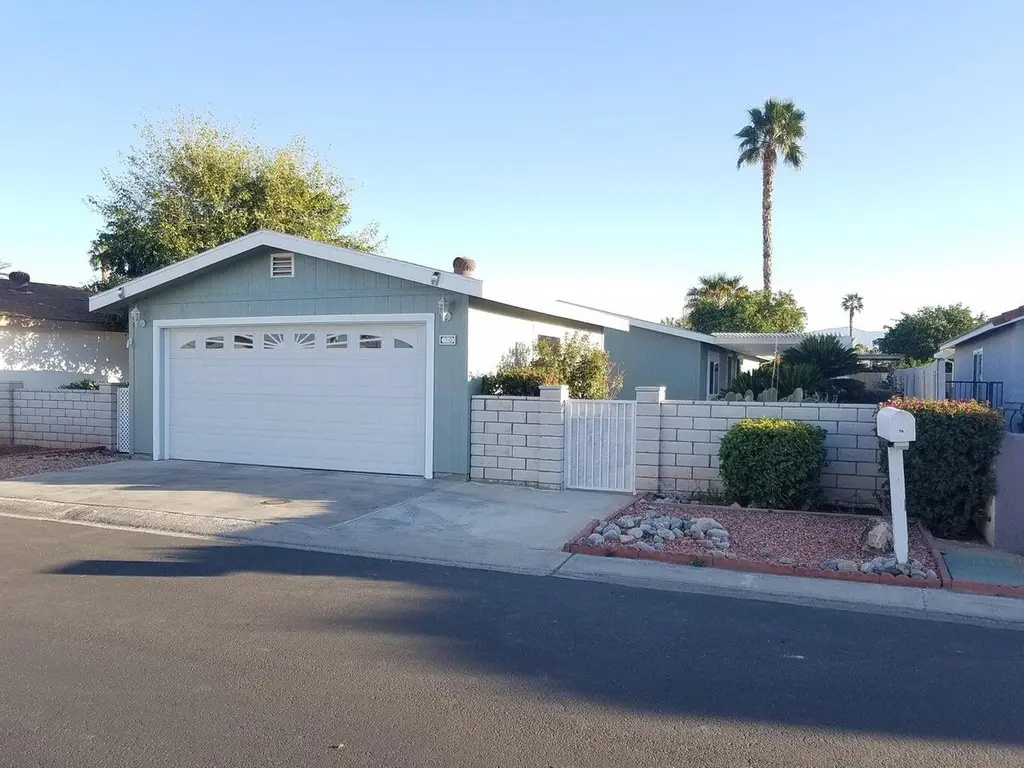
81641 Avenue 48 #70 · Indio, CA
Flood risk 1/10 · Minimal
- FEMA flood zone
- X (unshaded)
- Chance of flooding over 30 yrs
- 0.0%
- Est. flood insurance / yr
- $507 – $1,088
Fire risk 3/10 · Minor
- Est. fire insurance / yr
- $659 – $1,223
Heat risk 10/10 · Severe
- Hot days now (above 114°F)
- 7 days/yr
- Hot days in 30 yrs
- 19 days/yr
Wind risk 1/10 · Minimal
- Chance of severe wind over 30 yrs
- —
Air-quality risk 3/10 · Minor
- Unhealthy air days now
- 3 days/yr
- Unhealthy air days in 30 yrs
- 5 days/yr
Risk factors via First Street. Map © Google.
Why this score? — see what drove the D grade
The composite is a weighted blend of 9 inputs, each scored 0–100. Each bar is that input's sub-score; the figure is the points it added to the 100-point composite (weight × sub-score).
- ARV discount +12.3/15.0
- Cash flow +12.0/30.0
- 1% rule +4.2/10.0
- DSCR +3.5/10.0
- Rent growth +3.3/5.0
- Livability +2.7/5.0
- Condition / age +2.5/5.0
- Schools +1.5/10.0
- Appreciation +0.0/10.0
$290,000
🖨 Deal sheet 📄 Offer letter ✓ Due diligence
Listing remarks
Charming 3BD, 2BA in Desert Grove 55+ Community. Built in 1989, you own the land with low HOA at only $265 per month. Nestled in one of the most desirable neighborhoods, this beautifully maintained 3-bedroom, 2-bathroom home offers the perfect blend of comfort, convenience, and community living. Designed for ease and enjoyment, this property boasts a spacious, open floor plan filled with natural light. Welcome home to your detached 2 car garage, huge back & side yards with low maintenance landscaping and custom masonry, Alumiwood patio cover off main living area, wood laminate flooring, granite counters, and split floor-plan. A perfect home or rental in a prime location. Unit 70 is mo
Key facts
- 4,792 sq ft lot
- 2 garage spots
- Pool
Property features AI
Finance
- Other: Included in sale: appliances; Listing accepts Conventional, VA, FHA, Cash; will accept Contract and Submit; Possession at close of escrow; No short-term rentals; will not consider lease; CC&R disclosures
- HOA & community: Monthly HOA fee of $265; Community amenities include billiard room, tennis courts, and other courts; Senior community
Exterior
- Parking: Detached 2-car garage; 2 total parking spaces (unassigned spaces available)
- Security: Gated community; Community security features
- Utilities: Sewer service paid in street; PUD: No
- Home design: Single family residence, detached; One story
- Construction: Assessor-sourced year built; Detached construction
- Exterior features: Community pool with in-ground spa and safety gate; Gated community; Fee simple land
Interior
- Kitchen: Appliances included
- Flooring: Laminate flooring
- Bathrooms: 2 full bathrooms
- Heating & cooling: Central heating; Air conditioning
- Interior features: Unfurnished; Living Room
Neighborhood map
What this means for you Summary
Snapshot
- This is a 3-bed/2.0-bath manufactured listed at $290k.
Deal economics
- At list price, monthly cash flow is $-69 ($-824/yr) — negative.
- To cash-flow at today's rent, offer at most $278k (4.2% below list).
- To meet the 1% rule (rent ≥ 1% of price), the offer needs to be $266k (8.2% below list).
- Recommended offer: $266k (8.2% below list) — sets the bar for 1% rule.
- Cap rate 6.0% vs local median 4.3% in Indio — top-decile yield for the area; either an underpriced asset or a hidden risk that comps aren't pricing in. Stress-test before assuming the spread holds.
Location & tenants
- Location reads 53/100 on livability (#927 in CA) — a working-class tenant base; expect higher turnover. Strengths: housing B+; Watch: employment D, schools F, crime F.
- Coachella Valley Unified (rural): math 12% / reading 23% proficiency, ranked #481 of 517 in CA (top 93%) — low school quality limits family demand, transient renter base, plan for 1-2y turnover; 79% free/reduced lunch — lower-income household profile, screen leases tightly.
- Market conditions: Rents rising (+3.3%/yr); 514 active listings in the ZIP; 32 comparable units currently listed for rent nearby; rentals lingering (median 44d on market — plan ~5-8 weeks vacancy on turnover, expect pricing pressure); 56% of comp listings sitting > 30 days — soft ceiling on asking rent; 9,195 units permitted in Riverside County in 2024 (1,512 in 5+ unit buildings).
- At $2,662/mo this rent would consume 48% of the median local household income ($67k/yr) (locally 2036% of renters already pay >50% of income on rent) — very limited rent-growth headroom before tenants either downsize or default.
Forward outlook
- Local home prices are declining (-3.0%/yr); year-one equity from $2k of loan paydown is wiped out by about $9k of value loss. Plan a longer hold.
- Riverside County population projected at +22% by 2050 — long-run rental-demand tailwind backs the buy-and-hold thesis.
Negotiation context
- It's been on market 49 days — a 3% lower offer ($281k) is reasonable based on typical stale-listing flexibility.
- 24 sale attempts since 23y ago with the ask held roughly flat each time — persistent listings suggest the price (not the market) is what's stuck; bring a comps-based counter.
- Current owner paid $180k; list at $290k implies a 61% gain — meaningful room to come down on a strong offer.
Risks & watch-outs
- Climate carrying-cost: extreme-heat days projected 7→19/yr by 2055 (HVAC capex compounding) — expect insurance premiums to compound above CPI over the hold.
Questions for the listing agent
- What do current leases actually rent for vs. the listed asking? Can we see a recent rent roll and the last 12 months of T-12 income?
- It's been on market 49 days. Have you received any prior offers? Is the seller open to a 8% concession, seller financing, or rate buy-down credit?
- What does the HOA fee cover, when was the last increase, and are there any pending special assessments or reserve-fund shortfalls?
- Is there a deadline driving the sale (1031 exchange, divorce, estate, relocation)? That informs how much negotiation room exists.
- Schools are F-rated, which usually means shorter tenancies and higher turnover. Who's the typical renter profile here, and what's been the actual vacancy rate?
- Crime grade is F in this area — have there been break-ins, vandalism, or insurance claims at this property in the last 3 years? What carrier currently insures it and at what premium?
- The area grade is low — what's the realistic commute time and amenity access for the typical tenant pool here? Any planned neighborhood developments (good or bad) we should know about?
- What's the average days-on-market for RENTAL listings here right now (not sales)? A rising rental-DOM trend means longer vacancies and softer asking-rent achievability than the comps imply.
- What's the recent tenant-quality profile in this submarket — average credit score on applications, eviction rate, late-payment / NSF rate, and stable-employment percentage? A property-management company in the area should have these aggregated.
- How much new for-sale + rental construction is in the pipeline within 1–3 miles? Heavy new supply typically softens prices + rents 12–24 months out; constrained supply supports both.
Investment metrics
- 1% rule
- 0.92% ✗
- Cap rate
- 6.01%
- Cash-on-cash
- -1.01%
- DSCR
- 0.95
- GRM
- 9.1
CMA / ARV
- ARV (median comp)
- $324,669
- List price
- $290,000
- Delta
- -10.68%
- Verdict
- UNDERPRICED
- Comps
- 20 within 1.0 mi
Show comp detail 6 sales within ~0.75 mi
| Address | Dist | Beds/Ba | Sqft | Sold | Price | $/sf | Match |
|---|---|---|---|---|---|---|---|
| 81641 Avenue 48 St #76 | 0.07mi | 2/2.0 (-1) | 1,152 (0%) | 12mo | $225,000 | $195 | 81 |
| 81641 Avenue 48 #63 | 0.06mi | 3/2.0 | 1,210 (+5%) | 13mo | $310,000 | $256 | 78 |
| 47894 Los Amigos Ct | 0.22mi | 3/2.0 | 1,152 (0%) | 15mo | $295,000 | $256 | 78 |
| 81641 Avenue 48 #13 | 0.12mi | 2/2.0 (-1) | 1,248 (+8%) | 9mo | $335,000 | $268 | 68 |
| 47821 Calle Fiesta | 0.22mi | 3/2.0 | 1,248 (+8%) | 22mo | $285,000 | $228 | 58 |
| 81753 El Toro Ct | 0.25mi | 2/2.0 (-1) | 1,248 (+8%) | 22mo | $190,000 | $152 | 51 |
Match score weights: distance 35% · size 25% · config 20% · recency 20%. Top-matched comps best support the ARV.
Projected returns pro-forma
-3.0% appreciation · 3.34% rent growth · sell at horizon
- IRR
- -17.5%
- Equity multiple
- 0.38×
- Total profit
- $-50,310
- Equity at exit
- $43,240
- IRR
- -8.8%
- Equity multiple
- 0.44×
- Total profit
- $-45,084
- Equity at exit
- $25,074
Cash invested: $81,200 (down + closing). Projections, not guarantees.
Landlord ↔ Tenant lean methodology
- Overall (STATE)
- 18 Strongly Tenant-Friendly
- State California
- 18 Strongly Tenant-Friendly · D+13
- County
- — inherits STATE
- City
- — inherits STATE
ZIP-level market 92201
- Home prices YoY
- -28.4%
- Rents YoY
- 3.3%
- Active inventory
- 514
- Price-to-rent
- 9.1×
Monthly cashflow live
- Estimated rent
- $2,662 high interval (Pro) →
- Mortgage (P&I)
- −$1,521
- Tax from tax record
- −$265 /mo · $3,181/yr
- Insurance
- −$121
- HOA
- −$265
- Vacancy / Maint / Mgmt
- −$559
- Net cashflow
- $-69
Break-even live
UW: 25.0% down · 7.5% · 30yr · 1.5% tax · 5.0% vac · 8.0% maint · 8.0% mgmt
Financing live
Cash to close
- Down payment
- $72,500
- Closing costs
- $8,700
- Reserves months
- —
- Total cash needed
- —
Loan-product check · same deal, 3 products live
Conventional
25% down · 7.5% · 30yr
- Down + closing
- —
- Monthly P&I
- —
- Monthly cashflow
- —
- DSCR
- —
- Eligible?
- —
Personal DTI + credit; lowest rate.
DSCR
20% down · 8.5% · 30yr
- Down + closing
- —
- Monthly P&I
- —
- Monthly cashflow
- —
- DSCR
- —
- Eligible?
- —
No personal income docs; deal must DSCR.
Hard money
10% down · 12.0% · 12mo
- Down + closing
- —
- Monthly P&I
- —
- Monthly cashflow
- —
- DSCR
- —
- Eligible?
- —
Short-term bridge; refi at stabilization.
Rent comps 32 comps
| Address | Beds | Baths | Sqft | Rent | $/sqft | DOM | Units | Dist |
|---|---|---|---|---|---|---|---|---|
| 81641 Avenue 48 Indio, CA | 2.0 | 2.0 | 1440 | $2,500 | $1.74 | 43d | 1 | 0.05mi |
| 81777 Avenue 48 Indio, CA | 1.0–2.0 | 1.0 | 820 | $1,950 | $2.38 | 2d | 5 | 0.25mi |
| 81875 Avenue 48 Indio, CA | 1.0–2.0 | 1.0–2.0 | 804 | $2,185 | $2.72 | 10d | 6 | 0.34mi |
| 48255 Monroe St #20 Indio, CA | 2.0 | 2.0 | 998 | $2,200 | $2.20 | 24d | 1 | 0.40mi |
| 48255 Monroe St Indio, CA | 1.0–2.0 | 2.0 | 932 | $2,200 | $2.36 | 43d | 2 | 0.44mi |
| 47395 Monroe St #286 Indio, CA | 2.0 | 2.0 | 1021 | $2,300 | $2.25 | 24d | 1 | 0.57mi |
| 47395 Monroe St #264 Indio, CA | 3.0 | 2.0 | 1257 | $3,200 | $2.55 | 43d | 1 | 0.57mi |
| 47800 Madison St Indio, CA | 3.0 | 2.0 | 1456 | $2,850 | $1.96 | 43d | 1 | 0.59mi |
| 82242 Odlum Dr Indio, CA | 2.0 | 2.0 | 1402 | $3,000 | $2.14 | 43d | 1 | 0.67mi |
| 82191 Ullman Rd Indio, CA | 2.0 | 2.0 | 1446 | $2,250 | $1.56 | 17d | 1 | 0.72mi |
| 48939 Eisenhower Dr Indio, CA | 2.0 | 1.0 | 957 | $2,350 | $2.46 | 2d | 1 | 0.72mi |
| 82186 Bergman Dr Indio, CA | 2.0 | 2.0 | 1140 | $2,500 | $2.19 | 43d | 1 | 0.75mi |
| 82294 Bergman Dr Indio, CA | 2.0 | 2.0 | 982 | $3,200 | $3.26 | 43d | 1 | 0.79mi |
| 49181 Eisenhower Dr Indio, CA | 3.0 | 2.0 | 1368 | $4,250 | $3.11 | 43d | 1 | 0.81mi |
| 46675 Desert Villa St Indio, CA | 2.0 | 1.0–1.5 | 881 | $1,590 | $1.80 | 43d | 1 | 0.82mi |
| 49225 Eisenhower Dr Indio, CA | 2.0 | 2.0 | 1168 | $2,800 | $2.40 | 43d | 1 | 0.83mi |
| 82165 Doctor Carreon Blvd Indio, CA | 1.0–2.0 | 1.0–2.0 | 828 | $2,150 | $2.60 | 3d | 11 | 0.83mi |
| 82297 Cochran Dr Indio, CA | 2.0 | 2.0 | 982 | $3,200 | $3.26 | 43d | 1 | 0.90mi |
| 46745 Monroe St Indio, CA | 1.0–2.0 | 1.0–2.0 | 880 | $2,070 | $2.35 | 1d | 11 | 0.93mi |
| 80886 Avenue 50 Unit 1 Indio, CA | 2.0 | 2.0 | 1392 | $5,000 | $3.59 | 14d | 1 | 1.02mi |
| 80886 Avenue 50 Unit 2 Indio, CA | 2.0 | 1.0 | 729 | $4,000 | $5.49 | 14d | 1 | 1.02mi |
| 82377 Rebecca Dr Indio, CA | 3.0 | 2.0 | 952 | $2,400 | $2.52 | 43d | 1 | 1.02mi |
| 80870 California 111 Unit 223 Indio, CA | 2.0 | 2.0 | 1400 | $1,550 | $1.11 | 43d | 1 | 1.10mi |
| 82451 John Nobles Ave Unit 19 Indio, CA | 3.0 | 1.5 | 900 | $1,795 | $1.99 | 43d | 1 | 1.28mi |
| 81720 Avenue Indio, CA | 2.0 | 2.0 | 1080 | $1,795 | $1.66 | 43d | 1 | 1.31mi |
| 81840 Avenida del Mar Unit A203 Indio, CA | 2.0 | 2.0 | 874 | $1,750 | $2.00 | 24d | 1 | 1.32mi |
| 81683 De Plata Ave Indio, CA | 3.0 | 2.0 | 1216 | $3,100 | $2.55 | 18d | 1 | 1.32mi |
| 48380 Garbo Dr Indio, CA | 2.0 | 1.0 | 704 | $1,850 | $2.63 | 24d | 1 | 1.36mi |
| 81272 Palmwood Dr Indio, CA | 3.0 | 2.0 | 1104 | $3,200 | $2.90 | 43d | 1 | 1.38mi |
| 45546 Aladdin St Unit D201 Indio, CA | 2.0 | 1.0 | 907 | $1,549 | $1.71 | 43d | 1 | 1.41mi |
| 49058 Wayne St Indio, CA | 2.0 | 2.0 | 1156 | $4,000 | $3.46 | 43d | 1 | 1.42mi |
| 49058 Wayne St Indio, CA | 2.0 | 2.0 | 1156 | $4,000 | $3.46 | 5d | 1 | 1.42mi |
HOA detail
- Monthly dues
- $265 · $3,180/yr
- Likely covers
- landscaping
Listing history 50 events
-
2026-06-18days on market $290,000 Active 49 DOM
-
2026-06-17days on market $290,000 Active 48 DOM
-
2026-06-16days on market $290,000 Active 47 DOM
-
2026-06-15days on market $290,000 Active 46 DOM
-
2026-06-13days on market $290,000 Active 44 DOM
-
2026-06-13days on market $290,000 Active 43 DOM
-
2026-06-09days on market $290,000 Active 40 DOM
-
2026-06-08days on market $290,000 Active 39 DOM
-
2026-06-07days on market $290,000 Active 38 DOM
-
2026-06-04days on market $290,000 Active 35 DOM
-
2026-06-03days on market $290,000 Active 34 DOM
-
2026-06-02days on market $290,000 Active 33 DOM
-
2026-06-01days on market $290,000 Active 32 DOM
-
2026-05-31days on market $290,000 Active 31 DOM
-
2026-04-30$290,000 Active 1067-char remark
-
2025-03-31historical
-
2025-02-26price $296,000
-
2025-01-30$299,000 Active
-
2024-03-11historical
-
2024-02-09price $299,000
-
2023-11-17$315,000 Active
-
2021-11-01historical
-
2021-10-25status Active
-
2021-10-16status Active
-
2021-10-13status Active
-
2021-10-05status Active
-
2021-09-24status Pending
-
2021-09-10status Active
-
2021-09-02status Pending
-
2021-08-18$240,000 Active
-
2021-02-01soldstatus $180,000 Closed
-
2021-01-29soldstatus $180,000
-
2020-12-28status Pending
-
2020-12-23$187,900 Active
-
2020-04-07historical
-
2020-04-06soldstatus $145,450 Closed
-
2020-03-28status Pending
-
2020-03-28status Active
-
2020-03-14historical Active Under Contract
-
2020-02-24$149,900 Active
-
2020-02-18historical Hold
-
2020-01-27historical Active Under Contract
-
2019-12-11historical
-
2019-12-01price $159,900
-
2019-11-02status Active
-
2019-10-31historical Hold
-
2019-10-28$159,900 Active
-
2019-10-28$163,000 Active
-
2016-11-15soldstatus $119,900 Closed
-
2016-11-15soldstatus $119,900 Closed
ⓘ Source: listings_history table (triggers on properties + properties_extension) + one-shot
backfill from property_details.listing_events for pre-trigger history.
Tax reassessment forecast CA · Resets to sale price
- Current annual tax
- $3,181 · $265/mo
- Projected year-2 tax
- $3,181 · $265/mo
- Expected delta
- $0/yr ($0/mo · 0.0%)
ⓘ Screening estimate from a state-policy table — verify with the county assessor before closing.
Climate risk First Street
- Flood 1/10 Low FEMA zone X (unshaded) · 0% chance over 30 yrs
- Wildfire 3/10 Moderate
- Heat 10/10 Extreme 7 d/yr ≥114°F today · 19 d/yr by 30 yrs out
- Wind 1/10 Low
- Air quality 3/10 Moderate 3 unhealthy d/yr today · 5 by 30 yrs out
Nearby sold comps map
Loading sold comps map…
Walkable amenities ~0.75 mi
Loading nearby amenities…
Taxation est. · year 1
- Rental income
- $31,945
- − Mortgage interest
- −$16,245
- − Property taxes
- −$3,181
- − Insurance
- −$1,450
- − Repairs & maintenance
- −$2,556
- − Management
- −$2,556
- − HOA
- −$3,180
- − Depreciation
- −$8,436
- Taxable loss
- −$5,658
- Est. tax savings @ 24.0%
- +$1,358
- After-tax cash flow
- $534/yr
For passive investors: Depreciation is non-cash, so a rental often shows a tax loss while cash-flowing — sheltering income. Rental losses are passive: they offset passive income freely, and up to $25,000/yr can offset ordinary (W-2) income if you actively participate and your MAGI is under $100k (phasing out to $0 by $150k); unused losses carry forward. On sale, claimed depreciation is recaptured at up to 25%, and gains may owe capital-gains tax (a 1031 exchange can defer both). Figures are a year-1 estimate at your 24.0% rate — not tax advice; consult a CPA.
Schools (NCES district)
- District
- Coachella Valley Unified
- NCES district ID
- 0609070
- Math proficiency
- 12% ▼ -8.00%
- Reading proficiency
- 23% ▼ -6.00%
- Median HH income
- $37,683
- Composite
- 14.62/100
- National rank
- #9408
- State rank
- #481 of 517 in CA
Livability — Indio
- Score
- 53/100
- State rank
- #927
- US rank
- #24244
Category grades
Schools grade is shown separately in the Schools card above.
Census & demographics
- Census place
- Indio, CA
- County
- Riverside County · 2,287,001 people
- City population
- 100,560
- Metro
- Riverside-San Bernardino-Ontario, CA
- Population (ZIP)
- 65,825
- Household income
- $66,758
- Rent vs Own
- Severe rent burden
- 2036.0
Population outlook (Riverside County) Hauer SSP2
- Today (2025)
- 2,664,475 people
- By 2030
- 2,802,692 · +5.2%
- By 2040
- 3,050,904 · +14.5%
- By 2050
- 3,256,783 · +22.2%
- By 2075
- 3,655,058 · +37.2%
- By 2100
- 3,766,594 · +41.4%
Race, ethnicity, and origin ACS 2023
- Neighborhood character
- Predominantly Hispanic (74%)
- Race & ethnicity
- Hispanic / Latino 74% Two or more races 39% White 19% Black 3% Asian 3% Native American 1%
- Hispanic origin (detail)
- Mexican 69%
- Common ancestry
- Romanian 1% Iranian 1%
- Foreign-born
- 29% · Canada, Vietnam, Jamaica
- Languages at home
- 41% English-only · Spanish 55% Arabic 1% Tagalog/Filipino 1%
Political lean MEDSL · Riverside
- 2024 margin
- Toss-up / Even · D 48.0% · R 49.3% · Other 2.6%
- 2008→2024 swing
- -3.6pp toward R · 2008: 2.3pp · 2024: -1.3pp
- All cycles
- 2024: R+1.3 2020: D+8.0 2016: D+4.3 2012: R+0.4 2008: D+2.3
Not yet ingested
- Civics
- —
Market trends
- HPI YoY
- ▼ -138.46%
- Current HPI
- 348.6605
- Rent YoY
- ▲ 3.34%
- Metro
- Riverside-San Bernardino-Ontario, CA
- State GDP YoY
- ▲ 3.21%
- F500 in state
- 116
Industry mix (Fortune 500 HQ in CA)
| Industry | F500 HQs | Revenue |
|---|---|---|
| Technology | 27 | $1,492B |
|
||
| Financial Services | 3 | $174B |
|
||
| Retail | 3 | $44B |
|
||
| Insurance | 3 | $26B |
|
||
| Media / Entertainment | 2 | $115B |
|
||
| Pharmaceuticals / Biotech | 2 | $62B |
|
||
Price history
-43.2% since first listed65 events — show timeline
- 2026-04-30 Listed $290,000 GPSMLS
- 2025-03-31 Listing Removed — GPSMLS
- 2025-02-26 Price Changed $296,000 GPSMLS
- 2025-01-30 Listed $299,000 GPSMLS
- 2024-03-11 Listing Removed — GPSMLS
- 2024-02-09 Price Changed $299,000 GPSMLS
- 2023-11-17 Listed $315,000 GPSMLS
- 2021-11-01 Listing Removed — GPSMLS
- 2021-10-25 Relisted — GPSMLS
- 2021-10-16 Relisted — GPSMLS
- 2021-10-13 Relisted — GPSMLS
- 2021-10-05 Relisted — GPSMLS
- 2021-09-24 Pending — GPSMLS
- 2021-09-10 Relisted — GPSMLS
- 2021-09-02 Pending — GPSMLS
- 2021-08-18 Listed $240,000 GPSMLS
- 2021-02-01 Sold (MLS) $180,000 GPSMLS
- 2021-01-29 Sold (Public Records) $180,000 Public Records
- 2020-12-28 Pending — GPSMLS
- 2020-12-23 Listed $187,900 GPSMLS
- 2020-04-07 Listing Removed — GPSMLS
- 2020-04-06 Sold (MLS) $145,450 GPSMLS
- 2020-03-28 Pending — GPSMLS
- 2020-03-28 Relisted — GPSMLS
- 2020-03-14 Contingent — GPSMLS
- 2020-02-24 Listed $149,900 GPSMLS
- 2020-02-18 Delisted — GPSMLS
- 2020-01-27 Contingent — GPSMLS
- 2019-12-11 Listing Removed — GPSMLS
- 2019-12-01 Price Changed $159,900 GPSMLS
- 2019-11-02 Relisted — GPSMLS
- 2019-10-31 Delisted — GPSMLS
- 2019-10-28 Listed $163,000 GPSMLS
- 2019-10-28 Listed $159,900 GPSMLS
- 2016-11-15 Sold (Public Records) $120,000 Public Records
- 2016-11-15 Sold (MLS) $119,900 GPSMLS
- 2016-11-15 Sold (MLS) $119,900 GPSMLS
- 2016-10-29 Pending — GPSMLS
- 2016-10-14 Listed $119,900 GPSMLS
- 2016-06-22 Sold (MLS) $65,000 GPSMLS
- 2016-06-22 Sold (MLS) $65,000 GPSMLS
- 2016-06-21 Pending — GPSMLS
- 2016-06-01 Pending — GPSMLS
- 2016-04-24 Listed $79,900 GPSMLS
- 2009-07-17 Listing Removed — GPSMLS
- 2009-07-17 Sold (Public Records) $60,000 Public Records
- 2009-07-16 Contingent — GPSMLS
- 2009-07-07 Listed $74,000 GPSMLS
- 2006-11-22 Sold (Public Records) $45,000 Public Records
- 2006-11-08 Listing Removed — GPSMLS
- 2006-09-27 Listed $159,000 GPSMLS
- 2006-08-08 Listing Removed — GPSMLS
- 2006-04-07 Listed $179,900 GPSMLS
- 2006-03-09 Listing Removed — GPSMLS
- 2005-12-06 Listing Removed — GPSMLS
- 2005-11-21 Listing Removed — GPSMLS
- 2005-09-30 Listed $179,999 GPSMLS
- 2005-09-13 Listed $189,000 GPSMLS
- 2005-09-12 Listed $189,000 GPSMLS
- 2003-02-14 Sold (Public Records) $85,000 Public Records
- 2003-01-13 Listing Removed — GPSMLS
- 2003-01-05 Listed $89,000 GPSMLS
- 1988-09-30 Sold (Public Records) $455,000 Public Records
- 1987-09-25 Sold (Public Records) $791,000 Public Records
- 1986-08-15 Sold (Public Records) $511,000 Public Records
Property tax history
+2.4%/yrLatest (2025): $3,181 · +3.9% YoY. Source: county tax records.
Cash-flow waterfall
monthlySold comps — $/sqft
last 12 mo · ≤1 miLoading sold comps…