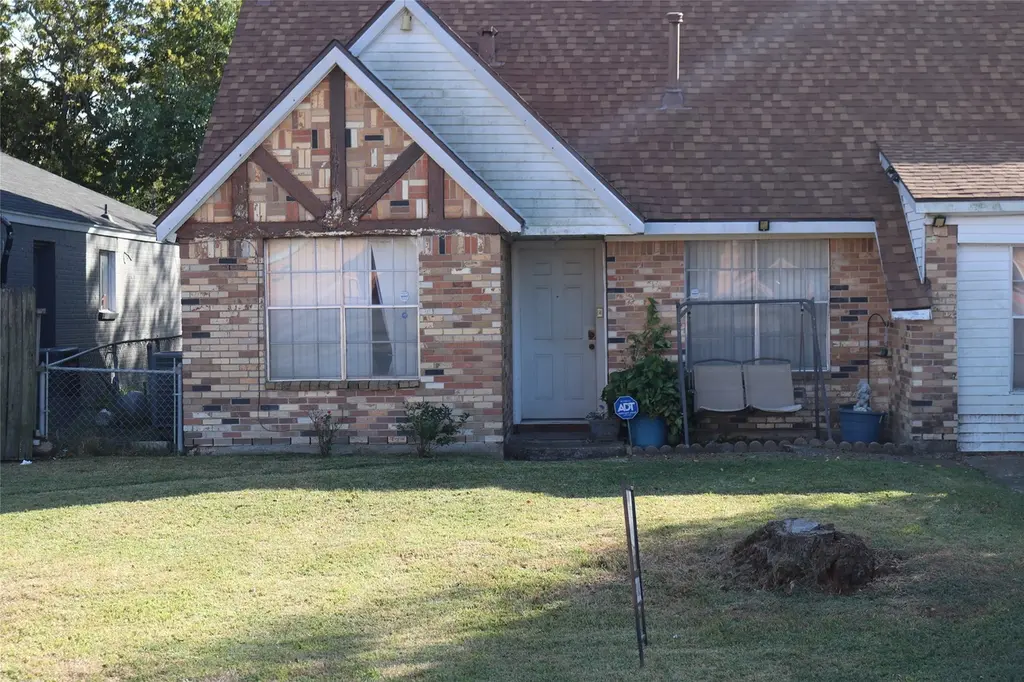
17002 Hall Shepperd Rd · Sheldon, TX
Flood risk No data
- FEMA flood zone
- —
- Chance of flooding over 30 yrs
- —
- Est. flood insurance / yr
- —
Fire risk No data
- Est. fire insurance / yr
- —
Heat risk No data
- Hot days now (above threshold)
- —
- Hot days in 30 yrs
- —
Wind risk No data
- Chance of severe wind over 30 yrs
- —
Air-quality risk No data
- Unhealthy air days now
- —
- Unhealthy air days in 30 yrs
- —
Risk factors via First Street. Map © Google.
Why this score? — see what drove the C- grade
The composite is a weighted blend of 9 inputs, each scored 0–100. Each bar is that input's sub-score; the figure is the points it added to the 100-point composite (weight × sub-score).
- ARV discount +15.0/15.0
- Cash flow +14.5/30.0
- DSCR +4.4/10.0
- Appreciation +4.4/10.0
- 1% rule +3.4/10.0
- Livability +3.3/5.0
- Condition / age +2.5/5.0
- Schools +2.0/10.0
- Rent growth +1.7/5.0
$240,000
🖨 Deal sheet 📄 Offer letter ✓ Due diligence
Listing remarks MLS
Primary Bedroom downstairs. Lifetime transferrable warranty on the foundation. 30-year roof installed in 2021. 4-bedroom home. The garage has been converted into a 5th bedroom and 1/2 bath. Across from Sheldon Elementary School!
Key facts
- 6,102 sq ft lot
- Built 1963
- Listed 212 days
Tags
Neighborhood map
What this means for you Summary
Snapshot
- This is a 4-bed/2.0-bath single-family listed at $240k.
Deal economics
- At list price, monthly cash flow is $51 ($615/yr) — positive.
- The deal already cash-flows at list — no discount required.
- To meet the 1% rule (rent ≥ 1% of price), the offer needs to be $201k (16.2% below list).
- Recommended offer: $201k (16.2% below list) — sets the bar for 1% rule.
- Cap rate 6.5% vs local median 4.2% in Sheldon — top-decile yield for the area; either an underpriced asset or a hidden risk that comps aren't pricing in. Stress-test before assuming the spread holds.
Location & tenants
- Location reads 66/100 on livability (#605 in TX) — a middle-class / working-renter tenant base. Strengths: cost of living A+, housing A+, crime B+; Watch: schools F, amenities F, commute F.
- Sheldon ISD (suburban): math 19% / reading 25% proficiency, ranked #746 of 826 in TX (top 90%) — low school quality limits family demand, transient renter base, plan for 1-2y turnover; 72% free/reduced lunch — lower-income household profile, screen leases tightly.
- Market conditions: Rents falling (-3.3%/yr); 157 active listings in the ZIP; 29,883 units permitted in Harris County in 2024 (8,621 in 5+ unit buildings).
- This rent runs 38% of the median local income ($63k/yr) — at the standard rent-burdened threshold; future hikes will face affordability resistance.
Forward outlook
- Local home prices are declining (-1.2%/yr); year-one equity from $2k of loan paydown is wiped out by about $3k of value loss. Plan a longer hold.
- Harris County population projected at +47% by 2050 — long-run rental-demand tailwind backs the buy-and-hold thesis.
Negotiation context
- It's been on market 213 days — a 12% lower offer ($211k) is reasonable based on typical stale-listing flexibility.
- 2 sale attempts since 16y ago with the ask held roughly flat each time — persistent listings suggest the price (not the market) is what's stuck; bring a comps-based counter.
Questions for the listing agent
- It's been on market 213 days. Have you received any prior offers? Is the seller open to a 16% concession, seller financing, or rate buy-down credit?
- Built in 1963 — when were the roof, HVAC, electrical panel, plumbing, and water heater last replaced?
- Why hasn't it sold? Are there any deal-killer items the seller is aware of (foundation, flood, title, zoning, code violations)?
- Is there a deadline driving the sale (1031 exchange, divorce, estate, relocation)? That informs how much negotiation room exists.
- Schools are F-rated, which usually means shorter tenancies and higher turnover. Who's the typical renter profile here, and what's been the actual vacancy rate?
- What's the average days-on-market for RENTAL listings here right now (not sales)? A rising rental-DOM trend means longer vacancies and softer asking-rent achievability than the comps imply.
- What's the recent tenant-quality profile in this submarket — average credit score on applications, eviction rate, late-payment / NSF rate, and stable-employment percentage? A property-management company in the area should have these aggregated.
- How much new for-sale + rental construction is in the pipeline within 1–3 miles? Heavy new supply typically softens prices + rents 12–24 months out; constrained supply supports both.
Investment metrics
- 1% rule
- 0.84% ✗
- Cap rate
- 6.55%
- Cash-on-cash
- 0.92%
- DSCR
- 1.04
- GRM
- 9.9
CMA / ARV
- ARV (median comp)
- $304,011
- List price
- $240,000
- Delta
- -21.06%
- Verdict
- UNDERPRICED
- Comps
- 20 within 1.0 mi
Show comp detail 4 sales within ~0.75 mi
| Address | Dist | Beds/Ba | Sqft | Sold | Price | $/sf | Match |
|---|---|---|---|---|---|---|---|
| 9110 Johns Rd | 0.20mi | 4/2.0 | 2,143 (-5%) | 16mo | $425,000 | $198 | 69 |
| 17107 Folsom Dr | 0.26mi | 4/2.0 | 2,174 (-4%) | 23mo | $250,000 | $115 | 63 |
| 17202 Woodburn Dr | 0.27mi | 4/2.0 | 1,945 (-14%) | 5mo | $119,500 | $61 | 60 |
| 16422 Sunshine St | 0.53mi | 4/3.5 | 1,944 (-14%) | 20mo | $750,000 | $386 | 30 |
Match score weights: distance 35% · size 25% · config 20% · recency 20%. Top-matched comps best support the ARV.
Projected returns pro-forma
-1.2% appreciation · 0.0% rent growth · sell at horizon
- IRR
- -8.2%
- Equity multiple
- 0.66×
- Total profit
- $-22,950
- Equity at exit
- $55,590
- IRR
- -3.9%
- Equity multiple
- 0.68×
- Total profit
- $-21,447
- Equity at exit
- $56,400
Cash invested: $67,200 (down + closing). Projections, not guarantees.
Landlord ↔ Tenant lean methodology
- Overall (STATE)
- 87 Strongly Landlord-Friendly
- State Texas
- 87 Strongly Landlord-Friendly · R+5
- County
- — inherits STATE
- City
- — inherits STATE
ZIP-level market 77049
- Home prices YoY
- -0.5%
- Rents YoY
- -3.3%
- Active inventory
- 157
- Price-to-rent
- 9.9×
Monthly cashflow live
- Estimated rent
- $2,012 medium interval (Pro) →
- Mortgage (P&I)
- −$1,259
- Tax from tax record
- −$180 /mo · $2,156/yr
- Insurance
- −$100
- HOA
- −$0
- Vacancy / Maint / Mgmt
- −$423
- Net cashflow
- $51
Break-even live
UW: 25.0% down · 7.5% · 30yr · 1.5% tax · 5.0% vac · 8.0% maint · 8.0% mgmt
Financing live
Cash to close
- Down payment
- $60,000
- Closing costs
- $7,200
- Reserves months
- —
- Total cash needed
- —
Loan-product check · same deal, 3 products live
Conventional
25% down · 7.5% · 30yr
- Down + closing
- —
- Monthly P&I
- —
- Monthly cashflow
- —
- DSCR
- —
- Eligible?
- —
Personal DTI + credit; lowest rate.
DSCR
20% down · 8.5% · 30yr
- Down + closing
- —
- Monthly P&I
- —
- Monthly cashflow
- —
- DSCR
- —
- Eligible?
- —
No personal income docs; deal must DSCR.
Hard money
10% down · 12.0% · 12mo
- Down + closing
- —
- Monthly P&I
- —
- Monthly cashflow
- —
- DSCR
- —
- Eligible?
- —
Short-term bridge; refi at stabilization.
Listing history 17 events
-
2026-06-18days on market $240,000 Active 213 DOM
-
2026-06-17days on market $240,000 Active 212 DOM
-
2026-06-16days on market $240,000 Active 211 DOM
-
2026-06-15days on market $240,000 Active 210 DOM
-
2026-06-13days on market $240,000 Active 208 DOM
-
2026-06-09days on market $240,000 Active 204 DOM
-
2026-06-08days on market $240,000 Active 203 DOM
-
2026-06-07days on market $240,000 Active 202 DOM
-
2026-06-04days on market $240,000 Active 199 DOM
-
2026-06-03days on market $240,000 Active 198 DOM
-
2026-06-02days on market $240,000 Active 197 DOM
-
2026-06-01days on market $240,000 Active 196 DOM
-
2026-05-31days on market $240,000 Active 195 DOM
-
2025-11-17$240,000 Active 230-char remark
Show marketing remark (230 chars)
Primary Bedroom downstairs. Lifetime transferrable warranty on the foundation. 30-year roof installed in 2021. 4-bedroom home. The garage has been converted into a 5th bedroom and 1/2 bath. Across from Sheldon Elementary School!
-
2010-10-30historical
-
2010-05-30$95,500
-
1990-09-16soldstatus
ⓘ Source: listings_history table (triggers on properties + properties_extension) + one-shot
backfill from property_details.listing_events for pre-trigger history.
Tax reassessment forecast TX · Resets to sale price
- Current annual tax
- $2,156 · $180/mo
- Projected year-2 tax
- $4,392 · $366/mo
- Expected delta
- +$2,236/yr (+$186/mo · 103.7%)
ⓘ Screening estimate from a state-policy table — verify with the county assessor before closing.
Nearby sold comps map
Loading sold comps map…
Walkable amenities ~0.75 mi
Loading nearby amenities…
Taxation est. · year 1
- Rental income
- $24,144
- − Mortgage interest
- −$13,444
- − Property taxes
- −$2,156
- − Insurance
- −$1,200
- − Repairs & maintenance
- −$1,932
- − Management
- −$1,932
- − Depreciation
- −$6,982
- Taxable loss
- −$3,500
- Est. tax savings @ 24.0%
- +$840
- After-tax cash flow
- $1,455/yr
For passive investors: Depreciation is non-cash, so a rental often shows a tax loss while cash-flowing — sheltering income. Rental losses are passive: they offset passive income freely, and up to $25,000/yr can offset ordinary (W-2) income if you actively participate and your MAGI is under $100k (phasing out to $0 by $150k); unused losses carry forward. On sale, claimed depreciation is recaptured at up to 25%, and gains may owe capital-gains tax (a 1031 exchange can defer both). Figures are a year-1 estimate at your 24.0% rate — not tax advice; consult a CPA.
Schools (NCES district)
- District
- Sheldon ISD
- NCES district ID
- 4839990
- Math proficiency
- 19% ▼ -18.00%
- Reading proficiency
- 25% ▼ -10.00%
- Median HH income
- $49,443
- Composite
- 19.5/100
- National rank
- #8772
- State rank
- #746 of 826 in TX
Livability — Sheldon
- Score
- 66/100
- State rank
- #605
- US rank
- #11469
Category grades
Schools grade is shown separately in the Schools card above.
Census & demographics
- Census place
- Sheldon, TX
- County
- Harris County · 4,702,590 people
- City population
- 3,226,434
- Metro
- Houston-The Woodlands-Sugar Land, TX
- Population (ZIP)
- 40,418
- Household income
- $62,971
- Rent vs Own
- Severe rent burden
- 993.0
Population outlook (Harris County) Hauer SSP2
- Today (2025)
- 5,571,493 people
- By 2030
- 6,089,821 · +9.3%
- By 2040
- 7,142,806 · +28.2%
- By 2050
- 8,185,864 · +46.9%
- By 2075
- 10,574,329 · +89.8%
- By 2100
- 12,109,958 · +117.4%
Race, ethnicity, and origin ACS 2023
- Neighborhood character
- Predominantly Hispanic (66%)
- Race & ethnicity
- Hispanic / Latino 66% Two or more races 32% Black 19% White 10% Asian 3%
- Hispanic origin (detail)
- Mexican 55%
- Common ancestry
- Lithuanian 1%
- Foreign-born
- 26% · Canada, China, Vietnam
- Languages at home
- 43% English-only · Spanish 54% Other Asian/Pacific 1% Chinese 1%
Political lean MEDSL · Harris
- 2024 margin
- Lean D (+5.5) · D 52.0% · R 46.4% · Other 1.6%
- 2008→2024 swing
- +3.9pp toward D · 2008: 1.6pp · 2024: 5.5pp
- All cycles
- 2024: D+5.5 2020: D+13.3 2016: D+12.4 2012: D+0.1 2008: D+1.6
Not yet ingested
- Civics
- —
Market trends
- HPI YoY
- ▼ -1.20%
- Current HPI
- 248.1111
- Rent YoY
- ▼ -3.31%
- Metro
- Houston-The Woodlands-Sugar Land, TX
- State GDP YoY
- ▲ 3.95%
- F500 in state
- 110
Industry mix (Fortune 500 HQ in TX)
| Industry | F500 HQs | Revenue |
|---|---|---|
| Energy | 16 | $1,198B |
|
||
| Technology | 5 | $198B |
|
||
| Engineering / Construction | 4 | $72B |
|
||
| Energy Services | 3 | $60B |
|
||
| Utilities | 3 | $41B |
|
||
| Healthcare | 2 | $330B |
|
||
Price history
+151.3% since first listed4 events — show timeline
- 2025-11-17 Listed $240,000 HARMLS
- 2010-10-30 Listing Removed — HARMLS
- 2010-05-30 Listed $95,500 HARMLS
- 1990-09-16 Sold (Public Records) — Public Records
Property tax history
+1.4%/yrLatest (2025): $2,156 · +9.4% YoY. Source: county tax records.
Cash-flow waterfall
monthlySold comps — $/sqft
last 12 mo · ≤1 miLoading sold comps…