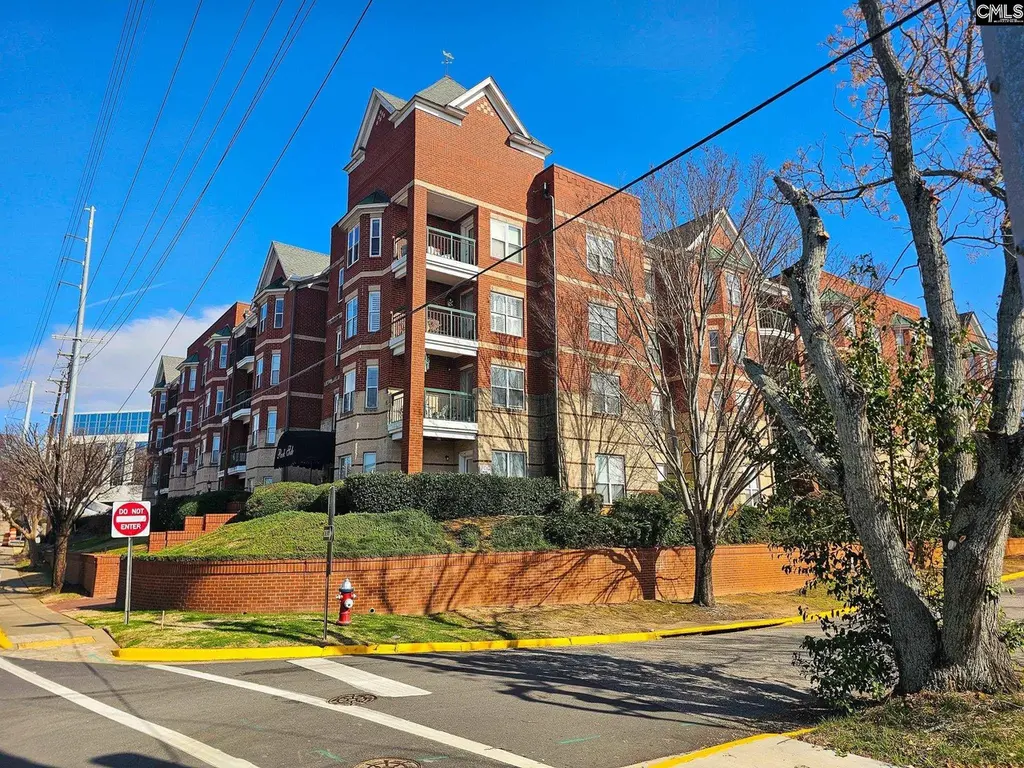
900 Taylor St #305 · Columbia, SC
Flood risk 1/10 · Minimal
- FEMA flood zone
- X (unshaded)
- Chance of flooding over 30 yrs
- 0.0%
- Est. flood insurance / yr
- $507 – $1,088
Fire risk 1/10 · Minimal
- Est. fire insurance / yr
- $783 – $1,453
Heat risk 7/10 · Major
- Hot days now (above 109°F)
- 7 days/yr
- Hot days in 30 yrs
- 16 days/yr
Wind risk 6/10 · Moderate
- Chance of severe wind over 30 yrs
- 67.0%
Air-quality risk 3/10 · Minor
- Unhealthy air days now
- 2 days/yr
- Unhealthy air days in 30 yrs
- 2 days/yr
Risk factors via First Street. Map © Google.
Why this score? — see what drove the F grade
The composite is a weighted blend of 9 inputs, each scored 0–100. Each bar is that input's sub-score; the figure is the points it added to the 100-point composite (weight × sub-score).
- ARV discount +7.5/15.0
- Cash flow +5.4/30.0
- Livability +3.9/5.0
- Rent growth +3.3/5.0
- 1% rule +2.7/10.0
- Schools +2.6/10.0
- Condition / age +2.5/5.0
- DSCR +0.0/10.0
- Appreciation +0.0/10.0
$245,000
🖨 Deal sheet 📄 Offer letter ✓ Due diligence
Listing remarks
This is an excellent opportunity for buyers seeking secure, convenient, and vibrant downtown living near USC. Park Side is a highly sought-after condominium community located in the Vista in downtown Columbia. The monthly dues are only $464/mo which are some of the most affordable rates in downtown Columbia for a condo, and it includes water, sewer, and trash in addition to the convenient gated parking lot with ample spaces and a bike rack and other onsite amenities, including a pool with grilling area, fitness center, community room, and multiple furnished common areas. In addition, it is adjacent to Finlay Park, which recently underwent a $25 million renovation and includes pickleball, di
Key facts
- On-site bike rack
- Direct views
- Updated condo
Tags
Property features AI
Finance
- HOA & community: Association present; Association includes pool
Exterior
- Security: Gated community
- Utilities: Public water; Public sewer
- Home design: 4-story building
- Construction: Slab foundation
- Exterior features: Brick exterior above foundation; Paved road access; Community pool; Gated community; Cable TV available
Interior
- Kitchen: Bar; Tile floor; Concrete countertops; Painted cabinets; Smooth surface range
- Bedrooms: Master bedroom on the main level with double vanity, private bath and walk-in closet; Second bedroom with shared bath
- Flooring: Hardwood; Laminate; Tile
- Bathrooms: Two full bathrooms
- Heating & cooling: Central heating; Central air conditioning
- Interior features: Balcony off the great room; Bay window in the great room; Hardwood floors in the great room; Tile flooring in the kitchen; Painted kitchen cabinets; Concrete countertops; Smooth surface range
Neighborhood map
What this means for you Summary
Snapshot
- This is a 2-bed/2.0-bath condo listed at $245k.
Deal economics
- At list price, monthly cash flow is $-534 ($-6k/yr) — negative.
- The deal already cash-flows at list — no discount required.
- To meet the 1% rule (rent ≥ 1% of price), the offer needs to be $188k (23.4% below list).
- Recommended offer: $188k (23.4% below list) — sets the bar for 1% rule.
- Cap rate 3.7% vs local median 5.0% in Columbia — below-typical yield; the buyer is paying a premium for something (appreciation thesis, condition, location) that the cap rate doesn't capture.
Location & tenants
- Location reads 78/100 on livability (#18 in SC, #2,436 nationally) — a middle-class / working-renter tenant base. Strengths: amenities A+, commute A+, cost of living A+; Watch: employment D, crime F.
- Richland 01 (urban): math 26% / reading 36% proficiency, ranked #54 of 80 in SC (top 68%) — families likely to look elsewhere, expect single-tenant / working-renter base with shorter leases; 64% free/reduced lunch — lower-income household profile, screen leases tightly.
- Zoned schools: H. B. Rhame Elementary (math 15% / reading 20%, grade F, #512 of 597 statewide, top 86%, 446 students, 100% FRL); Columbia High (math 17% / reading 67%, grade F, #174 of 196 statewide, top 90%, 665 students, 100% FRL) — zoned schools average 100% FRL vs 64% district-wide (36 pts higher); higher-poverty schools than district average — tighter screening recommended.
- Market conditions: Rents rising (+3.2%/yr); 114 active listings in the ZIP; 30 comparable units currently listed for rent nearby; rentals at typical pace (median 19d on market — plan ~3-4 weeks tenant-placement turnaround); lower-income renter base — watch delinquency; 3,472 units permitted in Richland County in 2024 (1,096 in 5+ unit buildings).
- At $1,876/mo this rent would consume 70% of the median local household income ($32k/yr) (locally 3456% of renters already pay >50% of income on rent) — very limited rent-growth headroom before tenants either downsize or default.
Forward outlook
- Local home prices are declining (-3.0%/yr); year-one equity from $2k of loan paydown is wiped out by about $7k of value loss. Plan a longer hold.
- Richland County population projected at +30% by 2050 — long-run rental-demand tailwind backs the buy-and-hold thesis.
Negotiation context
- It's been on market 38 days — a 3% lower offer ($238k) is reasonable based on typical stale-listing flexibility.
- 4 sale attempts since 7y ago with the ask held roughly flat each time — persistent listings suggest the price (not the market) is what's stuck; bring a comps-based counter.
- Current owner paid $128k; list at $245k implies a 92% gain — meaningful room to come down on a strong offer.
Risks & watch-outs
- Watch-outs: HOA is 29% of rent.
- Climate carrying-cost: major wind risk, 67% chance of damaging wind over 30y; extreme-heat days projected 7→16/yr by 2055 (HVAC capex compounding) — expect insurance premiums to compound above CPI over the hold.
Questions for the listing agent
- What do current leases actually rent for vs. the listed asking? Can we see a recent rent roll and the last 12 months of T-12 income?
- It's been on market 38 days. Have you received any prior offers? Is the seller open to a 23% concession, seller financing, or rate buy-down credit?
- What does the HOA fee cover, when was the last increase, and are there any pending special assessments or reserve-fund shortfalls?
- Any open or pending special assessments — roof, HVAC, plumbing, elevator, façade? What's the per-unit balance and payoff schedule, and is the seller paying it off at close or rolling it to the buyer?
- Is there a deadline driving the sale (1031 exchange, divorce, estate, relocation)? That informs how much negotiation room exists.
- Schools are D-rated, which usually means shorter tenancies and higher turnover. Who's the typical renter profile here, and what's been the actual vacancy rate?
- Crime grade is F in this area — have there been break-ins, vandalism, or insurance claims at this property in the last 3 years? What carrier currently insures it and at what premium?
- The area grade is low — what's the realistic commute time and amenity access for the typical tenant pool here? Any planned neighborhood developments (good or bad) we should know about?
- What's the average days-on-market for RENTAL listings here right now (not sales)? A rising rental-DOM trend means longer vacancies and softer asking-rent achievability than the comps imply.
- What's the recent tenant-quality profile in this submarket — average credit score on applications, eviction rate, late-payment / NSF rate, and stable-employment percentage? A property-management company in the area should have these aggregated.
- How much new apartment / multifamily construction is in the pipeline within 1–3 miles? Heavy new supply (>2% of stock underway) typically softens rents 12–24 months out; light construction supports rent growth.
Investment metrics
- 1% rule
- 0.77% ✗
- Cap rate
- 3.68%
- Cash-on-cash
- -9.34%
- DSCR
- 0.58
- GRM
- 10.9
CMA / ARV
No comps found within radius.
Projected returns pro-forma
-3.0% appreciation · 3.18% rent growth · sell at horizon
- IRR
- -32.5%
- Equity multiple
- -0.07×
- Total profit
- $-73,136
- Equity at exit
- $36,530
- IRR
- -36.3%
- Equity multiple
- -0.53×
- Total profit
- $-105,145
- Equity at exit
- $21,183
Cash invested: $68,600 (down + closing). Projections, not guarantees.
Landlord ↔ Tenant lean methodology
- Overall (STATE)
- 90 Strongly Landlord-Friendly
- State South Carolina
- 90 Strongly Landlord-Friendly · R+6
- County
- — inherits STATE
- City
- — inherits STATE
ZIP-level market 29201
- Rents YoY
- 3.2%
- Active inventory
- 114
- Price-to-rent
- 10.9×
Monthly cashflow live
- Estimated rent
- $1,876 high interval (Pro) →
- Mortgage (P&I)
- −$1,285
- Tax from tax record
- −$87 /mo · $1,047/yr
- Insurance
- −$102
- HOA est. from 5 same-building comps
- −$542
- Vacancy / Maint / Mgmt
- −$394
- Net cashflow
- $-534
Break-even live
UW: 25.0% down · 7.5% · 30yr · 1.5% tax · 5.0% vac · 8.0% maint · 8.0% mgmt
Financing live
Cash to close
- Down payment
- $61,250
- Closing costs
- $7,350
- Reserves months
- —
- Total cash needed
- —
Loan-product check · same deal, 3 products live
Conventional
25% down · 7.5% · 30yr
- Down + closing
- —
- Monthly P&I
- —
- Monthly cashflow
- —
- DSCR
- —
- Eligible?
- —
Personal DTI + credit; lowest rate.
DSCR
20% down · 8.5% · 30yr
- Down + closing
- —
- Monthly P&I
- —
- Monthly cashflow
- —
- DSCR
- —
- Eligible?
- —
No personal income docs; deal must DSCR.
Hard money
10% down · 12.0% · 12mo
- Down + closing
- —
- Monthly P&I
- —
- Monthly cashflow
- —
- DSCR
- —
- Eligible?
- —
Short-term bridge; refi at stabilization.
Rent comps 30 comps
| Address | Beds | Baths | Sqft | Rent | $/sqft | DOM | Units | Dist |
|---|---|---|---|---|---|---|---|---|
| 900 Taylor St #304 Columbia, SC | 2.0 | 2.0 | 950 | $1,850 | $1.95 | 23d | 1 | 0.02mi |
| 1155 Lady St Columbia, SC | 2.0 | 1.0–2.0 | 687 | $2,300 | $3.35 | 14d | 8 | 0.34mi |
| 701 Gervais St Columbia, SC | 2.0 | 2.0 | 1184 | $2,108 | $1.78 | 19d | 3 | 0.38mi |
| 900 Vista Towers Dr Columbia, SC | 1.0–3.0 | 1.0–2.0 | 1044 | $1,524 | $1.46 | 11d | 20 | 0.57mi |
| 1003 Elmwood Ave Columbia, SC | 1.0–2.0 | 1.0–2.0 | 937 | $1,649 | $1.76 | 11d | 4 | 0.58mi |
| 1930 Marion St Columbia, SC | 2.0 | 1.0 | 612 | $1,500 | $2.45 | 11d | 31 | 0.62mi |
| 1230 Pendleton St Columbia, SC | 1.0–2.0 | 1.0 | 702 | $1,500 | $2.14 | 14d | 9 | 0.68mi |
| 1520 Senate St Columbia, SC | 2.0 | 1.5 | 1045 | $2,300 | $2.20 | 23d | 1 | 0.79mi |
| 1404 Victoria St Columbia, SC | 1.0 | 1.0 | 780 | $1,400 | $1.79 | 14d | 1 | 0.94mi |
| 601 Main St Columbia, SC | 2.0 | 2.0 | 1404 | $2,300 | $1.64 | 19d | 1 | 0.97mi |
| 601 Main St Columbia, SC | 1.0–2.0 | 1.0–2.0 | 1098 | $2,500 | $2.28 | 23d | 2 | 0.97mi |
| 601 Main St Columbia, SC | 1.0–2.0 | 1.0–2.0 | 1244 | $2,500 | $2.01 | 14d | 2 | 0.97mi |
| 4000 Trade St West Columbia, SC | 1.0 | 1.0 | 768 | $2,055 | $2.68 | 2d | 4 | 1.06mi |
| 2617 River Dr Columbia, SC | 2.0–3.0 | 1.0–2.0 | 1038 | $427 | $0.41 | 14d | 2 | 1.08mi |
| 1018 Laurens St Columbia, SC | 3.0 | 1.0 | 1500 | $2,700 | $1.80 | 23d | 1 | 1.15mi |
| 1012 Laurens St Columbia, SC | 2.0 | 1.0 | 750 | $1,900 | $2.53 | 11d | 1 | 1.16mi |
| 127 State St West Columbia, SC | 1.0–2.0 | 1.0–2.0 | 975 | $2,390 | $2.45 | 2d | 9 | 1.19mi |
| 2901 Park St Columbia, SC | 3.0 | 2.0 | 1288 | $2,750 | $2.14 | 23d | 1 | 1.21mi |
| 326 Hudson St West Columbia, SC | 2.0 | 1.0 | 1187 | $1,075 | $0.91 | 23d | 1 | 1.21mi |
| 919 Catawba St Columbia, SC | 3.0 | 3.0 | 1334 | $1,100 | $0.82 | 23d | 1 | 1.22mi |
| 168 Canal Place Cir Columbia, SC | 3.0 | 2.5 | 1437 | $2,250 | $1.57 | 23d | 1 | 1.27mi |
| 215 Northwood St Columbia, SC | 3.0 | 2.5 | 1288 | $1,849 | $1.44 | 23d | 1 | 1.33mi |
| 2002 Greene St Columbia, SC | 2.0 | 1.0–2.0 | 795 | $1,325 | $1.67 | 14d | 1 | 1.33mi |
| 800 Alexander Rd Cayce, SC | 2.0 | 2.0 | 800 | $870 | $1.09 | 23d | 1 | 1.36mi |
| 328 Northwood St Columbia, SC | 3.0 | 2.5 | 1461 | $2,395 | $1.64 | 23d | 1 | 1.37mi |
| 504 State St West Columbia, SC | 2.0 | 1.0 | 1000 | $1,500 | $1.50 | 2d | 1 | 1.41mi |
| 98 Riverview Ct Columbia, SC | 3.0 | 2.0 | 1257 | $1,800 | $1.43 | 14d | 1 | 1.45mi |
| 2413 Laurel St Unit C Columbia, SC | 2.0 | 1.0 | 800 | $900 | $1.12 | 23d | 1 | 1.49mi |
| 111 Knox Abbott Dr Cayce, SC | 1.0–2.0 | 1.0–2.0 | 1103 | $2,539 | $2.30 | 2d | 12 | 1.49mi |
| 2229 Greene St Columbia, SC | 3.0 | 2.0 | 1050 | $1,695 | $1.61 | 19d | 1 | 1.49mi |
HOA detail condo
- Monthly dues
- $0 · $0/yr
- Likely covers
- watersewertrashpoolgymsecurity
- Assessments
- None detected in remarks — confirm with the listing agent.
Listing history 23 events
-
2026-06-18days on market $245,000 Active 38 DOM
-
2026-06-17days on market $245,000 Active 37 DOM
-
2026-06-16days on market $245,000 Active 36 DOM
-
2026-06-15price $245,000 Active 35 DOM
-
2026-06-15days on market $250,000 Active 35 DOM
-
2026-06-14days on market $250,000 Active 33 DOM
-
2026-06-10days on market $250,000 Active 30 DOM
-
2026-06-09days on market $250,000 Active 29 DOM
-
2026-06-08days on market $250,000 Active 28 DOM
-
2026-06-07days on market $250,000 Active 27 DOM
-
2026-06-03days on market $250,000 Active 23 DOM
-
2026-06-03days on market $250,000 Active 22 DOM
-
2026-06-01days on market $250,000 Active 21 DOM
-
2026-05-31days on market $250,000 Active 20 DOM
-
2026-05-11$250,000 Active
-
2026-04-17status Active
-
2026-03-26status Pending
-
2026-03-04$250,000 Active
-
2020-01-14soldstatus $127,500
-
2019-11-22historical
-
2019-10-03$134,900 Active
-
2007-09-07soldstatus $152,000
-
2004-06-04soldstatus $125,000
ⓘ Source: listings_history table (triggers on properties + properties_extension) + one-shot
backfill from property_details.listing_events for pre-trigger history.
Tax reassessment forecast SC · Resets to sale price
- Current annual tax
- $1,047 · $87/mo
- Projected year-2 tax
- $1,396 · $116/mo
- Expected delta
- +$349/yr (+$29/mo · 33.3%)
ⓘ Screening estimate from a state-policy table — verify with the county assessor before closing.
Climate risk First Street
- Flood 1/10 Low FEMA zone X (unshaded) · 0% chance over 30 yrs
- Wildfire 1/10 Low
- Heat 7/10 Severe 7 d/yr ≥109°F today · 16 d/yr by 30 yrs out
- Wind 6/10 Major 67% chance of damaging wind over 30 yrs
- Air quality 3/10 Moderate 2 unhealthy d/yr today · 2 by 30 yrs out
Nearby sold comps map
Loading sold comps map…
Walkable amenities ~0.75 mi
Loading nearby amenities…
Taxation est. · year 1
- Rental income
- $22,516
- − Mortgage interest
- −$13,724
- − Property taxes
- −$1,047
- − Insurance
- −$1,225
- − Repairs & maintenance
- −$1,801
- − Management
- −$1,801
- − HOA
- −$6,504
- − Depreciation
- −$7,127
- Taxable loss
- −$10,714
- Est. tax savings @ 24.0%
- +$2,571
- After-tax cash flow
- $-3,835/yr
For passive investors: Depreciation is non-cash, so a rental often shows a tax loss while cash-flowing — sheltering income. Rental losses are passive: they offset passive income freely, and up to $25,000/yr can offset ordinary (W-2) income if you actively participate and your MAGI is under $100k (phasing out to $0 by $150k); unused losses carry forward. On sale, claimed depreciation is recaptured at up to 25%, and gains may owe capital-gains tax (a 1031 exchange can defer both). Figures are a year-1 estimate at your 24.0% rate — not tax advice; consult a CPA.
Schools (NCES district)
- District
- Richland 01
- NCES district ID
- 4503360
- Math proficiency
- 26% ▼ -7.00%
- Reading proficiency
- 36% ▼ -5.00%
- Median HH income
- $38,931
- Composite
- 25.94/100
- National rank
- #7335
- State rank
- #54 of 80 in SC
Livability — Columbia
- Score
- 78/100
- State rank
- #18
- US rank
- #2436
Category grades
Schools grade is shown separately in the Schools card above.
Census & demographics
- Census place
- Columbia, SC
- County
- Richland County · 389,530 people
- City population
- 335,994
- Metro
- Columbia, SC
- Population (ZIP)
- 24,605
- Household income
- $32,297
- Rent vs Own
- Severe rent burden
- 3456.0
Population outlook (Richland County) Hauer SSP2
- Today (2025)
- 459,667 people
- By 2030
- 487,524 · +6.1%
- By 2040
- 542,035 · +17.9%
- By 2050
- 595,371 · +29.5%
- By 2075
- 732,998 · +59.5%
- By 2100
- 820,415 · +78.5%
Race, ethnicity, and origin ACS 2023
- Neighborhood character
- Majority White (64%)
- Race & ethnicity
- White 64% Black 24% Hispanic / Latino 4% Asian 4% Two or more races 4%
- Common ancestry
- Italian 2% Lithuanian 2% Serbian 2%
- Foreign-born
- 7% · China, Canada
- Languages at home
- 90% English-only · Spanish 3% Chinese 2% Other Indo-European 2%
Political lean MEDSL · Richland
- 2024 margin
- Solid D (+34.6) · D 66.4% · R 31.8% · Other 1.8%
- 2008→2024 swing
- +5.7pp toward D · 2008: 28.9pp · 2024: 34.6pp
- All cycles
- 2024: D+34.6 2020: D+38.3 2016: D+32.9 2012: D+33.3 2008: D+28.9
Not yet ingested
- Civics
- —
Market trends
- HPI YoY
- ▼ -142.00%
- Current HPI
- 229.8442
- Rent YoY
- ▲ 3.18%
- Metro
- Columbia, SC
- State GDP YoY
- ▲ 4.51%
- F500 in state
- 2
Industry mix (Fortune 500 HQ in SC)
| Industry | F500 HQs | Revenue |
|---|---|---|
| Packaging | 1 | $7B |
|
||
Price history
+100.0% since first listed9 events — show timeline
- 2026-05-11 Listed $250,000 Consolidated MLS
- 2026-04-17 Relisted — Consolidated MLS
- 2026-03-26 Pending — Consolidated MLS
- 2026-03-04 Listed $250,000 Consolidated MLS
- 2020-01-14 Sold (Public Records) $127,500 Public Records
- 2019-11-22 Delisted — Consolidated MLS
- 2019-10-03 Listed $134,900 Consolidated MLS
- 2007-09-07 Sold (Public Records) $152,000 Public Records
- 2004-06-04 Sold (Public Records) $125,000 Public Records
Property tax history
+0.8%/yrLatest (2025): $1,047 · +3.7% YoY. Source: county tax records.
Cash-flow waterfall
monthlySold comps — $/sqft
last 12 mo · ≤1 miLoading sold comps…