 🏗️ New Construction
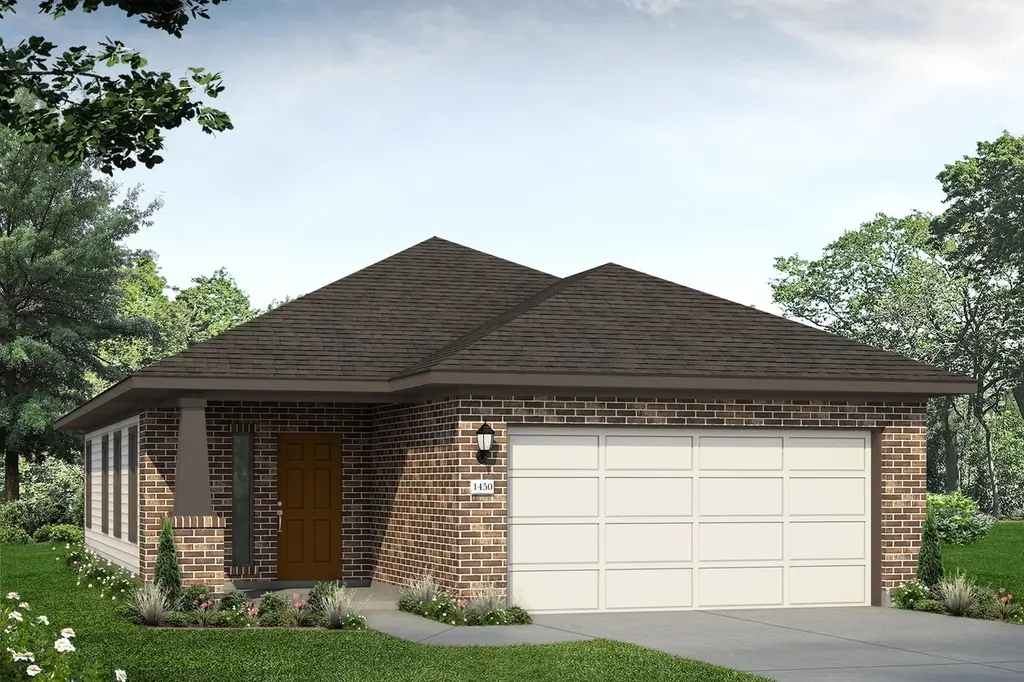
Azalea 1450 Plan · Pattison, TX
Flood risk 1/10 · Minimal
- FEMA flood zone
- X (unshaded)
- Chance of flooding over 30 yrs
- 0.0%
- Est. flood insurance / yr
- $507 – $1,088
Fire risk 4/10 · Minor
- Est. fire insurance / yr
- $1,222 – $2,270
Heat risk 8/10 · Major
- Hot days now (above 111°F)
- 7 days/yr
- Hot days in 30 yrs
- 22 days/yr
Wind risk 9/10 · Severe
- Chance of severe wind over 30 yrs
- 99.0%
Air-quality risk 2/10 · Minimal
- Unhealthy air days now
- 1 days/yr
- Unhealthy air days in 30 yrs
- 1 days/yr
Risk factors via First Street. Map © Google.
Why this score? — see what drove the C- grade
The composite is a weighted blend of 9 inputs, each scored 0–100. Each bar is that input's sub-score; the figure is the points it added to the 100-point composite (weight × sub-score).
- Cash flow +22.0/30.0
- ARV discount +7.5/15.0
- DSCR +7.0/10.0
- 1% rule +5.8/10.0
- Condition / age +4.0/5.0
- Livability +3.2/5.0
- Rent growth +2.2/5.0
- Schools +2.0/10.0
- Appreciation +0.0/10.0
$219,990
🖨 Deal sheet 📄 Offer letter ✓ Due diligence
Listing remarks
Azalea brings a refreshing blend of comfort, value, and opportunity to Pattison-perfectly placed just north of Morton Ranch Road and minutes from Katy's growing west side. In one of Houston's fastest-rising corridors, this community pairs small-town warmth with modern living, including a pool, and inviting spaces that naturally support neighborly connection and local events. Families benefit from being zoned to Royal ISD, while quick access to major thoroughfares makes reaching Houston, the Energy Corridor, and nearby destinations simple. With everyday conveniences and new growth all around, Azalea offers a place where long-term value and an easygoing lifestyle come together.
Key facts
- Zoned to royal isd
- 2 garage spots
- Listed 20 days
Tags
Property features AI
Finance
- Other: Address: 308 Magnolia View Dr, Brookshire TX 77423; Status: Active
- Financial info: List price $219,990
Exterior
- Parking: 2 total parking spaces; 2-car garage
- Home design: New construction plan: Azalea 1450; Plan inventory type
Interior
- Bedrooms: 3 bedrooms
- Bathrooms: 2 full bathrooms
- Interior features: Living area of 1449
Neighborhood map
What this means for you Summary
Snapshot
- This is a 3-bed/2.0-bath single-family listed at $220k. Condition is rated good.
Deal economics
- At list price, monthly cash flow is $298 ($4k/yr) — positive.
- The deal already cash-flows at list — no discount required.
- To meet the 1% rule (rent ≥ 1% of price), the offer needs to be $201k (8.5% below list).
- Recommended offer: $201k (8.5% below list) — sets the bar for 1% rule.
- Cap rate 8.2% vs local median 4.4% in Pattison — top-decile yield for the area; either an underpriced asset or a hidden risk that comps aren't pricing in. Stress-test before assuming the spread holds.
Location & tenants
- Location reads 63/100 on livability (#876 in TX) — a middle-class / working-renter tenant base. Strengths: housing A+, crime A, cost of living A; Watch: schools F, amenities F, commute F.
- Royal ISD (rural): math 23% / reading 23% proficiency, ranked #744 of 826 in TX (top 90%) — low school quality limits family demand, transient renter base, plan for 1-2y turnover; 77% free/reduced lunch — lower-income household profile, screen leases tightly.
- Market conditions: Rents soft (-1.0%/yr); 997 active listings in the ZIP; solid renter incomes; 483 units permitted in Waller County in 2024 (89 in 5+ unit buildings).
Forward outlook
- Local home prices are declining (-3.0%/yr); year-one equity from $1k of loan paydown is wiped out by about $6k of value loss. Plan a longer hold.
- Waller County population projected at +62% by 2050 — long-run rental-demand tailwind backs the buy-and-hold thesis.
Negotiation context
- It's been on market 20 days — a 2% lower offer ($217k) is reasonable based on typical stale-listing flexibility.
Risks & watch-outs
- Climate carrying-cost: severe wind risk, 99% chance of damaging wind over 30y; extreme-heat days projected 7→22/yr by 2055 (HVAC capex compounding) — expect insurance premiums to compound above CPI over the hold.
Questions for the listing agent
- Is there a deadline driving the sale (1031 exchange, divorce, estate, relocation)? That informs how much negotiation room exists.
- Schools are F-rated, which usually means shorter tenancies and higher turnover. Who's the typical renter profile here, and what's been the actual vacancy rate?
- What's the average days-on-market for RENTAL listings here right now (not sales)? A rising rental-DOM trend means longer vacancies and softer asking-rent achievability than the comps imply.
- What's the recent tenant-quality profile in this submarket — average credit score on applications, eviction rate, late-payment / NSF rate, and stable-employment percentage? A property-management company in the area should have these aggregated.
- How much new for-sale + rental construction is in the pipeline within 1–3 miles? Heavy new supply typically softens prices + rents 12–24 months out; constrained supply supports both.
Investment metrics
- 1% rule
- 1.08% ✓
- Cap rate
- 8.21%
- Cash-on-cash
- 6.83%
- DSCR
- 1.30
- GRM
- 7.7
CMA / ARV
- ARV (on-the-fly)
- $186,921
- Comps found
- 1
Show comp detail 1 sale within ~0.75 mi
| Address | Dist | Beds/Ba | Sqft | Sold | Price | $/sf | Match |
|---|---|---|---|---|---|---|---|
| 305 Redbud Ridge DR | 0.06mi | 2/2.0 (-1) | 1,488 (+3%) | 14mo | $192,500 | $129 | 76 |
Match score weights: distance 35% · size 25% · config 20% · recency 20%. Top-matched comps best support the ARV.
Projected returns pro-forma
-3.0% appreciation · 0.0% rent growth · sell at horizon
- IRR
- -9.2%
- Equity multiple
- 0.67×
- Total profit
- $-17,179
- Equity at exit
- $27,871
- IRR
- -4.4%
- Equity multiple
- 0.75×
- Total profit
- $-13,190
- Equity at exit
- $16,162
Cash invested: $52,338 (down + closing). Projections, not guarantees.
Landlord ↔ Tenant lean methodology
- Overall (STATE)
- 87 Strongly Landlord-Friendly
- State Texas
- 87 Strongly Landlord-Friendly · R+5
- County
- — inherits STATE
- City
- — inherits STATE
ZIP-level market 77423
- Rents YoY
- -1.0%
- Active inventory
- 997
- Price-to-rent
- 9.1×
Monthly cashflow live
- Estimated rent
- $2,012 medium interval (Pro) →
- Mortgage (P&I)
- −$980
- Tax est. 1.5%
- −$234 /mo · $2,804/yr
- Insurance
- −$78
- HOA
- −$0
- Vacancy / Maint / Mgmt
- −$423
- Net cashflow
- $298
Break-even live
UW: 25.0% down · 7.5% · 30yr · 1.5% tax · 5.0% vac · 8.0% maint · 8.0% mgmt
Financing live
Cash to close
- Down payment
- $46,730
- Closing costs
- $5,608
- Reserves months
- —
- Total cash needed
- —
Loan-product check · same deal, 3 products live
Conventional
25% down · 7.5% · 30yr
- Down + closing
- —
- Monthly P&I
- —
- Monthly cashflow
- —
- DSCR
- —
- Eligible?
- —
Personal DTI + credit; lowest rate.
DSCR
20% down · 8.5% · 30yr
- Down + closing
- —
- Monthly P&I
- —
- Monthly cashflow
- —
- DSCR
- —
- Eligible?
- —
No personal income docs; deal must DSCR.
Hard money
10% down · 12.0% · 12mo
- Down + closing
- —
- Monthly P&I
- —
- Monthly cashflow
- —
- DSCR
- —
- Eligible?
- —
Short-term bridge; refi at stabilization.
Listing history 13 events
-
2026-06-18days on market $219,990 Active 20 DOM
-
2026-06-17days on market $219,990 Active 19 DOM
-
2026-06-16days on market $219,990 Active 18 DOM
-
2026-06-15days on market $219,990 Active 17 DOM
-
2026-06-13days on market $219,990 Active 15 DOM
-
2026-06-10days on market $219,990 Active 11 DOM
-
2026-06-08days on market $219,990 Active 10 DOM
-
2026-06-07days on market $219,990 Active 9 DOM
-
2026-06-04days on market $219,990 Active 6 DOM
-
2026-06-03days on market $219,990 Active 5 DOM
-
2026-06-02days on market $219,990 Active 4 DOM
-
2026-06-01days on market $219,990 Active 3 DOM
-
2026-05-31days on market $219,990 Active 2 DOM
ⓘ Source: listings_history table (triggers on properties + properties_extension) + one-shot
backfill from property_details.listing_events for pre-trigger history.
Climate risk First Street
- Flood 1/10 Low FEMA zone X (unshaded) · 0% chance over 30 yrs
- Wildfire 4/10 Moderate
- Heat 8/10 Severe 7 d/yr ≥111°F today · 22 d/yr by 30 yrs out
- Wind 9/10 Extreme 99% chance of damaging wind over 30 yrs
- Air quality 2/10 Low 1 unhealthy d/yr today · 1 by 30 yrs out
Nearby sold comps map
Loading sold comps map…
Walkable amenities ~0.75 mi
Loading nearby amenities…
Taxation est. · year 1
- Rental income
- $24,148
- − Mortgage interest
- −$10,470
- − Property taxes
- −$2,804
- − Insurance
- −$935
- − Repairs & maintenance
- −$1,932
- − Management
- −$1,932
- − Depreciation
- −$5,438
- Taxable income
- $638
- Est. tax owed @ 24.0%
- −$153
- After-tax cash flow
- $3,423/yr
For passive investors: Depreciation is non-cash, so a rental often shows a tax loss while cash-flowing — sheltering income. Rental losses are passive: they offset passive income freely, and up to $25,000/yr can offset ordinary (W-2) income if you actively participate and your MAGI is under $100k (phasing out to $0 by $150k); unused losses carry forward. On sale, claimed depreciation is recaptured at up to 25%, and gains may owe capital-gains tax (a 1031 exchange can defer both). Figures are a year-1 estimate at your 24.0% rate — not tax advice; consult a CPA.
Condition & rehab AI · 3 photos
This home is in good condition with a good exterior, interior, and systems. It has a good curb appeal and is ready for minor updates to enhance its resale and rental value.
Value-add opportunities
- Both Painting the exterior — Fresh paint can enhance curb appeal and property value.
- Both Landscaping improvements — Enhanced landscaping can improve curb appeal and attract potential buyers.
- Both Interior touch-ups — Fresh paint and minor touch-ups can improve the home's appearance and value.
- Rental HVAC maintenance — A clean and efficient HVAC system is crucial for rental properties.
- Resale Kitchen and bathroom updates — Updating these spaces can significantly increase the home's appeal and value for resale.
Renovation cost estimate screening
Value-add ROI direction
- Both Painting the exterior — Fresh paint can enhance curb appeal and property value. ↑
- Both Landscaping improvements — Enhanced landscaping can improve curb appeal and attract potential buyers. ↑
- Both Interior touch-ups — Fresh paint and minor touch-ups can improve the home's appearance and value. ↑
- Rental HVAC maintenance — A clean and efficient HVAC system is crucial for rental properties. ↑
- Resale Kitchen and bathroom updates — Updating these spaces can significantly increase the home's appeal and value for resale. ↑
ⓘ Cost ranges are severity-bucket heuristics (US national rule-of-thumb). Get contractor quotes + a written scope before underwriting a rehab budget.
Schools (NCES district)
- District
- Royal ISD
- NCES district ID
- 4838190
- Math proficiency
- 23% ▼ -11.00%
- Reading proficiency
- 23% ▼ -6.00%
- Median HH income
- $41,059
- Composite
- 19.55/100
- National rank
- #8760
- State rank
- #744 of 826 in TX
Livability — Pattison
- Score
- 63/100
- State rank
- #876
- US rank
- #15789
Category grades
Schools grade is shown separately in the Schools card above.
Census & demographics
- County
- Waller County · 18,767 people
- City population
- 18,767
- Metro
- Houston-The Woodlands-Sugar Land, TX
- Population (ZIP)
- 18,767
- Household income
- $84,490
- Rent vs Own
- Severe rent burden
- 20.0
Population outlook (Waller County) Hauer SSP2
- Today (2025)
- 60,772 people
- By 2030
- 67,616 · +11.3%
- By 2040
- 82,283 · +35.4%
- By 2050
- 98,276 · +61.7%
- By 2075
- 142,860 · +135.1%
- By 2100
- 175,596 · +188.9%
Race, ethnicity, and origin ACS 2023
- Neighborhood character
- Diverse neighborhood (Simpson 0.64)
- Race & ethnicity
- Hispanic / Latino 41% White 41% Black 14% Two or more races 13% Asian 2% Native American 1%
- Hispanic origin (detail)
- Mexican 30% Cuban 2%
- Common ancestry
- Lithuanian 2% Italian 2% Slovak 1%
- Foreign-born
- 17% · Canada, China, Dominican Republic
- Languages at home
- 65% English-only · Spanish 32% French/Haitian/Cajun 1% Other Indo-European 1%
Political lean MEDSL · Waller
- 2024 margin
- Strong R (+25.0) · D 37.0% · R 62.0% · Other 1.0%
- 2008→2024 swing
- -17.9pp toward R · 2008: -7.2pp · 2024: -25.0pp
- All cycles
- 2024: R+25.0 2020: R+26.7 2016: R+28.6 2012: R+17.6 2008: R+7.2
Not yet ingested
- Civics
- —
Market trends
- HPI YoY
- ▼ -125.28%
- Current HPI
- 204.8709
- Rent YoY
- ▼ -1.01%
- Metro
- Houston-The Woodlands-Sugar Land, TX
- State GDP YoY
- ▲ 3.95%
- F500 in state
- 110
Industry mix (Fortune 500 HQ in TX)
| Industry | F500 HQs | Revenue |
|---|---|---|
| Energy | 16 | $1,198B |
|
||
| Technology | 5 | $198B |
|
||
| Engineering / Construction | 4 | $72B |
|
||
| Energy Services | 3 | $60B |
|
||
| Utilities | 3 | $41B |
|
||
| Healthcare | 2 | $330B |
|
||
Cash-flow waterfall
monthlySold comps — $/sqft
last 12 mo · ≤1 miLoading sold comps…