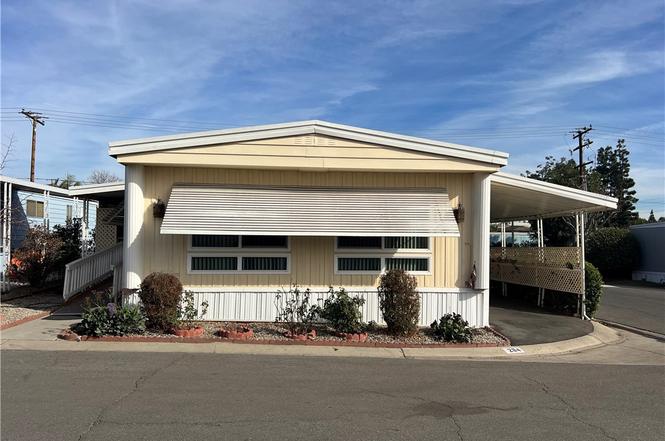
1001 W Lambert Rd #284 · La Habra, CA
Flood risk 1/10 · Minimal
- FEMA flood zone
- X (unshaded)
- Chance of flooding over 30 yrs
- 0.0%
- Est. flood insurance / yr
- $507 – $1,088
Fire risk 1/10 · Minimal
- Est. fire insurance / yr
- $659 – $1,223
Heat risk 6/10 · Moderate
- Hot days now (above 96°F)
- 7 days/yr
- Hot days in 30 yrs
- 21 days/yr
Wind risk 1/10 · Minimal
- Chance of severe wind over 30 yrs
- —
Air-quality risk 5/10 · Moderate
- Unhealthy air days now
- 9 days/yr
- Unhealthy air days in 30 yrs
- 10 days/yr
Risk factors via First Street. Map © Google.
Why this score? — see what drove the B- grade
The composite is a weighted blend of 9 inputs, each scored 0–100. Each bar is that input's sub-score; the figure is the points it added to the 100-point composite (weight × sub-score).
- Cash flow +30.0/30.0
- DSCR +10.0/10.0
- 1% rule +8.5/10.0
- Schools +5.1/10.0
- Rent growth +3.3/5.0
- Livability +3.2/5.0
- ARV discount +3.1/15.0
- Condition / age +2.5/5.0
- Appreciation +0.0/10.0
$215,000
🖨 Deal sheet (PDF) 📄 Offer letter ✓ Due diligence
Listing remarks
Location! Location! Location! Spacious and Bright! Double Wide Mobile Home located in Friendly Village of La Habra, a 55+ Community. This home shows 2 Bedrooms 2 Bathrooms, Open floor plan, Spacious Living room & Family room. Current owner totally renovated a few years age. Newer all double glassed windows in the house. Newer Laminate Wood Floorings throughout the house. Huge Kitchen area with Newer Granite countertop & cabinets. A big size patio and spacious back yard with lots of fruit trees and 2 storage sheds. What a beautiful back yard! Newer painted In & Out. Friendly Village Senior Community features many awesome amenities including a Swimming Pool, Spa, Gym, BBQ Ar
Key facts
- Huge kitchen area
- Spacious back yard
- Lots of fruit trees
Tags
Property features AI
Finance
- Other: Land lease amount applies
- Financial info: Land lease required
- HOA & community: Senior community; Community features include dog park, street lighting, and suburban setting; Park name: Friendly Village of La Habra; Manager approval required; Pets allowed
Exterior
- Parking: 2 garage spaces; 2 total parking spaces
- Utilities: Electricity on property; District/public water; Sewer paid
- Home design: Single-story mobile home (24' x 60'); Entry at main level; Mobile home remains on site
- Construction: Wood, aluminum, and steel construction
- Exterior features: In-ground community pool (fenced); Garden
Interior
- Kitchen: Granite counters; Water heater unit; Microwave; Refrigerator; Gas oven; Dishwasher
- Bedrooms: All bedrooms located on the main level
- Flooring: Laminated flooring
- Bathrooms: 2 full bathrooms with bathtub and shower
- Heating & cooling: Central furnace (natural gas); Wall/window cooling units
- Interior features: Balcony; Storage space; Granite counters; One-level home
- Laundry & utility: Washer hookup; Gas and electric dryer hookup; In-closet laundry
Neighborhood map
What this means for you Summary
Snapshot
- This is a 2-bed/2.0-bath manufactured listed at $215k.
Deal economics
- At list price, monthly cash flow is $801 ($10k/yr) — positive.
- The deal already cash-flows at list — no discount required.
- Meets the 1% rule at list price ($3k rent vs $215k).
- Recommended offer: $189k (12.0% below list) — sets the bar for market timing.
- Cap rate 10.8% vs local median 2.1% in La Habra — top-decile yield for the area; either an underpriced asset or a hidden risk that comps aren't pricing in. Stress-test before assuming the spread holds.
Location & tenants
- Location reads 65/100 on livability (#384 in CA) — a middle-class / working-renter tenant base. Strengths: commute A+, employment A+; Watch: crime D+, health & safety D+, amenities F.
- Fullerton Joint Union High (suburban): math 51% / reading 66% proficiency, ranked #82 of 517 in CA (top 16%) — acceptable for families but not a draw, mixed tenant base, ~2y average lease.
- Zoned schools: Las Positas Elementary (math 24% / reading 24%, grade F, #973 of 1,571 statewide, top 73%, 560 students, 76% FRL); Imperial Middle (math 24% / reading 24%, grade F, #277 of 498 statewide, top 73%, 460 students, 79% FRL).
- Zoned-school proficiency averages 24% at this address vs 58% district-wide (-34 pts) — the specific schools serving this property underperform the Fullerton Joint Union High average; the district grade overstates school quality for this exact location.
- Market conditions: Rents rising (+3.4%/yr); 135 active listings in the ZIP; 29 comparable units currently listed for rent nearby; rentals leasing fast (median 0d on market — plan ~1-2 weeks tenant-placement turnaround); solid renter incomes; 6,974 units permitted in Orange County in 2024 (3,839 in 5+ unit buildings).
Forward outlook
- Local home prices are declining (-3.0%/yr); year-one equity from $1k of loan paydown is wiped out by about $6k of value loss. Plan a longer hold.
- Orange County population projected at +14% by 2050 — modest demand growth; plan on rents tracking national, not racing it.
- At projected returns (-3.0% appreciation + 3.4% rent growth), your $60k cash investment doubles in ~8 years — after that, you're playing with house money.
Negotiation context
- It's been on market 136 days — a 12% lower offer ($189k) is reasonable based on typical stale-listing flexibility.
- 8 sale attempts since 19y ago with the ask held roughly flat each time — persistent listings suggest the price (not the market) is what's stuck; bring a comps-based counter.
- Current owner paid $47k; list at $215k implies a 357% gain — meaningful room to come down on a strong offer.
Risks & watch-outs
- Climate carrying-cost: extreme-heat days projected 7→21/yr by 2055 (HVAC capex compounding) — expect insurance premiums to compound above CPI over the hold.
Questions for the listing agent
- It's been on market 136 days. Have you received any prior offers? Is the seller open to a 12% concession, seller financing, or rate buy-down credit?
- Built in 1970 — when were the roof, HVAC, electrical panel, plumbing, and water heater last replaced?
- Why hasn't it sold? Are there any deal-killer items the seller is aware of (foundation, flood, title, zoning, code violations)?
- Is there a deadline driving the sale (1031 exchange, divorce, estate, relocation)? That informs how much negotiation room exists.
- Schools are D-rated, which usually means shorter tenancies and higher turnover. Who's the typical renter profile here, and what's been the actual vacancy rate?
- Crime grade is D in this area — have there been break-ins, vandalism, or insurance claims at this property in the last 3 years? What carrier currently insures it and at what premium?
- What's the average days-on-market for RENTAL listings here right now (not sales)? A rising rental-DOM trend means longer vacancies and softer asking-rent achievability than the comps imply.
- What's the recent tenant-quality profile in this submarket — average credit score on applications, eviction rate, late-payment / NSF rate, and stable-employment percentage? A property-management company in the area should have these aggregated.
- How much new for-sale + rental construction is in the pipeline within 1–3 miles? Heavy new supply typically softens prices + rents 12–24 months out; constrained supply supports both.
Investment metrics
- 1% rule
- 1.35% ✓
- Cap rate
- 10.76%
- Cash-on-cash
- 15.97%
- DSCR
- 1.71
- GRM
- 6.2
CMA / ARV
- ARV (on-the-fly)
- $195,840
- Comps found
- 12
Show comp detail 12 sales within ~0.75 mi
| Address | Dist | Beds/Ba | Sqft | Sold | Price | $/sf | Match |
|---|---|---|---|---|---|---|---|
| 1001 W Lambert Rd #87 | 0.00mi | 2/2.0 | 1,440 (0%) | 7mo | $220,000 | $153 | 94 |
| 1001 W Lambert Rd #327 | 0.00mi | 2/2.0 | 1,440 (0%) | 11mo | $120,000 | $83 | 91 |
| 1001 W Lambert Rd #159 | 0.02mi | 2/2.0 | 1,440 (0%) | 13mo | $190,000 | $132 | 88 |
| 1001 W Lambert Rd #20 | 0.14mi | 2/2.0 | 1,440 (0%) | 8mo | $105,000 | $73 | 87 |
| 1001 W Lambert Rd #37 | 0.21mi | 2/2.0 | 1,440 (0%) | 8mo | $93,000 | $65 | 83 |
| 1001 Lambert Rd Spc 35 | 0.19mi | 2/2.0 | 1,464 (+2%) | 10mo | $169,000 | $115 | 80 |
| 1001 W Lambert Rd #100 | 0.19mi | 2/2.0 | 1,400 (-3%) | 12mo | $189,000 | $135 | 76 |
| 1001 W Lambert Rd #213 | 0.00mi | 2/2.0 | 1,350 (-6%) | 16mo | $185,000 | $137 | 76 |
| 1001 W Lambert Rd #289 | 0.00mi | 2/2.0 | 1,248 (-13%) | 14mo | $170,000 | $136 | 66 |
| 1001 W Lambert Rd #314 | 0.19mi | 3/2.0 (+1) | 1,344 (-7%) | 15mo | $195,000 | $145 | 62 |
| 1001 Lambert Rd #15 | 0.22mi | 2/2.0 | 1,296 (-10%) | 14mo | $190,000 | $147 | 61 |
| 1750 W Lambert Rd #112 | 0.51mi | 3/2.0 (+1) | 1,344 (-7%) | 6mo | $230,000 | $171 | 56 |
Match score weights: distance 35% · size 25% · config 20% · recency 20%. Top-matched comps best support the ARV.
Projected returns pro-forma
-3.0% appreciation · 3.38% rent growth · sell at horizon
- IRR
- 7.3%
- Equity multiple
- 1.29×
- Total profit
- $17,343
- Equity at exit
- $32,057
- IRR
- 17.0%
- Equity multiple
- 2.42×
- Total profit
- $85,581
- Equity at exit
- $18,589
Cash invested: $60,200 (down + closing). Projections, not guarantees.
Landlord ↔ Tenant lean methodology
- Overall (STATE)
- 18 Strongly Tenant-Friendly
- State California
- 18 Strongly Tenant-Friendly · D+13
- County
- — inherits STATE
- City
- — inherits STATE
ZIP-level market 90631
- Rents YoY
- 3.4%
- Active inventory
- 135
- Price-to-rent
- 6.2×
Monthly cashflow live
- Estimated rent
- $2,895 high interval (Pro) →
- Mortgage (P&I)
- −$1,127
- Tax est. 1.5%
- −$269 /mo · $3,225/yr
- Insurance
- −$90
- HOA
- −$0
- Vacancy / Maint / Mgmt
- −$608
- Net cashflow
- $801
Break-even live
Sensitivity live
| Price | -10% $950 | -5% $875 | +0% $801 | +5% $727 | +10% $653 |
|---|---|---|---|---|---|
| Rent | -10% $572 | -5% $687 | +0% $801 | +5% $916 | +10% $1,030 |
| Rate | -1.0pp $909 | -0.5pp $856 | base $801 | +0.5pp $745 | +1.0pp $689 |
UW: 25.0% down · 7.5% · 30yr · 1.5% tax · 5.0% vac · 8.0% maint · 8.0% mgmt
Financing live
Cash to close
- Down payment
- $53,750
- Closing costs
- $6,450
- Reserves months
- —
- Total cash needed
- —
Loan-product check · same deal, 3 products live
Conventional
25% down · 7.5% · 30yr
- Down + closing
- —
- Monthly P&I
- —
- Monthly cashflow
- —
- DSCR
- —
- Eligible?
- —
Personal DTI + credit; lowest rate.
DSCR
20% down · 8.5% · 30yr
- Down + closing
- —
- Monthly P&I
- —
- Monthly cashflow
- —
- DSCR
- —
- Eligible?
- —
No personal income docs; deal must DSCR.
Hard money
10% down · 12.0% · 12mo
- Down + closing
- —
- Monthly P&I
- —
- Monthly cashflow
- —
- DSCR
- —
- Eligible?
- —
Short-term bridge; refi at stabilization.
Rent comps 29 comps
| Address | Beds | Baths | Sqft | Rent | $/sqft | DOM | Units | Dist |
|---|---|---|---|---|---|---|---|---|
| 350 S Monte Vista St Unit 352F La Habra, CA | 2.0 | 1.0 | 925 | $2,200 | $2.38 | 0d | 1 | 0.19mi |
| 321 S Monte Vista St La Habra, CA | 2.0 | 1.0 | 950 | $2,500 | $2.63 | 0d | 1 | 0.20mi |
| 900 W Lambert Rd La Habra, CA | 2.0 | 2.0 | 1000 | $2,745 | $2.75 | 0d | 1 | 0.22mi |
| 1210 W Lambert Rd La Habra, CA | 2.0 | 1.0 | 1053 | $2,550 | $2.42 | 0d | 1 | 0.30mi |
| 881 W La Habra Blvd Unit 9016U La Habra, CA | 2.0 | 2.0 | 907 | $2,295 | $2.53 | 17d | 1 | 0.35mi |
| 901 S Idaho St La Habra, CA | 1.0–2.0 | 1.0 | 769 | $2,819 | $3.66 | 0d | 15 | 0.39mi |
| 1480 W Lambert Rd #300 La Habra, CA | 3.0 | 1.0 | 1023 | $3,250 | $3.18 | 0d | 1 | 0.43mi |
| 971 S Idaho St La Habra, CA | 3.0 | 2.0 | 1073 | $3,100 | $2.89 | 0d | 1 | 0.57mi |
| 200 W Olive Ave La Habra, CA | 2.0 | 2.0 | 1050 | $2,950 | $2.81 | 0d | 1 | 0.57mi |
| 101 W Olive Ave Unit A La Habra, CA | 3.0 | 1.5 | 1100 | $2,950 | $2.68 | 19d | 1 | 0.61mi |
| 515 W Florence Ave #1 La Habra, CA | 3.0 | 2.0 | 1264 | $4,500 | $3.56 | 0d | 1 | 0.63mi |
| 701 W Imperial Hwy La Habra, CA | 1.0–2.0 | 1.0 | 787 | $2,635 | $3.35 | 0d | 3 | 0.65mi |
| 1600 El Dorado Ave La Habra, CA | 3.0 | 2.0 | 1546 | $4,200 | $2.72 | 12d | 1 | 0.66mi |
| 861 Glencliff St La Habra, CA | 1.0–2.0 | 1.0–1.5 | 855 | $2,925 | $3.42 | 0d | 1 | 0.67mi |
| 1151 S Walnut St La Habra, CA | 1.0–2.0 | 1.0–2.0 | 1251 | $2,985 | $2.39 | 0d | 2 | 0.68mi |
| 510 Ridgeway Ln Unit B La Habra, CA | 2.0 | 1.0 | 880 | $2,525 | $2.87 | 3d | 1 | 0.79mi |
| 521 Ridgeway Ln Unit 6 La Habra, CA | 2.0 | 1.0 | 900 | $2,080 | $2.31 | 3d | 1 | 0.82mi |
| 521 Ridgeway Ln Unit 6 La Habra, CA | 2.0 | 1.0 | 900 | $2,080 | $2.31 | 0d | 1 | 0.82mi |
| 951 S Beach Blvd La Habra, CA | 1.0–2.0 | 1.0–2.0 | 974 | $3,544 | $3.64 | 0d | 12 | 0.84mi |
| 930 W Country Ter Unit 34 La Habra, CA | 3.0 | 2.5 | 1493 | $3,800 | $2.55 | 0d | 1 | 0.85mi |
| 650 Mardina Way La Habra, CA | 3.0 | 2.0 | 1681 | $3,850 | $2.29 | 3d | 1 | 1.05mi |
| 703 E Stearns Ave Unit 707-C La Habra, CA | 2.0 | 1.0 | 950 | $2,695 | $2.84 | 0d | 1 | 1.17mi |
| 1131 Urell Dr La Habra, CA | 3.0 | 2.0 | 1574 | $3,950 | $2.51 | 13d | 1 | 1.22mi |
| 171 S Valencia St Unit 3 La Habra, CA | 2.0 | 2.0 | 1000 | $2,450 | $2.45 | 0d | 1 | 1.23mi |
| 11833 Pounds Ave Whittier, CA | 3.0 | 2.0 | 1260 | $4,000 | $3.17 | 0d | 1 | 1.35mi |
| 1236 Devonshire Ln La Habra, CA | 3.0 | 2.5 | 1175 | $3,895 | $3.31 | 0d | 1 | 1.36mi |
| 841 N Stonewood St Apt D La Habra, CA | 2.0 | 1.5 | 1100 | $2,795 | $2.54 | 0d | 1 | 1.39mi |
| 1501 S Beach Blvd La Habra, CA | 1.0–2.0 | 1.0–2.0 | 955 | $3,467 | $3.63 | 0d | 14 | 1.46mi |
| 640 Ward St Unit 2 La Habra, CA | 2.0 | 1.0 | 950 | $2,195 | $2.31 | 18d | 1 | 1.49mi |
Listing history 32 events
-
2026-06-21days on market $215,000 Active 136 DOM
-
2026-06-18days on market $215,000 Active 133 DOM
-
2026-06-17days on market $215,000 Active 132 DOM
-
2026-06-16days on market $215,000 Active 131 DOM
-
2026-06-15days on market $215,000 Active 130 DOM
-
2026-06-13days on market $215,000 Active 128 DOM
-
2026-06-09days on market $215,000 Active 124 DOM
-
2026-06-08days on market $215,000 Active 123 DOM
-
2026-06-07days on market $215,000 Active 122 DOM
-
2026-06-04days on market $215,000 Active 119 DOM
-
2026-06-03days on market $215,000 Active 118 DOM
-
2026-06-02days on market $215,000 Active 117 DOM
-
2026-06-01days on market $215,000 Active 116 DOM
-
2026-05-31days on market $215,000 Active 115 DOM
-
2026-02-27status Active
-
2026-01-21$215,000 Active
-
2025-12-15historical
-
2025-07-29$210,000 Active
-
2025-06-23price $210,000
-
2025-06-11price $199,000
-
2025-01-28$220,000 Active
-
2020-04-26historical Hold Do Not Show
-
2020-03-09$129,000 Active
-
2019-12-30historical
-
2019-10-02$125,000 Active
-
2016-06-23soldstatus $47,000 Closed Sale
-
2016-06-09status Pending Sale
-
2016-03-22price $55,000
-
2016-03-22$57,000 Active
-
2007-11-16soldstatus $50,000
-
2007-10-15historical
-
2007-09-17$59,000
ⓘ Source: listings_history table (triggers on properties + properties_extension) + one-shot
backfill from property_details.listing_events for pre-trigger history.
Climate risk First Street
- Flood 1/10 Low FEMA zone X (unshaded) · 0% chance over 30 yrs
- Wildfire 1/10 Low
- Heat 6/10 Major 7 d/yr ≥96°F today · 21 d/yr by 30 yrs out
- Wind 1/10 Low
- Air quality 5/10 Major 9 unhealthy d/yr today · 10 by 30 yrs out
Nearby sold comps map
Loading sold comps map…
Walkable amenities ~0.75 mi
Loading nearby amenities…
Taxation est. · year 1
- Rental income
- $34,739
- − Mortgage interest
- −$12,043
- − Property taxes
- −$3,225
- − Insurance
- −$1,075
- − Repairs & maintenance
- −$2,779
- − Management
- −$2,779
- − Depreciation
- −$6,255
- Taxable income
- $6,583
- Est. tax owed @ 24.0%
- −$1,580
- After-tax cash flow
- $8,034/yr
For passive investors: Depreciation is non-cash, so a rental often shows a tax loss while cash-flowing — sheltering income. Rental losses are passive: they offset passive income freely, and up to $25,000/yr can offset ordinary (W-2) income if you actively participate and your MAGI is under $100k (phasing out to $0 by $150k); unused losses carry forward. On sale, claimed depreciation is recaptured at up to 25%, and gains may owe capital-gains tax (a 1031 exchange can defer both). Figures are a year-1 estimate at your 24.0% rate — not tax advice; consult a CPA.
Schools (NCES district)
- District
- Fullerton Joint Union High
- NCES district ID
- 0614760
- Math proficiency
- 51% ▲ 7.00%
- Reading proficiency
- 66% ▲ 1.00%
- Median HH income
- $66,666
- Composite
- 51.37/100
- National rank
- #1735
- State rank
- #82 of 517 in CA
Livability — La Habra
- Score
- 65/100
- State rank
- #384
- US rank
- #13097
Category grades
Schools grade is shown separately in the Schools card above.
Census & demographics
- Census place
- La Habra, CA
- County
- Orange County · 3,096,323 people
- City population
- 68,309
- Metro
- Los Angeles-Long Beach-Anaheim, CA
- Population (ZIP)
- 68,309
- Household income
- $104,251
- Rent vs Own
- Severe rent burden
- 2093.0
Population outlook (Orange County) Hauer SSP2
- Today (2025)
- 3,477,456 people
- By 2030
- 3,613,117 · +3.9%
- By 2040
- 3,835,945 · +10.3%
- By 2050
- 3,968,736 · +14.1%
- By 2075
- 4,097,053 · +17.8%
- By 2100
- 3,903,633 · +12.3%
Race, ethnicity, and origin ACS 2023
- Neighborhood character
- Diverse neighborhood (Simpson 0.60)
- Race & ethnicity
- Hispanic / Latino 56% White 26% Two or more races 22% Asian 12% Black 2% Native American 2%
- Hispanic origin (detail)
- Mexican 49%
- Common ancestry
- Lithuanian 1% Italian 1% Slovak 1%
- Foreign-born
- 25% · Canada, South Korea, China
- Languages at home
- 53% English-only · Spanish 36% Korean 4% Chinese 2%
Political lean MEDSL · Orange
- 2024 margin
- Toss-up / Even · D 49.7% · R 47.1% · Other 3.2%
- 2008→2024 swing
- +5.2pp toward D · 2008: -2.6pp · 2024: 2.6pp
- All cycles
- 2024: D+2.6 2020: D+9.0 2016: D+7.7 2012: R+8.3 2008: R+2.6
Not yet ingested
- Civics
- —
Market trends
- HPI YoY
- ▼ -757.47%
- Current HPI
- 399.4947
- Rent YoY
- ▲ 3.38%
- Metro
- Los Angeles-Long Beach-Anaheim, CA
- State GDP YoY
- ▲ 3.21%
- F500 in state
- 116
Industry mix (Fortune 500 HQ in CA)
| Industry | F500 HQs | Revenue |
|---|---|---|
| Technology | 27 | $1,492B |
|
||
| Financial Services | 3 | $174B |
|
||
| Retail | 3 | $44B |
|
||
| Insurance | 3 | $26B |
|
||
| Media / Entertainment | 2 | $115B |
|
||
| Pharmaceuticals / Biotech | 2 | $62B |
|
||
Price history
+264.4% since first listed18 events — show timeline
- 2026-02-27 Relisted — CRMLS
- 2026-01-21 Listed $215,000 CRMLS
- 2025-12-15 Listing Removed — CRMLS
- 2025-07-29 Listed $210,000 CRMLS
- 2025-06-23 Price Changed $210,000 CRMLS
- 2025-06-11 Price Changed $199,000 CRMLS
- 2025-01-28 Listed $220,000 CRMLS
- 2020-04-26 Delisted — CRMLS
- 2020-03-09 Listed $129,000 CRMLS
- 2019-12-30 Listing Removed — CRMLS
- 2019-10-02 Listed $125,000 CRMLS
- 2016-06-23 Sold (MLS) $47,000 CRMLS
- 2016-06-09 Pending — CRMLS
- 2016-03-22 Price Changed $55,000 CRMLS
- 2016-03-22 Listed $57,000 CRMLS
- 2007-11-16 Sold (MLS) $50,000 CRMLS
- 2007-10-15 Listing Removed — CRMLS
- 2007-09-17 Listed $59,000 CRMLS
Property tax history
+0.2%/yrLatest (2025): $87 · +2.4% YoY. Source: county tax records.
Cash-flow waterfall
monthlySold comps — $/sqft
last 12 mo · ≤1 miLoading sold comps…