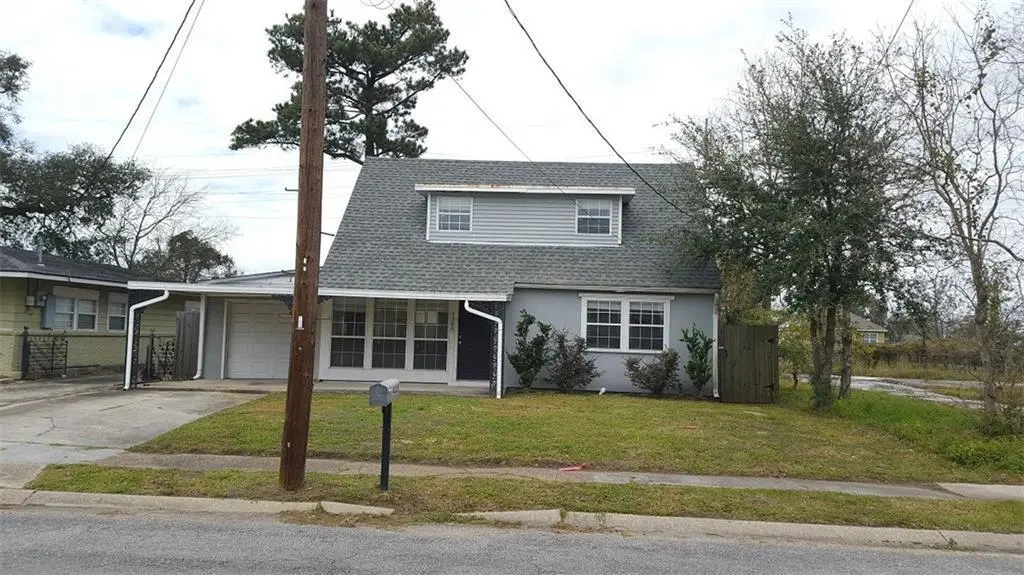
4323 Dreux Ave · New Orleans, LA
Flood risk 8/10 · Major
- FEMA flood zone
- X (shaded)
- Chance of flooding over 30 yrs
- 0.6%
- Est. flood insurance / yr
- $507 – $1,088
Fire risk 1/10 · Minimal
- Est. fire insurance / yr
- $1,269 – $2,357
Heat risk 10/10 · Severe
- Hot days now (above 107°F)
- 7 days/yr
- Hot days in 30 yrs
- 21 days/yr
Wind risk 10/10 · Severe
- Chance of severe wind over 30 yrs
- 99.0%
Air-quality risk 3/10 · Minor
- Unhealthy air days now
- 3 days/yr
- Unhealthy air days in 30 yrs
- 3 days/yr
Risk factors via First Street. Map © Google.
Why this score? — see what drove the B grade
The composite is a weighted blend of 9 inputs, each scored 0–100. Each bar is that input's sub-score; the figure is the points it added to the 100-point composite (weight × sub-score).
- Cash flow +30.0/30.0
- ARV discount +15.0/15.0
- DSCR +10.0/10.0
- 1% rule +7.5/10.0
- Livability +4.0/5.0
- Condition / age +2.5/5.0
- Rent growth +2.4/5.0
- Schools +1.6/10.0
- Appreciation +0.0/10.0
$160,000
🖨 Deal sheet 📄 Offer letter ✓ Due diligence
Listing remarks MLS
SPACIOUS 2-STORY HOME WITH 4 BEDROOMS AND 2 FULL BATHS IN CONVENIENT LOCATION. NICE SIZED LOT AND OFF-STREET PARKING WITH GARAGE. HOMES NEEDS A LITTLE TLC TO BE GREAT AGAIN.
Key facts
- Large bonus room
- Desirable location
- Oversized backyard
Tags
Property features AI
Exterior
- Parking: Garage
- Utilities: Electric service: Entergy
- Home design: Single family residence
- Construction: Construction materials: Other
- Exterior features: Composition roof
Interior
- Kitchen: Kitchen
- Bedrooms: Bedroom 1; Bedroom 2; Bedroom 3; Bedroom 4
- Bathrooms: 2 full bathrooms
- Heating & cooling: Window unit cooling; Has heating (type: Other)
- Interior features: Living room; Dining room; Den
Neighborhood map
What this means for you Summary
Snapshot
- This is a 4-bed/2.0-bath single-family listed at $160k.
Deal economics
- At list price, monthly cash flow is $550 ($7k/yr) — positive.
- The deal already cash-flows at list — no discount required.
- Meets the 1% rule at list price ($2k rent vs $160k).
- Cap rate 10.9% vs local median 4.4% in New Orleans — top-decile yield for the area; either an underpriced asset or a hidden risk that comps aren't pricing in. Stress-test before assuming the spread holds.
Location & tenants
- Location reads 81/100 on livability (#3 in LA, #1,383 nationally) — a professional / high-income tenant draw. Strengths: amenities A+, commute A+, health & safety A+; Watch: crime C-, employment D.
- Orleans Parish (urban): math 11% / reading 27% proficiency, ranked #69 of 98 in LA (top 70%) — low school quality limits family demand, transient renter base, plan for 1-2y turnover; 68% free/reduced lunch — lower-income household profile, screen leases tightly.
- Market conditions: Rents soft (-0.2%/yr); 224 active listings in the ZIP; 35 comparable units currently listed for rent nearby; rentals at typical pace (median 24d on market — plan ~3-4 weeks tenant-placement turnaround); lower-income renter base — watch delinquency; 710 units permitted in Orleans Parish in 2024 (244 in 5+ unit buildings).
- At $2,008/mo this rent would consume 58% of the median local household income ($42k/yr) (locally 1767% of renters already pay >50% of income on rent) — very limited rent-growth headroom before tenants either downsize or default.
Forward outlook
- Local home prices are declining (-3.0%/yr); year-one equity from $1k of loan paydown is wiped out by about $5k of value loss. Plan a longer hold.
- Orleans County population projected at +61% by 2050 — long-run rental-demand tailwind backs the buy-and-hold thesis.
Negotiation context
- Only 3 days on market — expect competitive offers; lowballing is unlikely to land.
- 12 sale attempts since 19y ago with the ask held roughly flat each time — persistent listings suggest the price (not the market) is what's stuck; bring a comps-based counter.
- Current owner paid $103k; list at $160k implies a 55% gain — meaningful room to come down on a strong offer.
Risks & watch-outs
- Watch-outs: flood insurance adds $66/mo.
- Climate carrying-cost: severe flood risk; severe wind risk, 99% chance of damaging wind over 30y; extreme-heat days projected 7→21/yr by 2055 (HVAC capex compounding) — expect insurance premiums to compound above CPI over the hold.
Questions for the listing agent
- Built in 1966 — when were the roof, HVAC, electrical panel, plumbing, and water heater last replaced?
- What's the actual annual flood-insurance premium (NFIP or private), and is the property in a SFHA with mandatory coverage?
- Is there a deadline driving the sale (1031 exchange, divorce, estate, relocation)? That informs how much negotiation room exists.
- What's the average days-on-market for RENTAL listings here right now (not sales)? A rising rental-DOM trend means longer vacancies and softer asking-rent achievability than the comps imply.
- What's the recent tenant-quality profile in this submarket — average credit score on applications, eviction rate, late-payment / NSF rate, and stable-employment percentage? A property-management company in the area should have these aggregated.
- How much new for-sale + rental construction is in the pipeline within 1–3 miles? Heavy new supply typically softens prices + rents 12–24 months out; constrained supply supports both.
Investment metrics
- 1% rule
- 1.25% ✓
- Cap rate
- 10.92%
- Cash-on-cash
- 16.51%
- DSCR
- 1.73
- GRM
- 6.6
CMA / ARV
- ARV (on-the-fly)
- $245,403
- Comps found
- 12
Show comp detail 12 sales within ~0.75 mi
| Address | Dist | Beds/Ba | Sqft | Sold | Price | $/sf | Match |
|---|---|---|---|---|---|---|---|
| 5134 Gallier Dr | 0.34mi | 3/2.0 (-1) | 1,659 (+1%) | 2mo | $275,000 | $166 | 76 |
| 4647 Dreux Ave | 0.22mi | 3/2.5 (-1) | 1,724 (+5%) | 5mo | $307,500 | $178 | 71 |
| 4318 Mendez St | 0.17mi | 3/2.0 (-1) | 1,508 (-8%) | 3mo | $60,000 | $40 | 71 |
| 5145 Lafaye St | 0.49mi | 4/3.0 | 1,616 (-2%) | 2mo | $321,000 | $199 | 68 |
| 4571 Feliciana Dr | 0.43mi | 3/2.0 (-1) | 1,571 (-5%) | 1mo | $195,000 | $124 | 66 |
| 4978 Kendall Dr | 0.17mi | 3/2.0 (-1) | 1,450 (-12%) | 1mo | $205,000 | $141 | 66 |
| 5917 Campus . Blvd | 0.49mi | 3/2.0 (-1) | 1,518 (-8%) | 1mo | $170,000 | $112 | 58 |
| 4462 Eastern St | 0.69mi | 4/2.5 | 1,582 (-4%) | 2mo | $235,000 | $149 | 58 |
| 6128 Campus Blvd | 0.63mi | 3/2.0 (-1) | 1,760 (+7%) | 3mo | $314,000 | $178 | 52 |
| 5757 Campus Blvd | 0.42mi | 3/2.5 (-1) | 1,853 (+12%) | 5mo | $265,000 | $143 | 49 |
| 4759 Pauline Dr | 0.63mi | 4/2.0 | 1,867 (+13%) | 2mo | $255,000 | $137 | 47 |
| 5919 Pauline St | 0.68mi | 3/2.5 (-1) | 1,887 (+15%) | 4mo | $350,000 | $185 | 34 |
Match score weights: distance 35% · size 25% · config 20% · recency 20%. Top-matched comps best support the ARV.
Projected returns pro-forma
-3.0% appreciation · 0.0% rent growth · sell at horizon
- IRR
- 1.9%
- Equity multiple
- 1.07×
- Total profit
- $3,196
- Equity at exit
- $23,857
- IRR
- 8.5%
- Equity multiple
- 1.56×
- Total profit
- $25,086
- Equity at exit
- $13,834
Cash invested: $44,800 (down + closing). Projections, not guarantees.
Landlord ↔ Tenant lean methodology
- Overall (STATE)
- 90 Strongly Landlord-Friendly
- State Louisiana
- 90 Strongly Landlord-Friendly · R+12
- County
- — inherits STATE
- City
- — inherits STATE
ZIP-level market 70126
- Home prices YoY
- -17.0%
- Rents YoY
- -0.2%
- Active inventory
- 224
- Price-to-rent
- 6.6×
Monthly cashflow live
- Estimated rent
- $2,008 high interval (Pro) →
- Mortgage (P&I)
- −$839
- Tax from tax record
- −$64 /mo · $771/yr
- Insurance
- −$67
- Flood insurance flood zone
- −$66 /mo · $798/yr
- HOA
- −$0
- Vacancy / Maint / Mgmt
- −$422
- Net cashflow
- $550
Break-even live
UW: 25.0% down · 7.5% · 30yr · 1.5% tax · 5.0% vac · 8.0% maint · 8.0% mgmt
Financing live
Cash to close
- Down payment
- $40,000
- Closing costs
- $4,800
- Reserves months
- —
- Total cash needed
- —
Loan-product check · same deal, 3 products live
Conventional
25% down · 7.5% · 30yr
- Down + closing
- —
- Monthly P&I
- —
- Monthly cashflow
- —
- DSCR
- —
- Eligible?
- —
Personal DTI + credit; lowest rate.
DSCR
20% down · 8.5% · 30yr
- Down + closing
- —
- Monthly P&I
- —
- Monthly cashflow
- —
- DSCR
- —
- Eligible?
- —
No personal income docs; deal must DSCR.
Hard money
10% down · 12.0% · 12mo
- Down + closing
- —
- Monthly P&I
- —
- Monthly cashflow
- —
- DSCR
- —
- Eligible?
- —
Short-term bridge; refi at stabilization.
Rent comps 35 comps
| Address | Beds | Baths | Sqft | Rent | $/sqft | DOM | Units | Dist |
|---|---|---|---|---|---|---|---|---|
| 5550 Press Dr New Orleans, LA | 3.0 | 2.0 | 1640 | $2,000 | $1.22 | 16d | 1 | 0.22mi |
| 4722 Mithra St New Orleans, LA | 3.0 | 1.5 | 1295 | $1,600 | $1.24 | 23d | 1 | 0.30mi |
| 4936 Baccich St New Orleans, LA | 3.0 | 1.0 | 1053 | $1,700 | $1.61 | 23d | 1 | 0.52mi |
| 4767 Lafaye St New Orleans, LA | 3.0 | 2.0 | 1469 | $2,000 | $1.36 | 23d | 1 | 0.59mi |
| 5747 Pauline Dr New Orleans, LA | 3.0 | 1.0 | 1300 | $1,400 | $1.08 | 11d | 1 | 0.60mi |
| 5925 Pauline Dr New Orleans, LA | 3.0 | 2.0 | 1566 | $2,325 | $1.48 | 16d | 1 | 0.67mi |
| 5172 Venus St Unit 5172 New Orleans, LA | 3.0 | 2.5 | 1864 | $2,450 | $1.31 | 23d | 1 | 0.69mi |
| 2458 Athis St New Orleans, LA | 4.0 | 2.0 | 1530 | $2,200 | $1.44 | 23d | 1 | 0.84mi |
| 6416 Baccich St New Orleans, LA | 3.0 | 2.0 | 1908 | $2,500 | $1.31 | 43d | 1 | 0.91mi |
| 6530 Peoples Ave New Orleans, LA | 3.0 | 2.0 | 1200 | $1,800 | $1.50 | 23d | 1 | 0.97mi |
| 5519 Mandeville St New Orleans, LA | 3.0 | 1.0 | 1125 | $1,650 | $1.47 | 3d | 1 | 1.02mi |
| 2701 03 Frankfort St New Orleans, LA | 3.0 | 1.0 | 1100 | $1,850 | $1.68 | 23d | 1 | 1.13mi |
| 4618 Marigny St New Orleans, LA | 3.0 | 1.0 | 1320 | $1,900 | $1.44 | 23d | 1 | 1.20mi |
| 6329 Spain St New Orleans, LA | 3.0 | 2.0 | 1545 | $2,100 | $1.36 | 16d | 1 | 1.20mi |
| 5920 Boeing St New Orleans, LA | 3.0 | 1.5 | 1340 | $1,400 | $1.04 | 23d | 1 | 1.25mi |
| 4441 Cessna Ct New Orleans, LA | 3.0 | 1.5 | 1400 | $1,600 | $1.14 | 23d | 1 | 1.30mi |
| 5718 Vermillion Blvd Unit A New Orleans, LA | 3.0 | 1.0 | 1300 | $2,000 | $1.54 | 23d | 1 | 1.30mi |
| 5723 Pasteur Blvd New Orleans, LA | 3.0 | 2.0 | 1150 | $1,700 | $1.48 | 17d | 1 | 1.33mi |
| 4409 Skyview Dr New Orleans, LA | 4.0 | 2.5 | 1560 | $1,700 | $1.09 | 16d | 1 | 1.34mi |
| 5704 Count Ln New Orleans, LA | 3.0 | 1.5 | 1572 | $1,700 | $1.08 | 23d | 1 | 1.34mi |
| 2647 Myrtle St Unit 2647 New Orleans, LA | 4.0 | 2.0 | 1445 | $2,550 | $1.76 | 43d | 1 | 1.34mi |
| 5546 Pasteur Blvd Unit A New Orleans, LA | 3.0 | 1.0 | 1200 | $1,400 | $1.17 | 23d | 1 | 1.35mi |
| 7702 Belcrest Pl New Orleans, LA | 3.0 | 1.5 | 1150 | $1,650 | $1.43 | 23d | 1 | 1.36mi |
| 6009 Pasteur Blvd New Orleans, LA | 3.0 | 2.0 | 1250 | $1,785 | $1.43 | 23d | 1 | 1.37mi |
| 4722 Shalimar Dr New Orleans, LA | 3.0 | 2.0 | 1157 | $1,400 | $1.21 | 23d | 1 | 1.40mi |
| 4522 Shalimar Dr New Orleans, LA | 3.0 | 2.0 | 1350 | $1,850 | $1.37 | 23d | 1 | 1.40mi |
| 2646 Elder St New Orleans, LA | 3.0 | 3.0 | 1284 | $2,200 | $1.71 | 17d | 1 | 1.41mi |
| 6010 Pasteur Blvd New Orleans, LA | 4.0 | 3.0 | 2010 | $2,600 | $1.29 | 17d | 1 | 1.41mi |
| 2644 Elder St New Orleans, LA | 3.0 | 3.0 | 1284 | $2,200 | $1.71 | 17d | 1 | 1.41mi |
| 6202 Vermillion Blvd New Orleans, LA | 3.0 | 2.0 | 1200 | $1,700 | $1.42 | 16d | 1 | 1.41mi |
| 4527 Shalimar Dr New Orleans, LA | 3.0 | 1.5 | 1174 | $1,550 | $1.32 | 23d | 1 | 1.42mi |
| 5151 Saint Anthony Ave New Orleans, LA | 3.0 | 2.0 | 1200 | $1,795 | $1.50 | 16d | 1 | 1.43mi |
| 2739 Bay St Unit B New Orleans, LA | 4.0 | 2.0 | 1400 | $1,800 | $1.29 | 20d | 1 | 1.46mi |
| 5322 Saint Anthony Ave New Orleans, LA | 3.0 | 2.0 | 1192 | $2,000 | $1.68 | 16d | 1 | 1.47mi |
| 6217 Curie St New Orleans, LA | 3.0 | 2.0 | 1700 | $1,500 | $0.88 | 23d | 1 | 1.49mi |
Listing history 6 events
-
2026-06-18days on market $160,000 Active 3 DOM
-
2026-06-17days on market $160,000 Active 2 DOM
-
2026-06-16days on market $160,000 Active 1 DOM
-
2026-06-15days on market $160,000 Active 2 DOM
-
2026-06-13remarks 397-char remark
-
2026-06-13$160,000 Active 1 DOM
ⓘ Source: listings_history table (triggers on properties + properties_extension) + one-shot
backfill from property_details.listing_events for pre-trigger history.
Tax reassessment forecast LA · Resets to sale price
- Current annual tax
- $771 · $64/mo
- Projected year-2 tax
- $880 · $73/mo
- Expected delta
- +$109/yr (+$9/mo · 14.1%)
ⓘ Screening estimate from a state-policy table — verify with the county assessor before closing.
Climate risk First Street
- Flood 8/10 Severe FEMA zone X (shaded) · 60% chance over 30 yrs
- Wildfire 1/10 Low
- Heat 10/10 Extreme 7 d/yr ≥107°F today · 21 d/yr by 30 yrs out
- Wind 10/10 Extreme 99% chance of damaging wind over 30 yrs
- Air quality 3/10 Moderate 3 unhealthy d/yr today · 3 by 30 yrs out
Nearby sold comps map
Loading sold comps map…
Walkable amenities ~0.75 mi
Loading nearby amenities…
Taxation est. · year 1
- Rental income
- $24,096
- − Mortgage interest
- −$8,962
- − Property taxes
- −$771
- − Insurance
- −$1,598
- − Repairs & maintenance
- −$1,928
- − Management
- −$1,928
- − Depreciation
- −$4,655
- Taxable income
- $4,255
- Est. tax owed @ 24.0%
- −$1,021
- After-tax cash flow
- $5,577/yr
For passive investors: Depreciation is non-cash, so a rental often shows a tax loss while cash-flowing — sheltering income. Rental losses are passive: they offset passive income freely, and up to $25,000/yr can offset ordinary (W-2) income if you actively participate and your MAGI is under $100k (phasing out to $0 by $150k); unused losses carry forward. On sale, claimed depreciation is recaptured at up to 25%, and gains may owe capital-gains tax (a 1031 exchange can defer both). Figures are a year-1 estimate at your 24.0% rate — not tax advice; consult a CPA.
Schools (NCES district)
- District
- Orleans Parish
- NCES district ID
- 2201170
- Math proficiency
- 11% ▼ -52.00%
- Reading proficiency
- 27% ▼ -46.00%
- Median HH income
- $37,011
- Composite
- 15.78/100
- National rank
- #9271
- State rank
- #69 of 98 in LA
Livability — New Orleans
- Score
- 81/100
- State rank
- #3
- US rank
- #1383
Category grades
Schools grade is shown separately in the Schools card above.
Census & demographics
- Census place
- New Orleans, LA
- County
- Orleans Parish · 338,817 people
- City population
- 338,817
- Metro
- New Orleans-Metairie, LA
- Population (ZIP)
- 27,047
- Household income
- $41,709
- Rent vs Own
- Severe rent burden
- 1767.0
Population outlook (Orleans County) Hauer SSP2
- Today (2025)
- 513,025 people
- By 2030
- 575,781 · +12.2%
- By 2040
- 700,174 · +36.5%
- By 2050
- 826,541 · +61.1%
- By 2075
- 1,123,374 · +119.0%
- By 2100
- 1,355,609 · +164.2%
Race, ethnicity, and origin ACS 2023
- Neighborhood character
- Predominantly Black (85%)
- Race & ethnicity
- Black 85% Hispanic / Latino 6% Two or more races 5% White 5%
- Hispanic origin (detail)
- Common ancestry
- Lithuanian 1% Italian 1%
- Foreign-born
- 4% · Canada, Vietnam
- Languages at home
- 94% English-only · Spanish 5% Other Indo-European 1%
Political lean MEDSL · Orleans
- 2024 margin
- Solid D (+67.0) · D 82.2% · R 15.2% · Other 2.7%
- 2008→2024 swing
- +6.7pp toward D · 2008: 60.3pp · 2024: 67.0pp
- All cycles
- 2024: D+67.0 2020: D+68.2 2016: D+66.2 2012: D+62.5 2008: D+60.3
Not yet ingested
- Civics
- —
Market trends
- HPI YoY
- ▼ -36.35%
- Current HPI
- 177.355
- Rent YoY
- ▼ -0.24%
- Metro
- New Orleans-Metairie, LA
- State GDP YoY
- ▲ 3.29%
- F500 in state
- 10
Industry mix (Fortune 500 HQ in LA)
| Industry | F500 HQs | Revenue |
|---|---|---|
| Telecommunications | 2 | $23B |
|
||
| Utilities | 1 | $12B |
|
||
| Wholesale / Distribution | 1 | $5B |
|
||
| Advertising | 1 | $2B |
|
||
Price history
+171.2% since first listed22 events — show timeline
- 2026-06-12 Listed $160,000 AcadianaMLS
- 2016-04-22 Sold (MLS) $103,000 GSREIN
- 2016-03-10 Pending — GSREIN
- 2016-03-03 Contingent — GSREIN
- 2016-03-02 Listed $103,000 GSREIN
- 2016-03-02 Listed $103,000 AcadianaMLS
- 2016-03-02 Listing Removed — GSREIN
- 2016-03-01 Relisted — GSREIN
- 2016-02-23 Contingent — GSREIN
- 2016-02-01 Listed $103,000 GSREIN
- 2016-02-01 Listed $103,000 AcadianaMLS
- 2015-11-20 Listing Removed — GSREIN
- 2015-07-24 Price Changed $132,900 GSREIN
- 2015-06-29 Listed $140,000 GSREIN
- 2015-06-29 Listed $132,900 AcadianaMLS
- 2008-07-29 Sold (MLS) $132,000 GSREIN
- 2008-04-09 Listed $139,900 AcadianaMLS
- 2008-04-09 Listed $139,900 GSREIN
- 2008-04-08 Sold (Public Records) $38,000 Public Records
- 2008-04-04 Sold (MLS) $38,000 GSREIN
- 2007-08-02 Listed $59,000 GSREIN
- 2007-08-02 Listed $59,000 AcadianaMLS
Property tax history
-1.0%/yrLatest (2026): $771 · -7.5% YoY. Source: county tax records.
Cash-flow waterfall
monthlySold comps — $/sqft
last 12 mo · ≤1 miLoading sold comps…