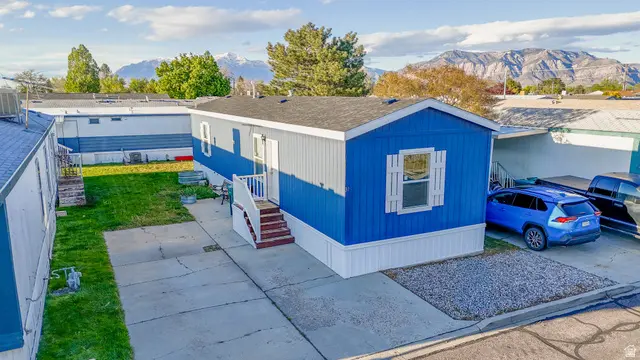
3980 S 1950 W #31 · Roy, UT
Flood risk No data
- FEMA flood zone
- —
- Chance of flooding over 30 yrs
- —
- Est. flood insurance / yr
- —
Fire risk No data
- Est. fire insurance / yr
- —
Heat risk No data
- Hot days now (above threshold)
- —
- Hot days in 30 yrs
- —
Wind risk No data
- Chance of severe wind over 30 yrs
- —
Air-quality risk No data
- Unhealthy air days now
- —
- Unhealthy air days in 30 yrs
- —
Risk factors via First Street. Map © Google.
Why this score? — see what drove the B grade
The composite is a weighted blend of 9 inputs, each scored 0–100. Each bar is that input's sub-score; the figure is the points it added to the 100-point composite (weight × sub-score).
- Cash flow +30.0/30.0
- 1% rule +10.0/10.0
- DSCR +10.0/10.0
- ARV discount +7.5/15.0
- Livability +4.0/5.0
- Condition / age +4.0/5.0
- Schools +3.2/10.0
- Rent growth +2.4/5.0
- Appreciation +0.0/10.0
$84,900
🖨 Deal sheet (PDF) 📄 Offer letter ✓ Due diligence
Listing remarks
Clean and well-maintained 2 bed, 2 bath home in a quiet Roy community. Functional layout with spacious living area and private primary suite. Conveniently located near parks, shopping, dining, Hill Air Force Base, and easy freeway access. Affordable, low-maintenance living-great opportunity!
Key facts
- Near dining
- Near shopping
- Spacious living area
Tags
Property features AI
Exterior
- Utilities: Natural gas connected; Electricity connected; Sewer connected; Water connected ( culinary )
- Home design: Mobile home; Built and currently standing
- Construction: Asphalt construction materials; Slab foundation
- Exterior features: Asphalt roof; Residential lot of about 0.1 acre
Interior
- Kitchen: Microwave; Refrigerator
- Bedrooms: 2 bedrooms on the main level
- Flooring: Carpet; Linoleum
- Bathrooms: 2 full bathrooms
- Heating & cooling: Forced air heating; Central air conditioning
- Interior features: Fire alarm
Neighborhood map
What this means for you Summary
Snapshot
- This is a 2-bed/2.0-bath manufactured listed at $85k. Condition is rated good.
Deal economics
- At list price, monthly cash flow is $543 ($7k/yr) — positive.
- The deal already cash-flows at list — no discount required.
- Meets the 1% rule at list price ($1k rent vs $85k).
- Recommended offer: $82k (3.0% below list) — sets the bar for market timing.
Location & tenants
- Location reads 81/100 on livability (#32 in UT, #1,449 nationally) — a professional / high-income tenant draw. Strengths: housing A+, health & safety A+, commute A; Watch: amenities F.
- Weber District (suburban): math 36% / reading 35% proficiency, ranked #56 of 80 in UT (top 70%) — families likely to look elsewhere, expect single-tenant / working-renter base with shorter leases.
- Zoned schools: North Park School (math 32% / reading 32%, grade F, #419 of 585 statewide, top 72%, 467 students, 50% FRL); Sand Ridge Jr High (math 26% / reading 26%, grade F, #119 of 138 statewide, top 87%, 857 students, 40% FRL); Roy High (math 15% / reading 39%, grade F, #131 of 171 statewide, top 79%, 1,834 students, 28% FRL).
- Market conditions: Rents soft (-0.5%/yr); 203 active listings in the ZIP; 14 comparable units currently listed for rent nearby; rentals at typical pace (median 15d on market — plan ~3-4 weeks tenant-placement turnaround); solid renter incomes; 1,630 units permitted in Weber County in 2024 (521 in 5+ unit buildings).
Forward outlook
- Local home prices are declining (-3.0%/yr); year-one equity from $587 of loan paydown is wiped out by about $3k of value loss. Plan a longer hold.
- Weber County population projected at +24% by 2050 — long-run rental-demand tailwind backs the buy-and-hold thesis.
- At projected returns (-3.0% appreciation + 0.0% rent growth), your $24k cash investment doubles in ~6 years — after that, you're playing with house money.
Negotiation context
- It's been on market 48 days — a 3% lower offer ($82k) is reasonable based on typical stale-listing flexibility.
Questions for the listing agent
- It's been on market 48 days. Have you received any prior offers? Is the seller open to a 3% concession, seller financing, or rate buy-down credit?
- Is there a deadline driving the sale (1031 exchange, divorce, estate, relocation)? That informs how much negotiation room exists.
- Schools are D-rated, which usually means shorter tenancies and higher turnover. Who's the typical renter profile here, and what's been the actual vacancy rate?
- What's the average days-on-market for RENTAL listings here right now (not sales)? A rising rental-DOM trend means longer vacancies and softer asking-rent achievability than the comps imply.
- What's the recent tenant-quality profile in this submarket — average credit score on applications, eviction rate, late-payment / NSF rate, and stable-employment percentage? A property-management company in the area should have these aggregated.
- How much new for-sale + rental construction is in the pipeline within 1–3 miles? Heavy new supply typically softens prices + rents 12–24 months out; constrained supply supports both.
Investment metrics
- 1% rule
- 1.68% ✓
- Cap rate
- 13.97%
- Cash-on-cash
- 27.43%
- DSCR
- 2.22
- GRM
- 4.9
CMA / ARV
No comps found within radius.
Projected returns pro-forma
-3.0% appreciation · 0.0% rent growth · sell at horizon
- IRR
- 18.0%
- Equity multiple
- 1.70×
- Total profit
- $16,675
- Equity at exit
- $12,659
- IRR
- 24.2%
- Equity multiple
- 2.81×
- Total profit
- $42,965
- Equity at exit
- $7,341
Cash invested: $23,772 (down + closing). Projections, not guarantees.
Landlord ↔ Tenant lean methodology
- Overall (STATE)
- 86 Strongly Landlord-Friendly
- State Utah
- 86 Strongly Landlord-Friendly · R+15
- County
- — inherits STATE
- City
- — inherits STATE
ZIP-level market 84067
- Rents YoY
- -0.5%
- Active inventory
- 203
- Price-to-rent
- 4.9×
Monthly cashflow live
- Estimated rent
- $1,430 high interval (Pro) →
- Mortgage (P&I)
- −$445
- Tax est. 1.5%
- −$106 /mo · $1,274/yr
- Insurance
- −$35
- HOA
- −$0
- Vacancy / Maint / Mgmt
- −$300
- Net cashflow
- $543
Break-even live
Sensitivity live
| Price | -10% $602 | -5% $573 | +0% $543 | +5% $514 | +10% $485 |
|---|---|---|---|---|---|
| Rent | -10% $430 | -5% $487 | +0% $543 | +5% $600 | +10% $656 |
| Rate | -1.0pp $586 | -0.5pp $565 | base $543 | +0.5pp $521 | +1.0pp $499 |
UW: 25.0% down · 7.5% · 30yr · 1.5% tax · 5.0% vac · 8.0% maint · 8.0% mgmt
Financing live
Cash to close
- Down payment
- $21,225
- Closing costs
- $2,547
- Reserves months
- —
- Total cash needed
- —
Loan-product check · same deal, 3 products live
Conventional
25% down · 7.5% · 30yr
- Down + closing
- —
- Monthly P&I
- —
- Monthly cashflow
- —
- DSCR
- —
- Eligible?
- —
Personal DTI + credit; lowest rate.
DSCR
20% down · 8.5% · 30yr
- Down + closing
- —
- Monthly P&I
- —
- Monthly cashflow
- —
- DSCR
- —
- Eligible?
- —
No personal income docs; deal must DSCR.
Hard money
10% down · 12.0% · 12mo
- Down + closing
- —
- Monthly P&I
- —
- Monthly cashflow
- —
- DSCR
- —
- Eligible?
- —
Short-term bridge; refi at stabilization.
Rent comps 14 comps
| Address | Beds | Baths | Sqft | Rent | $/sqft | DOM | Units | Dist |
|---|---|---|---|---|---|---|---|---|
| 4449 S 1900 W Roy, UT | 2.0 | 1.0 | 620 | $999 | $1.61 | 15d | 3 | 0.59mi |
| 4449 S 1900 W Unit 4 Roy, UT | 2.0 | 1.0 | 900 | $999 | $1.11 | 24d | 1 | 0.59mi |
| 2405 Hinckley Dr Unit L203 West Haven, UT | 2.0 | 2.0 | 988 | $1,416 | $1.43 | 24d | 1 | 0.61mi |
| 4499 S 1930 W Roy, UT | 1.0–3.0 | 1.0–2.5 | 1106 | $1,930 | $1.75 | 15d | 11 | 0.67mi |
| 3560 Midland Dr West Haven, UT | 1.0–3.0 | 1.0–2.0 | 932 | $1,437 | $1.54 | 15d | 22 | 0.81mi |
| 2002 W 4700 S Apt 2 Roy, UT | 2.0 | 1.0 | 837 | $1,185 | $1.42 | 24d | 1 | 0.88mi |
| 3330 S Midland Dr West Haven, UT | 1.0–3.0 | 1.0–2.5 | 1000 | $1,500 | $1.50 | 15d | 3 | 0.92mi |
| 90 West Roy, UT | 1.0–3.0 | 1.0–2.0 | 1075 | $1,445 | $1.34 | 15d | 11 | 0.94mi |
| 3405 S 2400 W West Haven, UT | 1.0–3.0 | 1.0–2.0 | 978 | $1,525 | $1.56 | 24d | 5 | 0.94mi |
| 2112 W 3300 S West Haven, UT | 1.0–3.0 | 1.0–2.0 | 975 | $1,686 | $1.73 | 15d | 15 | 1.06mi |
| 1775 W 4800 S Roy, UT | 1.0–2.0 | 1.0 | 770 | $1,250 | $1.62 | 15d | 4 | 1.13mi |
| 1184 W 4400 S Riverdale, UT | 2.0 | 1.0 | 864 | $1,299 | $1.50 | 15d | 3 | 1.13mi |
| 1551 W Riverdale Rd Unit J12 Ogden, UT | 2.0 | 1.0 | 803 | $1,450 | $1.81 | 24d | 1 | 1.48mi |
| 5197 S 1900 W Unit A Roy, UT | 2.0 | 1.0 | 1100 | $1,300 | $1.18 | 24d | 1 | 1.49mi |
Listing history 16 events
-
2026-06-18days on market $84,900 Active 48 DOM
-
2026-06-17days on market $84,900 Active 47 DOM
-
2026-06-16days on market $84,900 Active 46 DOM
-
2026-06-15days on market $84,900 Active 45 DOM
-
2026-06-14days on market $84,900 Active 43 DOM
-
2026-06-10pricedays on market $84,900 Active 40 DOM
-
2026-06-09days on market $93,000 Active 39 DOM
-
2026-06-08days on market $93,000 Active 38 DOM
-
2026-06-07days on market $93,000 Active 37 DOM
-
2026-06-05days on market $93,000 Active 34 DOM
-
2026-06-03days on market $93,000 Active 33 DOM
-
2026-06-02days on market $93,000 Active 32 DOM
-
2026-06-01days on market $93,000 Active 31 DOM
-
2026-05-31days on market $93,000 Active 30 DOM
-
2026-05-31days on market $93,000 Active 29 DOM
-
2026-05-01$93,000 Active
ⓘ Source: listings_history table (triggers on properties + properties_extension) + one-shot
backfill from property_details.listing_events for pre-trigger history.
Nearby sold comps map
Loading sold comps map…
Walkable amenities ~0.75 mi
Loading nearby amenities…
Taxation est. · year 1
- Rental income
- $17,165
- − Mortgage interest
- −$4,756
- − Property taxes
- −$1,274
- − Insurance
- −$424
- − Repairs & maintenance
- −$1,373
- − Management
- −$1,373
- − Depreciation
- −$2,470
- Taxable income
- $5,495
- Est. tax owed @ 24.0%
- −$1,319
- After-tax cash flow
- $5,201/yr
For passive investors: Depreciation is non-cash, so a rental often shows a tax loss while cash-flowing — sheltering income. Rental losses are passive: they offset passive income freely, and up to $25,000/yr can offset ordinary (W-2) income if you actively participate and your MAGI is under $100k (phasing out to $0 by $150k); unused losses carry forward. On sale, claimed depreciation is recaptured at up to 25%, and gains may owe capital-gains tax (a 1031 exchange can defer both). Figures are a year-1 estimate at your 24.0% rate — not tax advice; consult a CPA.
Condition & rehab AI · 12 photos
This well-maintained and updated manufactured home in Roy, UT offers a good investment opportunity with minimal repairs needed.
Value-add opportunities
- Both Paint exterior trim — Enhances curb appeal and value
- Both Replace carpet in bedrooms — Fresh carpet improves comfort and value
Renovation cost estimate screening
Value-add ROI direction
- Both Paint exterior trim — Enhances curb appeal and value ↑
- Both Replace carpet in bedrooms — Fresh carpet improves comfort and value ↑
ⓘ Cost ranges are severity-bucket heuristics (US national rule-of-thumb). Get contractor quotes + a written scope before underwriting a rehab budget.
Schools (NCES district)
- District
- Weber District
- NCES district ID
- 4901200
- Math proficiency
- 36% ▼ -4.00%
- Reading proficiency
- 35% ▼ -5.00%
- Median HH income
- $65,750
- Composite
- 32.28/100
- National rank
- #5757
- State rank
- #56 of 80 in UT
Livability — Roy
- Score
- 81/100
- State rank
- #32
- US rank
- #1449
Category grades
Schools grade is shown separately in the Schools card above.
Census & demographics
- Census place
- Roy, UT
- County
- Weber County · 260,557 people
- City population
- 38,794
- Metro
- Ogden-Clearfield, UT
- Population (ZIP)
- 38,794
- Household income
- $91,115
- Rent vs Own
- Severe rent burden
- 216.0
Population outlook (Weber County) Hauer SSP2
- Today (2025)
- 274,329 people
- By 2030
- 288,577 · +5.2%
- By 2040
- 314,848 · +14.8%
- By 2050
- 338,710 · +23.5%
- By 2075
- 384,412 · +40.1%
- By 2100
- 409,305 · +49.2%
Race, ethnicity, and origin ACS 2023
- Neighborhood character
- Predominantly White (73%)
- Race & ethnicity
- White 73% Hispanic / Latino 19% Two or more races 8% Asian 2%
- Hispanic origin (detail)
- Mexican 14%
- Common ancestry
- Slovak 4% Italian 4% Portuguese 3%
- Foreign-born
- 6% · Canada
- Languages at home
- 86% English-only · Spanish 11% Other Asian/Pacific 1% Tagalog/Filipino 1%
Political lean MEDSL · Weber
- 2024 margin
- Strong R (+23.5) · D 36.8% · R 60.3% · Other 2.9%
- 2008→2024 swing
- +4.1pp toward D · 2008: -27.6pp · 2024: -23.5pp
- All cycles
- 2024: R+23.5 2020: R+22.7 2016: R+20.0 2012: R+46.0 2008: R+27.6
Not yet ingested
- Civics
- —
Market trends
- HPI YoY
- ▼ -284.84%
- Current HPI
- 323.642
- Rent YoY
- ▼ -0.45%
- Metro
- Ogden-Clearfield, UT
- State GDP YoY
- ▲ 3.54%
- F500 in state
- 2
Industry mix (Fortune 500 HQ in UT)
| Industry | F500 HQs | Revenue |
|---|---|---|
| Financial Services | 1 | $3B |
|
||
Price history
1 event — show timeline
- 2026-05-01 Listed $93,000 WFRMLS
Cash-flow waterfall
monthlySold comps — $/sqft
last 12 mo · ≤1 miLoading sold comps…