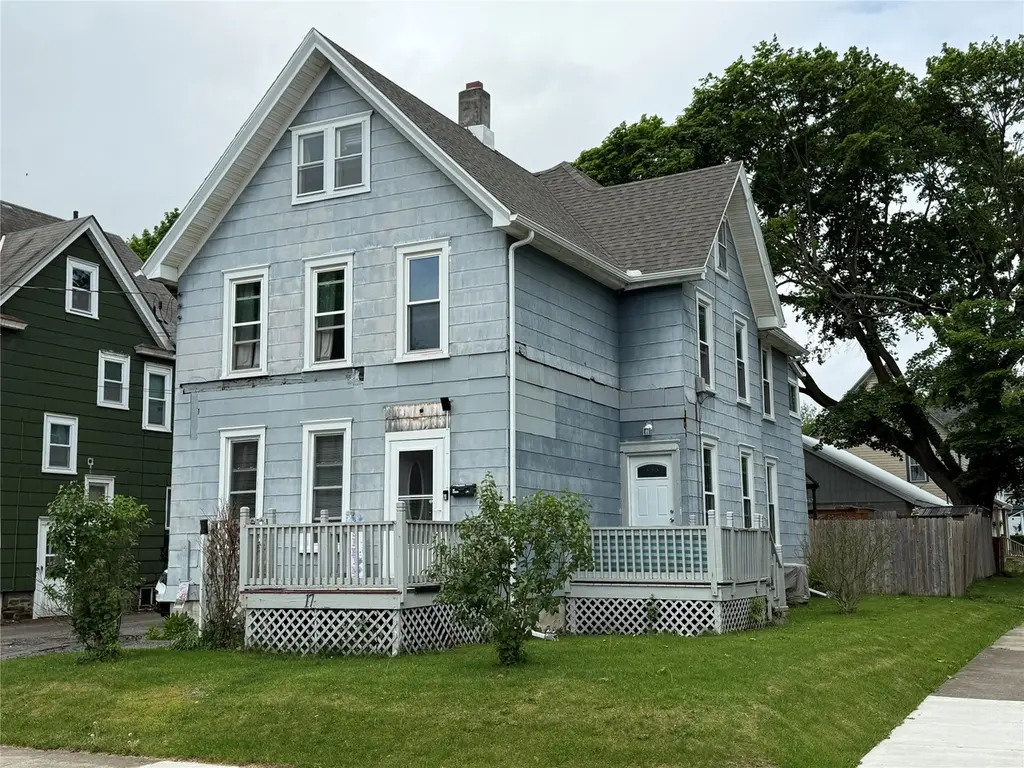
17 Howard Ave · Binghamton, NY
Flood risk 6/10 · Moderate
- FEMA flood zone
- X (shaded)
- Chance of flooding over 30 yrs
- 0.53%
- Est. flood insurance / yr
- $473 – $860
Fire risk 1/10 · Minimal
- Est. fire insurance / yr
- $691 – $1,283
Heat risk 3/10 · Minor
- Hot days now (above 92°F)
- 8 days/yr
- Hot days in 30 yrs
- 17 days/yr
Wind risk 2/10 · Minimal
- Chance of severe wind over 30 yrs
- 1.0%
Air-quality risk 2/10 · Minimal
- Unhealthy air days now
- 0 days/yr
- Unhealthy air days in 30 yrs
- 1 days/yr
Risk factors via First Street. Map © Google.
Why this score? — see what drove the B+ grade
The composite is a weighted blend of 9 inputs, each scored 0–100. Each bar is that input's sub-score; the figure is the points it added to the 100-point composite (weight × sub-score).
- Cash flow +22.5/30.0
- ARV discount +15.0/15.0
- Appreciation +10.0/10.0
- 1% rule +9.0/10.0
- DSCR +7.2/10.0
- Livability +3.9/5.0
- Schools +3.0/10.0
- Rent growth +2.5/5.0
- Condition / age +2.5/5.0
$150,000
🖨 Deal sheet 📄 Offer letter ✓ Due diligence
Listing remarks
Spacious and versatile 6-bedroom, 2 full bath home situated on a desirable corner lot in a convenient Binghamton location close to shopping, schools, restaurants, parks, and all local amenities. This large single-family home offers plenty of living space and the potential to be converted back into a two-family property for added flexibility or investment opportunity. Features include newer windows, a new roof with lifetime warranty, and a covered deck complete with an awning—perfect for relaxing or entertaining outdoors. Don’t miss this unique opportunity to own a well-maintained property with endless possibilities!
Key facts
- Covered deck
- Retractable awning
- Corner lot
Tags
Property features AI
Exterior
- Parking: Driveway; On-street parking
- Utilities: Public water; Public sewer; Cable available
- Home design: Single-family residence; Two levels
- Construction: Built with other construction materials
- Exterior features: Covered deck/patio; Shed(s); Level lot
Interior
- Flooring: Carpet; Hardwood
- Bathrooms: 2 full bathrooms
- Heating & cooling: Forced air heating
- Interior features: Other interior features (see remarks); Gas water heater
- Laundry & utility: Washer hookup
Neighborhood map
What this means for you Summary
Snapshot
- This is a 4-bed/2.0-bath single-family listed at $150k.
Deal economics
- At list price, monthly cash flow is $251 ($3k/yr) — positive.
- The deal already cash-flows at list — no discount required.
- Meets the 1% rule at list price ($2k rent vs $150k).
- Recommended offer: $148k (1.5% below list) — sets the bar for market timing.
- Cap rate 8.3% vs local median 6.4% in Binghamton — meaningfully above typical; check what's discounted (condition, days-on-market, listing class) to confirm the premium yield is real.
Location & tenants
- Location reads 78/100 on livability (#174 in NY, #2,710 nationally) — a middle-class / working-renter tenant base. Strengths: amenities A+, commute A+, cost of living A+; Watch: crime F, employment F.
- Binghamton City School District (urban): math 30% / reading 44% proficiency, ranked #557 of 590 in NY (top 94%) — families likely to look elsewhere, expect single-tenant / working-renter base with shorter leases; 61% free/reduced lunch — lower-income household profile, screen leases tightly.
- Zoned schools: Calvin Coolidge School (math 27% / reading 37%, grade F, #1,646 of 2,108 statewide, top 80%, 312 students, 72% FRL).
- Market conditions: 41 active listings in the ZIP; 10 comparable units currently listed for rent nearby; rentals at typical pace (median 21d on market — plan ~3-4 weeks tenant-placement turnaround); 40% of comp listings sitting > 30 days — soft ceiling on asking rent; 340 units permitted in Broome County in 2024 (269 in 5+ unit buildings).
Forward outlook
- In year one you build about $16k of equity ($1k loan paydown + $15k appreciation (10.0% local appreciation)).
- Broome County population projected at -13% by 2050 — secular population decline; favor cash flow + early exit over multi-decade hold.
- At projected returns (10.0% appreciation + 3.0% rent growth), your $42k cash investment doubles in ~3 years — after that, you're playing with house money.
- By year 3, paydown + projected appreciation supports a ~$41k cash-out refi (75% LTV) — recoverable capital for the next deal without selling this one.
Negotiation context
- It's been on market 30 days — a 2% lower offer ($148k) is reasonable based on typical stale-listing flexibility.
- Current owner paid $70k; list at $150k implies a 113% gain — meaningful room to come down on a strong offer.
Risks & watch-outs
- Watch-outs: property tax is 4.4% of price; built in 1900 — expect roof / HVAC / electrical / plumbing capex.
- Climate carrying-cost: major flood risk — expect insurance premiums to compound above CPI over the hold.
Questions for the listing agent
- Built in 1900 — when were the roof, HVAC, electrical panel, plumbing, and water heater last replaced?
- Property tax is high relative to price — has the assessment been appealed recently, and will the sale trigger a re-assessment?
- Is there a deadline driving the sale (1031 exchange, divorce, estate, relocation)? That informs how much negotiation room exists.
- Schools are D-rated, which usually means shorter tenancies and higher turnover. Who's the typical renter profile here, and what's been the actual vacancy rate?
- Crime grade is F in this area — have there been break-ins, vandalism, or insurance claims at this property in the last 3 years? What carrier currently insures it and at what premium?
- What's the average days-on-market for RENTAL listings here right now (not sales)? A rising rental-DOM trend means longer vacancies and softer asking-rent achievability than the comps imply.
- What's the recent tenant-quality profile in this submarket — average credit score on applications, eviction rate, late-payment / NSF rate, and stable-employment percentage? A property-management company in the area should have these aggregated.
- How much new for-sale + rental construction is in the pipeline within 1–3 miles? Heavy new supply typically softens prices + rents 12–24 months out; constrained supply supports both.
Investment metrics
- 1% rule
- 1.40% ✓
- Cap rate
- 8.30%
- Cash-on-cash
- 7.18%
- DSCR
- 1.32
- GRM
- 6.0
CMA / ARV
- ARV (on-the-fly)
- $195,510
- Comps found
- 12
Show comp detail 12 sales within ~0.75 mi
| Address | Dist | Beds/Ba | Sqft | Sold | Price | $/sf | Match |
|---|---|---|---|---|---|---|---|
| 17 Bigelow St | 0.20mi | 3/2.0 (-1) | 1,850 (-1%) | 2mo | $169,900 | $92 | 83 |
| 27 Howard Ave | 0.06mi | 3/2.0 (-1) | 1,755 (-6%) | 6mo | $200,000 | $114 | 78 |
| 40 Howard Ave | 0.11mi | 4/1.5 | 1,725 (-7%) | 5mo | $163,000 | $94 | 76 |
| 220 Robinson St | 0.13mi | 4/1.5 | 1,706 (-8%) | 6mo | $90,000 | $53 | 73 |
| 7 Moody ST St | 0.37mi | 3/2.0 (-1) | 1,969 (+6%) | 1mo | $209,000 | $106 | 68 |
| 4 Gray St | 0.47mi | 4/1.5 | 1,758 (-6%) | 4mo | $160,000 | $91 | 64 |
| 20 Bigelow St | 0.23mi | 3/2.0 (-1) | 1,624 (-13%) | 4mo | $170,000 | $105 | 60 |
| 66 Moeller St | 0.30mi | 4/2.0 | 1,596 (-14%) | 3mo | $152,500 | $96 | 60 |
| 14 Broome St | 0.67mi | 3/2.0 (-1) | 1,749 (-6%) | 1mo | $120,000 | $69 | 53 |
| 61 Baldwin St | 0.68mi | 3/2.0 (-1) | 1,695 (-9%) | 3mo | $185,000 | $109 | 46 |
| 19 Monroe St | 0.64mi | 3/1.0 (-1) | 1,656 (-11%) | 1mo | $185,000 | $112 | 42 |
| 20 East St | 0.65mi | 3/2.0 (-1) | 1,596 (-14%) | 5mo | $167,000 | $105 | 37 |
Match score weights: distance 35% · size 25% · config 20% · recency 20%. Top-matched comps best support the ARV.
Projected returns pro-forma
10.0% appreciation · 3.0% rent growth · sell at horizon
- IRR
- 29.6%
- Equity multiple
- 3.33×
- Total profit
- $97,954
- Equity at exit
- $135,132
- IRR
- 25.7%
- Equity multiple
- 7.58×
- Total profit
- $276,384
- Equity at exit
- $291,417
Cash invested: $42,000 (down + closing). Projections, not guarantees.
Landlord ↔ Tenant lean methodology
- Overall (STATE)
- 15 Strongly Tenant-Friendly
- State New York
- 15 Strongly Tenant-Friendly · D+10
- County
- — inherits STATE
- City
- — inherits STATE
ZIP-level market 13904
- Home prices YoY
- 17.1%
- Active inventory
- 41
- Price-to-rent
- 6.0×
Monthly cashflow live
- Estimated rent
- $2,093 high interval (Pro) →
- Mortgage (P&I)
- −$787
- Tax from tax record
- −$553 /mo · $6,642/yr
- Insurance
- −$62
- HOA
- −$0
- Vacancy / Maint / Mgmt
- −$440
- Net cashflow
- $251
Break-even live
UW: 25.0% down · 7.5% · 30yr · 1.5% tax · 5.0% vac · 8.0% maint · 8.0% mgmt
Financing live
Cash to close
- Down payment
- $37,500
- Closing costs
- $4,500
- Reserves months
- —
- Total cash needed
- —
Loan-product check · same deal, 3 products live
Conventional
25% down · 7.5% · 30yr
- Down + closing
- —
- Monthly P&I
- —
- Monthly cashflow
- —
- DSCR
- —
- Eligible?
- —
Personal DTI + credit; lowest rate.
DSCR
20% down · 8.5% · 30yr
- Down + closing
- —
- Monthly P&I
- —
- Monthly cashflow
- —
- DSCR
- —
- Eligible?
- —
No personal income docs; deal must DSCR.
Hard money
10% down · 12.0% · 12mo
- Down + closing
- —
- Monthly P&I
- —
- Monthly cashflow
- —
- DSCR
- —
- Eligible?
- —
Short-term bridge; refi at stabilization.
Rent comps 10 comps
| Address | Beds | Baths | Sqft | Rent | $/sqft | DOM | Units | Dist |
|---|---|---|---|---|---|---|---|---|
| 51 2nd St Binghamton, NY | 3.0 | 2.5 | 2333 | $2,200 | $0.94 | 13d | 1 | 0.85mi |
| 100 Felters Rd Binghamton, NY | 4.0 | 2.5 | 2000 | $2,500 | $1.25 | 44d | 1 | 1.06mi |
| 528 Chenango St Unit 1 Binghamton, NY | 3.0 | 1.0 | 1250 | $1,500 | $1.20 | 13d | 1 | 1.21mi |
| 113 Hawley St Binghamton, NY | 4.0 | 1.5 | 1637 | $2,000 | $1.22 | 44d | 1 | 1.30mi |
| 136 Court St Unit 2 Binghamton, NY | 4.0 | 1.0 | 1373 | $3,000 | $2.18 | 44d | 1 | 1.30mi |
| 8 Roosevelt Ave Binghamton, NY | 3.0 | 1.0 | 1400 | $1,450 | $1.04 | 21d | 1 | 1.33mi |
| 8 Roosevelt Ave Unit 2 Binghamton, NY | 3.0 | 1.0 | 1400 | $1,500 | $1.07 | 44d | 1 | 1.33mi |
| 90 Conklin Ave Binghamton, NY | 5.0 | 2.0 | 2000 | $575 | $0.29 | 13d | 1 | 1.44mi |
| 607 Chenango St Binghamton, NY | 5.0 | 2.5 | 2500 | $2,800 | $1.12 | 13d | 1 | 1.46mi |
| 86 Conklin Ave Binghamton, NY | 3.0 | 1.0 | 1316 | $1,600 | $1.22 | 13d | 1 | 1.47mi |
Listing history 19 events
-
2026-06-19days on market $150,000 Active 30 DOM
-
2026-06-18price $150,000 Active 29 DOM
-
2026-06-18days on market $155,000 Active 29 DOM
-
2026-06-17days on market $155,000 Active 28 DOM
-
2026-06-16days on market $155,000 Active 27 DOM
-
2026-06-15days on market $155,000 Active 26 DOM
-
2026-06-14days on market $155,000 Active 24 DOM
-
2026-06-13days on market $155,000 Active 23 DOM
-
2026-06-10days on market $155,000 Active 21 DOM
-
2026-06-09days on market $155,000 Active 20 DOM
-
2026-06-08days on market $155,000 Active 19 DOM
-
2026-06-07days on market $155,000 Active 18 DOM
-
2026-06-03days on market $155,000 Active 14 DOM
-
2026-06-02days on market $155,000 Active 13 DOM
-
2026-06-01days on market $155,000 Active 12 DOM
-
2026-05-31days on market $155,000 Active 11 DOM
-
2026-05-30days on market $155,000 Active 10 DOM
-
2026-05-20$155,000 Active
-
2004-12-07soldstatus $70,500
ⓘ Source: listings_history table (triggers on properties + properties_extension) + one-shot
backfill from property_details.listing_events for pre-trigger history.
Tax reassessment forecast NY · Partial reset (capped growth)
- Current annual tax
- $6,642 · $553/mo
- Projected year-2 tax
- $6,642 · $553/mo
- Expected delta
- $0/yr ($0/mo · 0.0%)
ⓘ Screening estimate from a state-policy table — verify with the county assessor before closing.
Climate risk First Street
- Flood 6/10 Major FEMA zone X (shaded) · 53% chance over 30 yrs
- Wildfire 1/10 Low
- Heat 3/10 Moderate 8 d/yr ≥92°F today · 17 d/yr by 30 yrs out
- Wind 2/10 Low 100% chance of damaging wind over 30 yrs
- Air quality 2/10 Low 0 unhealthy d/yr today · 1 by 30 yrs out
Nearby sold comps map
Loading sold comps map…
Walkable amenities ~0.75 mi
Loading nearby amenities…
Taxation est. · year 1
- Rental income
- $25,122
- − Mortgage interest
- −$8,402
- − Property taxes
- −$6,642
- − Insurance
- −$750
- − Repairs & maintenance
- −$2,010
- − Management
- −$2,010
- − Depreciation
- −$4,364
- Taxable income
- $945
- Est. tax owed @ 24.0%
- −$227
- After-tax cash flow
- $2,789/yr
For passive investors: Depreciation is non-cash, so a rental often shows a tax loss while cash-flowing — sheltering income. Rental losses are passive: they offset passive income freely, and up to $25,000/yr can offset ordinary (W-2) income if you actively participate and your MAGI is under $100k (phasing out to $0 by $150k); unused losses carry forward. On sale, claimed depreciation is recaptured at up to 25%, and gains may owe capital-gains tax (a 1031 exchange can defer both). Figures are a year-1 estimate at your 24.0% rate — not tax advice; consult a CPA.
Schools (NCES district)
- District
- Binghamton City School District
- NCES district ID
- 3604870
- Math proficiency
- 30% ▬ 0.00%
- Reading proficiency
- 44% ▲ 15.00%
- Median HH income
- $30,475
- Composite
- 30.09/100
- National rank
- #6342
- State rank
- #557 of 590 in NY
Livability — Binghamton
- Score
- 78/100
- State rank
- #174
- US rank
- #2710
Category grades
Schools grade is shown separately in the Schools card above.
Census & demographics
- Census place
- Binghamton, NY
- City population
- 65,170
- Population (ZIP)
- 9,138
Population outlook (Broome County) Hauer SSP2
- Today (2025)
- 187,989 people
- By 2030
- 183,066 · -2.6%
- By 2040
- 172,228 · -8.4%
- By 2050
- 163,161 · -13.2%
- By 2075
- 153,641 · -18.3%
- By 2100
- 140,851 · -25.1%
Race, ethnicity, and origin ACS 2023
- Neighborhood character
- Predominantly White (73%)
- Race & ethnicity
- White 73% Black 12% Hispanic / Latino 8% Two or more races 5% Asian 3%
- Hispanic origin (detail)
- Puerto Rican 5%
- Common ancestry
- Hispanic 8% Romanian 3% Slovak 2%
- Foreign-born
- 9% · Canada, China
- Languages at home
- 87% English-only · French/Haitian/Cajun 5% Spanish 4% Chinese 2%
Political lean MEDSL · Broome
- 2024 margin
- Toss-up / Even · D 50.2% · R 49.8%
- 2008→2024 swing
- -7.6pp toward R · 2008: 8.0pp · 2024: 0.4pp
- All cycles
- 2024: D+0.4 2020: D+3.5 2016: R+3.7 2012: D+4.6 2008: D+8.0
Not yet ingested
- Civics
- —
Market trends
- HPI YoY
- ▲ 40.85%
- Current HPI
- 280.3184
- Rent YoY
- —
- Metro
- —
- State GDP YoY
- ▲ 2.60%
- F500 in state
- 92
Industry mix (Fortune 500 HQ in NY)
| Industry | F500 HQs | Revenue |
|---|---|---|
| Financial Services | 10 | $950B |
|
||
| Consumer Goods | 9 | $162B |
|
||
| Insurance | 4 | $225B |
|
||
| Telecommunications | 2 | $144B |
|
||
| Pharmaceuticals | 2 | $112B |
|
||
| Media / Entertainment | 2 | $69B |
|
||
Price history
+119.9% since first listed2 events — show timeline
- 2026-05-20 Listed $155,000 GBAOR
- 2004-12-07 Sold (Public Records) $70,500 Public Records
Property tax history
+6.3%/yrLatest (2025): $6,642 · +0.9% YoY. Source: county tax records.
Cash-flow waterfall
monthlySold comps — $/sqft
last 12 mo · ≤1 miLoading sold comps…