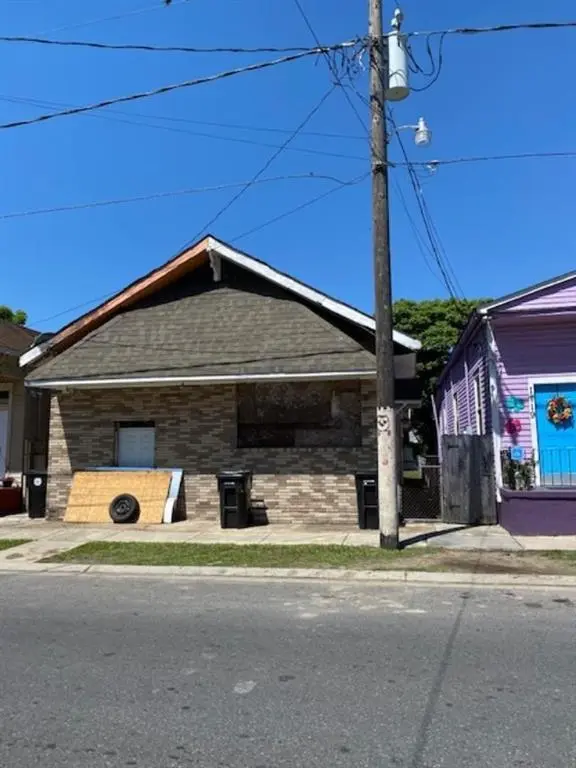
1123 Teche St · New Orleans, LA
Flood risk 8/10 · Major
- FEMA flood zone
- X (shaded)
- Chance of flooding over 30 yrs
- 0.6%
- Est. flood insurance / yr
- $507 – $1,088
Fire risk 1/10 · Minimal
- Est. fire insurance / yr
- $1,269 – $2,357
Heat risk 10/10 · Severe
- Hot days now (above 108°F)
- 7 days/yr
- Hot days in 30 yrs
- 22 days/yr
Wind risk 10/10 · Severe
- Chance of severe wind over 30 yrs
- 99.0%
Air-quality risk 3/10 · Minor
- Unhealthy air days now
- 3 days/yr
- Unhealthy air days in 30 yrs
- 4 days/yr
Risk factors via First Street. Map © Google.
Why this score? — see what drove the D grade
The composite is a weighted blend of 9 inputs, each scored 0–100. Each bar is that input's sub-score; the figure is the points it added to the 100-point composite (weight × sub-score).
- Cash flow +15.0/30.0
- ARV discount +7.5/15.0
- 1% rule +5.0/10.0
- DSCR +5.0/10.0
- Livability +4.0/5.0
- Condition / age +2.5/5.0
- Rent growth +2.3/5.0
- Schools +1.6/10.0
- Appreciation +0.0/10.0
$59,900
🖨 Deal sheet 📄 Offer letter ✓ Due diligence
Listing remarks MLS
Awesome investment opportunity in Algiers. This property could easily become a single family or multifamily, restaurant/bar, daycare, retail space, neighborhood store, or even a beautiful single family home. This property is surrounded by residential homes as well as several commercial businesses. It is also located a short distance to the Algiers Ferry or the Gretna bus line. Call today for an appointment
Key facts
- Single family
- Multifamily
- Built 1959
Tags
Neighborhood map
What this means for you Summary
Snapshot
- This is a 4-bed/2.0-bath single-family listed at $60k.
Deal economics
- At list price, monthly cash flow is $2k ($20k/yr) — positive.
- The deal already cash-flows at list — no discount required.
- Meets the 1% rule at list price ($3k rent vs $60k).
- Recommended offer: $55k (9.0% below list) — sets the bar for market timing.
- Cap rate 40.4% vs local median 4.4% in New Orleans — top-decile yield for the area; either an underpriced asset or a hidden risk that comps aren't pricing in. Stress-test before assuming the spread holds.
Location & tenants
- Location reads 81/100 on livability (#3 in LA, #1,383 nationally) — a professional / high-income tenant draw. Strengths: amenities A+, commute A+, health & safety A+; Watch: crime C-, employment D.
- Orleans Parish (urban): math 11% / reading 27% proficiency, ranked #69 of 98 in LA (top 70%) — low school quality limits family demand, transient renter base, plan for 1-2y turnover; 68% free/reduced lunch — lower-income household profile, screen leases tightly.
- Market conditions: Rents soft (-0.7%/yr); 265 active listings in the ZIP; 40 comparable units currently listed for rent nearby; rentals at typical pace (median 17d on market — plan ~3-4 weeks tenant-placement turnaround); lower-income renter base — watch delinquency; 710 units permitted in Orleans Parish in 2024 (244 in 5+ unit buildings).
- At $2,726/mo this rent would consume 75% of the median local household income ($43k/yr) (locally 2240% of renters already pay >50% of income on rent) — very limited rent-growth headroom before tenants either downsize or default.
Forward outlook
- Local home prices are declining (-3.0%/yr); year-one equity from $414 of loan paydown is wiped out by about $2k of value loss. Plan a longer hold.
- Orleans County population projected at +61% by 2050 — long-run rental-demand tailwind backs the buy-and-hold thesis.
- At projected returns (-3.0% appreciation + 0.0% rent growth), your $17k cash investment doubles in ~1 year — after that, you're playing with house money.
Negotiation context
- It's been on market 102 days — a 9% lower offer ($55k) is reasonable based on typical stale-listing flexibility.
- 3 sale attempts since 14y ago with the ask held roughly flat each time — persistent listings suggest the price (not the market) is what's stuck; bring a comps-based counter.
Risks & watch-outs
- Watch-outs: flood insurance adds $66/mo; built in 1959 — expect roof / HVAC / electrical / plumbing capex.
- Climate carrying-cost: severe flood risk; severe wind risk, 99% chance of damaging wind over 30y; extreme-heat days projected 7→22/yr by 2055 (HVAC capex compounding) — expect insurance premiums to compound above CPI over the hold.
Questions for the listing agent
- It's been on market 102 days. Have you received any prior offers? Is the seller open to a 9% concession, seller financing, or rate buy-down credit?
- Built in 1959 — when were the roof, HVAC, electrical panel, plumbing, and water heater last replaced?
- What's the actual annual flood-insurance premium (NFIP or private), and is the property in a SFHA with mandatory coverage?
- Why hasn't it sold? Are there any deal-killer items the seller is aware of (foundation, flood, title, zoning, code violations)?
- Is there a deadline driving the sale (1031 exchange, divorce, estate, relocation)? That informs how much negotiation room exists.
- The area grade is low — what's the realistic commute time and amenity access for the typical tenant pool here? Any planned neighborhood developments (good or bad) we should know about?
- What's the average days-on-market for RENTAL listings here right now (not sales)? A rising rental-DOM trend means longer vacancies and softer asking-rent achievability than the comps imply.
- What's the recent tenant-quality profile in this submarket — average credit score on applications, eviction rate, late-payment / NSF rate, and stable-employment percentage? A property-management company in the area should have these aggregated.
- How much new for-sale + rental construction is in the pipeline within 1–3 miles? Heavy new supply typically softens prices + rents 12–24 months out; constrained supply supports both.
Investment metrics
- 1% rule
- 4.55% ✓
- Cap rate
- 40.44%
- Cash-on-cash
- 121.97%
- DSCR
- 6.43
- GRM
- 1.8
CMA / ARV
- ARV (median comp)
- $712,995
- List price
- $59,900
- Delta
- -91.60%
- Verdict
- UNDERPRICED
- Comps
- 6 within 1.0 mi
Show comp detail 12 sales within ~0.75 mi
| Address | Dist | Beds/Ba | Sqft | Sold | Price | $/sf | Match |
|---|---|---|---|---|---|---|---|
| 422 Red Allen Way | 0.28mi | 3/2.0 (-1) | 1,800 (+2%) | 1mo | $440,000 | $244 | 79 |
| 419 Homer St | 0.18mi | 3/2.0 (-1) | 1,785 (+1%) | 13mo | $419,000 | $235 | 75 |
| 935 Belleville St | 0.26mi | 3/2.0 (-1) | 1,847 (+4%) | 2mo | $370,000 | $200 | 74 |
| 423 Diana St | 0.06mi | 4/2.0 | 1,958 (+10%) | 10mo | $389,000 | $199 | 72 |
| 320 De Armas St | 0.03mi | 3/2.0 (-1) | 1,508 (-15%) | 3mo | $138,689 | $92 | 66 |
| 415 Vallette St | 0.58mi | 3/2.0 (-1) | 1,700 (-4%) | 2mo | $379,000 | $223 | 60 |
| 1210 Belleville St | 0.25mi | 3/2.0 (-1) | 1,600 (-10%) | 10mo | $55,000 | $34 | 58 |
| 441 Hancock St | 0.62mi | 3/2.0 (-1) | 1,730 (-2%) | 10mo | $380,000 | $220 | 54 |
| 1600 Bodenger Blvd | 0.48mi | 3/2.5 (-1) | 1,558 (-12%) | 1mo | $102,000 | $65 | 50 |
| 1321 Pacific Ave | 0.37mi | 3/1.5 (-1) | 1,520 (-14%) | 8mo | $60,000 | $39 | 46 |
| 820 Eliza St | 0.58mi | 3/3.0 (-1) | 1,900 (+7%) | 9mo | $359,000 | $189 | 45 |
| 301 Pelican Ave | 0.55mi | 4/2.0 | 2,002 (+13%) | 20mo | $499,900 | $250 | 37 |
Match score weights: distance 35% · size 25% · config 20% · recency 20%. Top-matched comps best support the ARV.
Projected returns pro-forma
-3.0% appreciation · 0.0% rent growth · sell at horizon
- IRR
- —
- Equity multiple
- 6.17×
- Total profit
- $86,751
- Equity at exit
- $8,931
- IRR
- —
- Equity multiple
- 11.70×
- Total profit
- $179,447
- Equity at exit
- $5,179
Cash invested: $16,772 (down + closing). Projections, not guarantees.
Landlord ↔ Tenant lean methodology
- Overall (STATE)
- 90 Strongly Landlord-Friendly
- State Louisiana
- 90 Strongly Landlord-Friendly · R+12
- County
- — inherits STATE
- City
- — inherits STATE
ZIP-level market 70114
- Rents YoY
- -0.7%
- Active inventory
- 265
- Price-to-rent
- 1.8×
Monthly cashflow live
- Estimated rent
- $2,726 high interval (Pro) →
- Mortgage (P&I)
- −$314
- Tax from tax record
- −$110 /mo · $1,316/yr
- Insurance
- −$25
- Flood insurance flood zone
- −$66 /mo · $798/yr
- HOA
- −$0
- Vacancy / Maint / Mgmt
- −$572
- Net cashflow
- $1,638
Break-even live
UW: 25.0% down · 7.5% · 30yr · 1.5% tax · 5.0% vac · 8.0% maint · 8.0% mgmt
Financing live
Cash to close
- Down payment
- $14,975
- Closing costs
- $1,797
- Reserves months
- —
- Total cash needed
- —
Loan-product check · same deal, 3 products live
Conventional
25% down · 7.5% · 30yr
- Down + closing
- —
- Monthly P&I
- —
- Monthly cashflow
- —
- DSCR
- —
- Eligible?
- —
Personal DTI + credit; lowest rate.
DSCR
20% down · 8.5% · 30yr
- Down + closing
- —
- Monthly P&I
- —
- Monthly cashflow
- —
- DSCR
- —
- Eligible?
- —
No personal income docs; deal must DSCR.
Hard money
10% down · 12.0% · 12mo
- Down + closing
- —
- Monthly P&I
- —
- Monthly cashflow
- —
- DSCR
- —
- Eligible?
- —
Short-term bridge; refi at stabilization.
Rent comps 40 comps
| Address | Beds | Baths | Sqft | Rent | $/sqft | DOM | Units | Dist |
|---|---|---|---|---|---|---|---|---|
| 433 Homer St Unit 1 New Orleans, LA | 4.0 | 2.0 | 1570 | $1,850 | $1.18 | 23d | 1 | 0.16mi |
| 400 Park Blvd Unit A New Orleans, LA | 4.0 | 1.5 | 1275 | $2,200 | $1.73 | 23d | 1 | 0.28mi |
| 513 Park Blvd New Orleans, LA | 3.0 | 2.0 | 1600 | $2,300 | $1.44 | 3d | 1 | 0.33mi |
| 729 Elmira Ave New Orleans, LA | 4.0 | 2.0 | 2000 | $2,000 | $1.00 | 16d | 1 | 0.39mi |
| 527 Atlantic Ave New Orleans, LA | 3.0 | 2.0 | 1800 | $2,050 | $1.14 | 23d | 1 | 0.58mi |
| 336 Elmira Ave New Orleans, LA | 3.0 | 1.0 | 1250 | $1,825 | $1.46 | 23d | 1 | 0.66mi |
| 249 Vallette St New Orleans, LA | 4.0 | 2.0 | 1734 | $2,500 | $1.44 | 16d | 1 | 0.67mi |
| 807 Whitney Ave Unit 1 New Orleans, LA | 3.0 | 2.0 | 1262 | $1,500 | $1.19 | 3d | 1 | 0.70mi |
| 119 Vallette St New Orleans, LA | 3.0 | 2.5 | 1500 | $2,100 | $1.40 | 23d | 1 | 0.75mi |
| 1414 Sumner St New Orleans, LA | 3.0 | 2.0 | 1800 | $1,450 | $0.81 | 16d | 1 | 0.88mi |
| 701 Behrman Ave New Orleans, LA | 3.0 | 2.0 | 1368 | $2,300 | $1.68 | 3d | 1 | 0.95mi |
| 1050 Annunciation St Unit 1272355P New Orleans, LA | 2.0–5.0 | 2.0–4.0 | 1544 | $3,489 | $2.26 | 3d | 3 | 0.97mi |
| 1010 Isbell St Gretna, LA | 3.0 | 1.0 | 1300 | $1,350 | $1.04 | 43d | 1 | 0.97mi |
| 431 Gravier St Ste 4 New Orleans, LA | 3.0 | 2.0 | 2100 | $3,700 | $1.76 | 43d | 1 | 1.02mi |
| 535 Decatur St Unit 3 New Orleans, LA | 3.0 | 2.0 | 1600 | $2,800 | $1.75 | 11d | 1 | 1.08mi |
| 515 Saint Ann St Unit 3 New Orleans, LA | 3.0 | 2.0 | 1644 | $3,600 | $2.19 | 44d | 1 | 1.14mi |
| 527 Saint Ann St Unit 3 New Orleans, LA | 3.0 | 2.0 | 1687 | $3,500 | $2.07 | 43d | 1 | 1.16mi |
| 1420 Annunciation St New Orleans, LA | 1.0–3.0 | 1.0–2.0 | 1019 | $2,390 | $2.35 | 1d | 78 | 1.17mi |
| 751 Chartres St New Orleans, LA | 2.0–3.0 | 2.0 | 1461 | $3,450 | $2.36 | 43d | 1 | 1.19mi |
| 800 Gravier St Unit 1272312P New Orleans, LA | 2.0–4.0 | 2.0–4.0 | 1673 | $6,169 | $3.69 | 14d | 2 | 1.22mi |
| 1684 Lauradale Dr New Orleans, LA | 4.0 | 2.0 | 1571 | $2,000 | $1.27 | 23d | 1 | 1.27mi |
| 419 Carondelet St Unit PHB New Orleans, LA | 3.0 | 2.5 | 2546 | $5,700 | $2.24 | 3d | 1 | 1.27mi |
| 921 Race St Unit C New Orleans, LA | 3.0 | 2.0 | 1570 | $3,000 | $1.91 | 10d | 1 | 1.29mi |
| 822 Perdido St Unit 1272370P New Orleans, LA | 1.0–5.0 | 1.0–5.0 | 1447 | $5,974 | $4.13 | 3d | 4 | 1.29mi |
| 810 Bienville St New Orleans, LA | 1.0–3.0 | 1.0–2.0 | 995 | $2,688 | $2.70 | 3d | 9 | 1.30mi |
| 2320 Mardi Gras Blvd New Orleans, LA | 4.0 | 2.5 | 1600 | $2,500 | $1.56 | 1d | 1 | 1.31mi |
| 822 Howard Ave Unit 1272354P New Orleans, LA | 1.0–5.0 | 1.0–4.0 | 1749 | $9,250 | $5.29 | 1d | 3 | 1.34mi |
| 803 Baronne St New Orleans, LA | 3.0 | 2.0 | 1791 | $3,525 | $1.97 | 3d | 1 | 1.35mi |
| 939 Iberville St New Orleans, LA | 1.0–3.0 | 1.0 | 1502 | $3,800 | $2.53 | 11d | 7 | 1.36mi |
| 734 Ursulines Ave New Orleans, LA | 3.0 | 2.0 | 1340 | $2,800 | $2.09 | 43d | 1 | 1.38mi |
| 1525 Melpomene St Unit Na New Orleans, LA | 3.0 | 1.5 | 1700 | $4,000 | $2.35 | 43d | 1 | 1.40mi |
| 632 Mandeville St Unit 2B New Orleans, LA | 4.0 | 4.5 | 1337 | $4,500 | $3.37 | 17d | 1 | 1.42mi |
| 1011 Canal St Unit 1513939P New Orleans, LA | 4.0 | 4.0 | 1765 | $11,253 | $6.38 | 23d | 1 | 1.42mi |
| 1011 Canal St Unit 1513926P New Orleans, LA | 1.0–4.0 | 1.0–4.0 | 1016 | $12,077 | $11.88 | 1d | 2 | 1.42mi |
| 1418 Royal St Unit 1418 New Orleans, LA | 4.0 | 2.0 | 1300 | $2,450 | $1.88 | 23d | 1 | 1.43mi |
| 1000 Girod St Ph 2 New Orleans, LA | 3.0 | 3.5 | 2008 | $4,800 | $2.39 | 43d | 1 | 1.43mi |
| 518 S Rampart St New Orleans, LA | 3.0 | 2.0 | 1853 | $3,995 | $2.16 | 3d | 1 | 1.43mi |
| 875 O'Keefe Ave #301 New Orleans, LA | 3.0 | 2.5 | 2029 | $4,500 | $2.22 | 17d | 1 | 1.44mi |
| 811 Burgundy St New Orleans, LA | 4.0 | 2.5 | 2059 | $5,000 | $2.43 | 43d | 1 | 1.46mi |
| 913 Felicity St New Orleans, LA | 1.0–3.0 | 1.0–2.0 | 999 | $1,850 | $1.85 | 23d | 1 | 1.47mi |
Listing history 6 events
-
2026-06-02statusdays on market $59,900 Pending 102 DOM
-
2026-06-01days on market $59,900 Active 101 DOM
-
2026-05-31days on market $59,900 Active 100 DOM
-
2026-02-20$59,900 Active 409-char remark
Show marketing remark (409 chars)
Awesome investment opportunity in Algiers. This property could easily become a single family or multifamily, restaurant/bar, daycare, retail space, neighborhood store, or even a beautiful single family home. This property is surrounded by residential homes as well as several commercial businesses. It is also located a short distance to the Algiers Ferry or the Gretna bus line. Call today for an appointment
-
2012-09-25$45,000
ⓘ Source: listings_history table (triggers on properties + properties_extension) + one-shot
backfill from property_details.listing_events for pre-trigger history.
Tax reassessment forecast LA · Resets to sale price
- Current annual tax
- $1,316 · $110/mo
- Projected year-2 tax
- $1,316 · $110/mo
- Expected delta
- $0/yr ($0/mo · 0.0%)
ⓘ Screening estimate from a state-policy table — verify with the county assessor before closing.
Climate risk First Street
- Flood 8/10 Severe FEMA zone X (shaded) · 60% chance over 30 yrs
- Wildfire 1/10 Low
- Heat 10/10 Extreme 7 d/yr ≥108°F today · 22 d/yr by 30 yrs out
- Wind 10/10 Extreme 99% chance of damaging wind over 30 yrs
- Air quality 3/10 Moderate 3 unhealthy d/yr today · 4 by 30 yrs out
Nearby sold comps map
Loading sold comps map…
Walkable amenities ~0.75 mi
Loading nearby amenities…
Taxation est. · year 1
- Rental income
- $32,711
- − Mortgage interest
- −$3,355
- − Property taxes
- −$1,316
- − Insurance
- −$1,097
- − Repairs & maintenance
- −$2,617
- − Management
- −$2,617
- − Depreciation
- −$1,743
- Taxable income
- $19,967
- Est. tax owed @ 24.0%
- −$4,792
- After-tax cash flow
- $14,867/yr
For passive investors: Depreciation is non-cash, so a rental often shows a tax loss while cash-flowing — sheltering income. Rental losses are passive: they offset passive income freely, and up to $25,000/yr can offset ordinary (W-2) income if you actively participate and your MAGI is under $100k (phasing out to $0 by $150k); unused losses carry forward. On sale, claimed depreciation is recaptured at up to 25%, and gains may owe capital-gains tax (a 1031 exchange can defer both). Figures are a year-1 estimate at your 24.0% rate — not tax advice; consult a CPA.
Schools (NCES district)
- District
- Orleans Parish
- NCES district ID
- 2201170
- Math proficiency
- 11% ▼ -52.00%
- Reading proficiency
- 27% ▼ -46.00%
- Median HH income
- $37,011
- Composite
- 15.78/100
- National rank
- #9271
- State rank
- #69 of 98 in LA
Livability — New Orleans
- Score
- 81/100
- State rank
- #3
- US rank
- #1383
Category grades
Schools grade is shown separately in the Schools card above.
Census & demographics
- Census place
- New Orleans, LA
- County
- Orleans Parish · 338,817 people
- City population
- 338,817
- Metro
- New Orleans-Metairie, LA
- Population (ZIP)
- 22,659
- Household income
- $43,493
- Rent vs Own
- Severe rent burden
- 2240.0
Population outlook (Orleans County) Hauer SSP2
- Today (2025)
- 513,025 people
- By 2030
- 575,781 · +12.2%
- By 2040
- 700,174 · +36.5%
- By 2050
- 826,541 · +61.1%
- By 2075
- 1,123,374 · +119.0%
- By 2100
- 1,355,609 · +164.2%
Race, ethnicity, and origin ACS 2023
- Neighborhood character
- Predominantly Black (72%)
- Race & ethnicity
- Black 72% White 16% Hispanic / Latino 8% Two or more races 5%
- Hispanic origin (detail)
- Mexican 2% Puerto Rican 1%
- Common ancestry
- Lithuanian 3% Slovak 1% Italian 1%
- Foreign-born
- 5% · Canada
- Languages at home
- 91% English-only · Spanish 6% French/Haitian/Cajun 2% Other Indo-European 1%
Political lean MEDSL · Orleans
- 2024 margin
- Solid D (+67.0) · D 82.2% · R 15.2% · Other 2.7%
- 2008→2024 swing
- +6.7pp toward D · 2008: 60.3pp · 2024: 67.0pp
- All cycles
- 2024: D+67.0 2020: D+68.2 2016: D+66.2 2012: D+62.5 2008: D+60.3
Not yet ingested
- Civics
- —
Market trends
- HPI YoY
- ▼ -98.56%
- Current HPI
- 149.0172
- Rent YoY
- ▼ -0.72%
- Metro
- New Orleans-Metairie, LA
- State GDP YoY
- ▲ 3.29%
- F500 in state
- 10
Industry mix (Fortune 500 HQ in LA)
| Industry | F500 HQs | Revenue |
|---|---|---|
| Telecommunications | 2 | $23B |
|
||
| Utilities | 1 | $12B |
|
||
| Wholesale / Distribution | 1 | $5B |
|
||
| Advertising | 1 | $2B |
|
||
Price history
+33.1% since first listed3 events — show timeline
- 2026-02-20 Listed $59,900 AcadianaMLS
- 2026-02-20 Listed $59,900 GSREIN
- 2012-09-25 Listed $45,000 AcadianaMLS
Property tax history
-2.6%/yrLatest (2026): $1,316 · +0.0% YoY. Source: county tax records.
Cash-flow waterfall
monthlySold comps — $/sqft
last 12 mo · ≤1 miLoading sold comps…