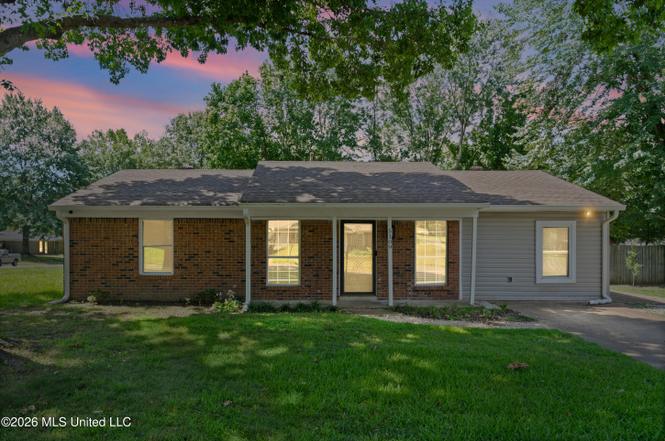
5109 Gray Dr · Horn Lake, MS
Flood risk 1/10 · Minimal
- FEMA flood zone
- X (unshaded)
- Chance of flooding over 30 yrs
- 0.0%
- Est. flood insurance / yr
- $507 – $1,088
Fire risk 3/10 · Minor
- Est. fire insurance / yr
- $1,241 – $2,305
Heat risk 6/10 · Moderate
- Hot days now (above 109°F)
- 7 days/yr
- Hot days in 30 yrs
- 21 days/yr
Wind risk 4/10 · Minor
- Chance of severe wind over 30 yrs
- 22.0%
Air-quality risk 2/10 · Minimal
- Unhealthy air days now
- 1 days/yr
- Unhealthy air days in 30 yrs
- 2 days/yr
Risk factors via First Street. Map © Google.
Why this score? — see what drove the F grade
The composite is a weighted blend of 9 inputs, each scored 0–100. Each bar is that input's sub-score; the figure is the points it added to the 100-point composite (weight × sub-score).
- Cash flow +14.2/30.0
- DSCR +4.3/10.0
- Schools +4.0/10.0
- Livability +3.1/5.0
- 1% rule +2.8/10.0
- Condition / age +2.5/5.0
- Rent growth +2.3/5.0
- ARV discount +0.6/15.0
- Appreciation +0.0/10.0
$190,000
🖨 Deal sheet (PDF) 📄 Offer letter ✓ Due diligence
Listing remarks MLS
Check out this cute corner lot home all ONE level! New paint and LVP flooring throughout. Large family room with fireplace. Eat-In kitchen. Large walk in pantry and and separate laundry room. Extra family/bonus room. Huge corner lot with fenced backyard. Storage building remains. Come see it today!
Key facts
- Spacious kitchen
- New dishwasher
- Corner lot
Tags
Property features AI
Exterior
- Parking: Driveway; Exterior storage
- Utilities: Public water; Public sewer; Electricity connected; Cable available; Water available
- Home design: Single-family house; One level; Move-in ready
- Construction: Brick veneer exterior; Slab foundation; Asphalt shingle roof; Built per public records
- Exterior features: Private yard; Patio; Back yard fencing; Corner lot
Interior
- Kitchen: Dishwasher; Free‑standing electric range; Microwave; Pantry
- Bedrooms: Three bedrooms on the main level
- Flooring: Luxury vinyl; Hardwood; Tile
- Bathrooms: One full bathroom on the main level; Total of 1 bathroom
- Heating & cooling: Central heating; Central electric air conditioning
- Interior features: Eat-in kitchen; High ceilings; Pantry; Storage; Walk-in closet(s); Soaking tub; Has fireplace (gas log in living room)
- Laundry & utility: Dedicated laundry room
Neighborhood map
What this means for you Summary
Snapshot
- This is a 3-bed/1.0-bath single-family listed at $190k.
Deal economics
- At list price, monthly cash flow is $32 ($383/yr) — positive.
- The deal already cash-flows at list — no discount required.
- To meet the 1% rule (rent ≥ 1% of price), the offer needs to be $147k (22.4% below list).
- Recommended offer: $147k (22.4% below list) — sets the bar for 1% rule.
Location & tenants
- Location reads 61/100 on livability (#196 in MS) — a middle-class / working-renter tenant base. Strengths: cost of living A+, housing A+, crime A; Watch: employment D, amenities F, commute F.
- Desoto County School District (suburban): math 48% / reading 42% proficiency, ranked #20 of 130 in MS (top 15%) — families likely to look elsewhere, expect single-tenant / working-renter base with shorter leases.
- Zoned schools: Lake Cormorant Elementary (math 48% / reading 55%, grade C-, #56 of 375 statewide, top 15%, 647 students, 100% FRL); Lake Cormorant Middle (math 51% / reading 30%, grade F, #60 of 179 statewide, top 37%, 764 students, 100% FRL); Lake Cormorant High (math 29% / reading 42%, grade F, #66 of 197 statewide, top 34%, 969 students, 100% FRL) — zoned schools average 100% FRL vs 43% district-wide (56 pts higher); higher-poverty schools than district average — tighter screening recommended.
- Market conditions: Rents soft (-0.7%/yr); 95 active listings in the ZIP; 11 comparable units currently listed for rent nearby; rentals at typical pace (median 24d on market — plan ~3-4 weeks tenant-placement turnaround); 1,155 units permitted in DeSoto County in 2024 (0 in 5+ unit buildings).
- This rent runs 33% of the median local income ($53k/yr) — at the standard rent-burdened threshold; future hikes will face affordability resistance.
Forward outlook
- Local home prices are declining (-3.0%/yr); year-one equity from $1k of loan paydown is wiped out by about $6k of value loss. Plan a longer hold.
- DeSoto County population projected at +33% by 2050 — long-run rental-demand tailwind backs the buy-and-hold thesis.
Negotiation context
- Only 5 days on market — expect competitive offers; lowballing is unlikely to land.
- 7 sale attempts since 21y ago with the ask held roughly flat each time — persistent listings suggest the price (not the market) is what's stuck; bring a comps-based counter.
Risks & watch-outs
- Climate carrying-cost: extreme-heat days projected 7→21/yr by 2055 (HVAC capex compounding) — expect insurance premiums to compound above CPI over the hold.
Questions for the listing agent
- Built in 1975 — when were the roof, HVAC, electrical panel, plumbing, and water heater last replaced?
- Is there a deadline driving the sale (1031 exchange, divorce, estate, relocation)? That informs how much negotiation room exists.
- Schools are F-rated, which usually means shorter tenancies and higher turnover. Who's the typical renter profile here, and what's been the actual vacancy rate?
- The area grade is low — what's the realistic commute time and amenity access for the typical tenant pool here? Any planned neighborhood developments (good or bad) we should know about?
- What's the average days-on-market for RENTAL listings here right now (not sales)? A rising rental-DOM trend means longer vacancies and softer asking-rent achievability than the comps imply.
- What's the recent tenant-quality profile in this submarket — average credit score on applications, eviction rate, late-payment / NSF rate, and stable-employment percentage? A property-management company in the area should have these aggregated.
- How much new for-sale + rental construction is in the pipeline within 1–3 miles? Heavy new supply typically softens prices + rents 12–24 months out; constrained supply supports both.
Investment metrics
- 1% rule
- 0.78% ✗
- Cap rate
- 6.49%
- Cash-on-cash
- 0.72%
- DSCR
- 1.03
- GRM
- 10.7
CMA / ARV
- ARV (on-the-fly)
- $164,736
- Comps found
- 12
Show comp detail 12 sales within ~0.75 mi
| Address | Dist | Beds/Ba | Sqft | Sold | Price | $/sf | Match |
|---|---|---|---|---|---|---|---|
| 5722 Chickasaw Dr | 0.12mi | 3/1.0 | 1,076 (+2%) | 1mo | $189,000 | $176 | 90 |
| 5820 Gray Cv | 0.10mi | 3/1.0 | 1,052 (-0%) | 14mo | $179,999 | $171 | 83 |
| 5770 Chickasaw Dr | 0.13mi | 3/1.0 | 1,119 (+6%) | 6mo | $175,000 | $156 | 79 |
| 5161 Crestwood Cv | 0.09mi | 3/1.0 | 1,157 (+10%) | 10mo | $154,900 | $134 | 71 |
| 5205 Gray Dr | 0.10mi | 3/1.0 | 1,183 (+12%) | 9mo | $164,900 | $139 | 68 |
| 5654 Crestwood Dr | 0.09mi | 3/1.0 | 1,179 (+12%) | 12mo | $184,980 | $157 | 66 |
| 5491 Adams Cir | 0.42mi | 3/1.0 | 1,050 (-1%) | 16mo | $148,900 | $142 | 66 |
| 5951 Adams Cir | 0.44mi | 3/1.0 | 1,030 (-2%) | 12mo | $179,900 | $175 | 66 |
| 5089 Woody Cv | 0.13mi | 3/2.0 | 1,202 (+14%) | 3mo | $149,900 | $125 | 65 |
| 5020 Gray Dr | 0.09mi | 3/1.0 | 1,203 (+14%) | 15mo | $140,000 | $116 | 60 |
| 5771 Ashford Dr | 0.70mi | 3/1.5 | 967 (-8%) | 16mo | $189,000 | $195 | 38 |
| 5605 Choctaw Dr | 0.54mi | 3/2.0 | 1,210 (+15%) | 10mo | $120,000 | $99 | 38 |
Match score weights: distance 35% · size 25% · config 20% · recency 20%. Top-matched comps best support the ARV.
Projected returns pro-forma
-3.0% appreciation · 0.0% rent growth · sell at horizon
- IRR
- -18.2%
- Equity multiple
- 0.38×
- Total profit
- $-33,163
- Equity at exit
- $28,330
- IRR
- -16.6%
- Equity multiple
- 0.19×
- Total profit
- $-43,314
- Equity at exit
- $16,428
Cash invested: $53,200 (down + closing). Projections, not guarantees.
Landlord ↔ Tenant lean methodology
- Overall (STATE)
- 90 Strongly Landlord-Friendly
- State Mississippi
- 90 Strongly Landlord-Friendly · R+11
- County
- — inherits STATE
- City
- — inherits STATE
ZIP-level market 38637
- Home prices YoY
- -13.4%
- Rents YoY
- -0.7%
- Active inventory
- 95
- Price-to-rent
- 10.7×
Monthly cashflow live
- Estimated rent
- $1,474 high interval (Pro) →
- Mortgage (P&I)
- −$996
- Tax from tax record
- −$57 /mo · $686/yr
- Insurance
- −$79
- HOA
- −$0
- Vacancy / Maint / Mgmt
- −$310
- Net cashflow
- $32
Break-even live
Sensitivity live
| Price | -10% $139 | -5% $86 | +0% $32 | +5% $-22 | +10% $-76 |
|---|---|---|---|---|---|
| Rent | -10% $-85 | -5% $-26 | +0% $32 | +5% $90 | +10% $148 |
| Rate | -1.0pp $128 | -0.5pp $80 | base $32 | +0.5pp $-17 | +1.0pp $-67 |
UW: 25.0% down · 7.5% · 30yr · 1.5% tax · 5.0% vac · 8.0% maint · 8.0% mgmt
Financing live
Cash to close
- Down payment
- $47,500
- Closing costs
- $5,700
- Reserves months
- —
- Total cash needed
- —
Loan-product check · same deal, 3 products live
Conventional
25% down · 7.5% · 30yr
- Down + closing
- —
- Monthly P&I
- —
- Monthly cashflow
- —
- DSCR
- —
- Eligible?
- —
Personal DTI + credit; lowest rate.
DSCR
20% down · 8.5% · 30yr
- Down + closing
- —
- Monthly P&I
- —
- Monthly cashflow
- —
- DSCR
- —
- Eligible?
- —
No personal income docs; deal must DSCR.
Hard money
10% down · 12.0% · 12mo
- Down + closing
- —
- Monthly P&I
- —
- Monthly cashflow
- —
- DSCR
- —
- Eligible?
- —
Short-term bridge; refi at stabilization.
Rent comps 11 comps
| Address | Beds | Baths | Sqft | Rent | $/sqft | DOM | Units | Dist |
|---|---|---|---|---|---|---|---|---|
| 5108 Gray Dr Horn Lake, MS | 3.0 | 1.0 | 1150 | $1,325 | $1.15 | 24d | 1 | 0.05mi |
| 5108 Gray Dr Horn Lake, MS | 3.0 | 1.0 | 1150 | $1,325 | $1.15 | 15d | 1 | 0.05mi |
| 5840 Gray Cv Horn Lake, MS | 3.0 | 1.0 | 1070 | $1,295 | $1.21 | 44d | 1 | 0.14mi |
| 5229 Nail Rd Horn Lake, MS | 3.0 | 1.0 | 912 | $1,235 | $1.35 | 24d | 1 | 0.29mi |
| 5318 Haynes Dr Horn Lake, MS | 3.0 | 1.5 | 1200 | $1,583 | $1.32 | 44d | 1 | 0.33mi |
| 4506 Shadow Hollow Dr Horn Lake, MS | 3.0 | 2.0 | 1300 | $1,645 | $1.27 | 2d | 1 | 0.98mi |
| 6392 Manchester Dr Horn Lake, MS | 3.0 | 2.0 | 1352 | $1,715 | $1.27 | 2d | 1 | 1.02mi |
| 4355 Shadow Ridge Dr Horn Lake, MS | 3.0 | 2.0 | 1350 | $1,760 | $1.30 | 5d | 1 | 1.17mi |
| 6270 Jamestown Ave Horn Lake, MS | 3.0 | 2.0 | 1053 | $1,523 | $1.45 | 44d | 1 | 1.28mi |
| 3780 Southbrook Dr Horn Lake, MS | 4.0 | 2.0 | 1444 | $1,550 | $1.07 | 5d | 1 | 1.39mi |
| 6225 Sandhurst Rd Horn Lake, MS | 3.0 | 2.0 | 1200 | $1,395 | $1.16 | 44d | 1 | 1.46mi |
Listing history 5 events
-
2026-06-18days on market $190,000 Active 5 DOM
-
2026-06-17days on market $190,000 Active 4 DOM
-
2026-06-16days on market $190,000 Active 3 DOM
-
2026-06-15remarks 614-char remark
-
2026-06-15$190,000 Active 2 DOM
ⓘ Source: listings_history table (triggers on properties + properties_extension) + one-shot
backfill from property_details.listing_events for pre-trigger history.
Tax reassessment forecast MS · Resets to sale price
- Current annual tax
- $686 · $57/mo
- Projected year-2 tax
- $1,501 · $125/mo
- Expected delta
- +$815/yr (+$68/mo · 118.9%)
ⓘ Screening estimate from a state-policy table — verify with the county assessor before closing.
Climate risk First Street
- Flood 1/10 Low FEMA zone X (unshaded) · 0% chance over 30 yrs
- Wildfire 3/10 Moderate
- Heat 6/10 Major 7 d/yr ≥109°F today · 21 d/yr by 30 yrs out
- Wind 4/10 Moderate 22% chance of damaging wind over 30 yrs
- Air quality 2/10 Low 1 unhealthy d/yr today · 2 by 30 yrs out
Nearby sold comps map
Loading sold comps map…
Walkable amenities ~0.75 mi
Loading nearby amenities…
Taxation est. · year 1
- Rental income
- $17,691
- − Mortgage interest
- −$10,643
- − Property taxes
- −$686
- − Insurance
- −$950
- − Repairs & maintenance
- −$1,415
- − Management
- −$1,415
- − Depreciation
- −$5,527
- Taxable loss
- −$2,946
- Est. tax savings @ 24.0%
- +$707
- After-tax cash flow
- $1,090/yr
For passive investors: Depreciation is non-cash, so a rental often shows a tax loss while cash-flowing — sheltering income. Rental losses are passive: they offset passive income freely, and up to $25,000/yr can offset ordinary (W-2) income if you actively participate and your MAGI is under $100k (phasing out to $0 by $150k); unused losses carry forward. On sale, claimed depreciation is recaptured at up to 25%, and gains may owe capital-gains tax (a 1031 exchange can defer both). Figures are a year-1 estimate at your 24.0% rate — not tax advice; consult a CPA.
Schools (NCES district)
- District
- Desoto County School District
- NCES district ID
- 2801320
- Math proficiency
- 48% ▼ -13.00%
- Reading proficiency
- 42% ▼ -6.00%
- Median HH income
- $59,272
- Composite
- 39.56/100
- National rank
- #3933
- State rank
- #20 of 130 in MS
Livability — Horn Lake
- Score
- 61/100
- State rank
- #196
- US rank
- #17977
Category grades
Schools grade is shown separately in the Schools card above.
Census & demographics
- Census place
- Horn Lake, MS
- County
- DeSoto County · 176,513 people
- City population
- 26,647
- Metro
- Memphis, TN-MS-AR
- Population (ZIP)
- 26,647
- Household income
- $53,311
- Rent vs Own
- Severe rent burden
- 1052.0
Population outlook (DeSoto County) Hauer SSP2
- Today (2025)
- 203,338 people
- By 2030
- 217,692 · +7.1%
- By 2040
- 245,320 · +20.6%
- By 2050
- 270,133 · +32.8%
- By 2075
- 323,341 · +59.0%
- By 2100
- 348,742 · +71.5%
Race, ethnicity, and origin ACS 2023
- Neighborhood character
- Diverse neighborhood (Simpson 0.62)
- Race & ethnicity
- Black 44% White 42% Hispanic / Latino 9% Two or more races 5% Asian 1%
- Hispanic origin (detail)
- Mexican 7%
- Common ancestry
- Slovak 2% Lithuanian 1% Serbian 1%
- Foreign-born
- 7% · Canada
- Languages at home
- 91% English-only · Spanish 8%
Political lean MEDSL · DeSoto
- 2024 margin
- Strong R (+24.1) · D 36.7% · R 60.8% · Other 2.5%
- 2008→2024 swing
- +14.2pp toward D · 2008: -38.2pp · 2024: -24.1pp
- All cycles
- 2024: R+24.1 2020: R+23.9 2016: R+34.8 2012: R+33.5 2008: R+38.2
Not yet ingested
- Civics
- —
Market trends
- HPI YoY
- ▼ -32.08%
- Current HPI
- 206.5542
- Rent YoY
- ▼ -0.66%
- Metro
- Memphis, TN-MS-AR
- State GDP YoY
- —
- F500 in state
- 0
Price history
+123.5% since first listed19 events — show timeline
- 2026-06-14 Listed $190,000 MLSU
- 2024-05-06 Sold (MLS) — MLSU
- 2024-04-01 Pending — MLSU
- 2024-03-27 Listed $169,900 MLSU
- 2019-07-23 Sold (Public Records) — Public Records
- 2019-04-22 Sold (Public Records) — Public Records
- 2019-04-15 Sold (MLS) — MLSU
- 2019-03-25 Listed $82,500 MLSU
- 2014-11-24 Sold (MLS) — Memphis Area Association of Realtors(R) MLS
- 2014-11-21 Sold (Public Records) — Public Records
- 2014-11-19 Sold (MLS) — MLSU
- 2014-10-21 Delisted — Memphis Area Association of Realtors(R) MLS
- 2014-05-19 Listed $76,500 Memphis Area Association of Realtors(R) MLS
- 2014-05-17 Listed $76,500 MLSU
- 2009-11-20 Sold (Public Records) — Public Records
- 2006-10-30 Sold (MLS) — MLSU
- 2006-07-20 Listed $72,900 MLSU
- 2006-07-18 Listing Removed — MLSU
- 2005-11-12 Listed $85,000 MLSU
Property tax history
+2.2%/yrLatest (2025): $686 · -18.9% YoY. Source: county tax records.
Cash-flow waterfall
monthlySold comps — $/sqft
last 12 mo · ≤1 miLoading sold comps…