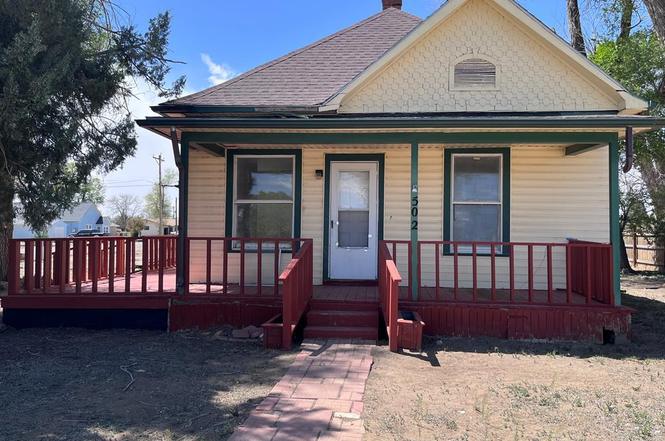
502 Otero · Ordway, CO
Flood risk No data
- FEMA flood zone
- —
- Chance of flooding over 30 yrs
- —
- Est. flood insurance / yr
- —
Fire risk No data
- Est. fire insurance / yr
- —
Heat risk No data
- Hot days now (above threshold)
- —
- Hot days in 30 yrs
- —
Wind risk No data
- Chance of severe wind over 30 yrs
- —
Air-quality risk No data
- Unhealthy air days now
- —
- Unhealthy air days in 30 yrs
- —
Risk factors via First Street. Map © Google.
Why this score? — see what drove the C+ grade
The composite is a weighted blend of 9 inputs, each scored 0–100. Each bar is that input's sub-score; the figure is the points it added to the 100-point composite (weight × sub-score).
- Cash flow +20.4/30.0
- ARV discount +15.0/15.0
- DSCR +6.5/10.0
- 1% rule +5.4/10.0
- Appreciation +3.8/10.0
- Livability +3.1/5.0
- Rent growth +2.5/5.0
- Condition / age +2.5/5.0
- Schools +2.1/10.0
$118,000
🖨 Deal sheet 📄 Offer letter ✓ Due diligence
Listing remarks
Welcome home to this beautifully updated 3-bedroom, 1-bath property offering oversized rooms and a spacious layout. Located in a serene country seting, this home combines comfort, charm, and peaceful living.
Key facts
- 8,712 sq ft lot
- 2 garage spots
- Built 1907
Property features AI
Finance
- Other: Zoning: RE1
- HOA & community: No association amenities
Exterior
- Parking: Detached 2-car garage
- Utilities: Public water; Public sewer
- Home design: Single-family residential; Frame construction with vinyl siding; Composition roof; Corner, irregular lot
- Construction: Frame construction; Vinyl siding; Composition roof
- Exterior features: Covered porch
Interior
- Kitchen: Range; Oven; Dishwasher; Refrigerator
- Bedrooms: Three bedrooms on the main level
- Flooring: Vinyl flooring
- Bathrooms: One full bathroom on the main level
- Heating & cooling: Natural gas forced air heating; Evaporative cooling and window AC units
- Interior features: Master suite on the main level; Storm windows
- Laundry & utility: Washer and dryer located on the main level
Neighborhood map
What this means for you Summary
Snapshot
- This is a 2-bed/1.0-bath single-family listed at $118k.
Deal economics
- At list price, monthly cash flow is $154 ($2k/yr) — positive.
- The deal already cash-flows at list — no discount required.
- Meets the 1% rule at list price ($1k rent vs $118k).
- Recommended offer: $107k (9.0% below list) — sets the bar for market timing.
Location & tenants
- Location reads 61/100 on livability (#233 in CO) — a middle-class / working-renter tenant base. Strengths: cost of living A+, housing A+; Watch: health & safety C-, schools F, amenities F.
- Crowley County School District No. Re-1-J (rural): math 16% / reading 28% proficiency, ranked #150 of 176 in CO (top 85%) — low school quality limits family demand, transient renter base, plan for 1-2y turnover; 62% free/reduced lunch — lower-income household profile, screen leases tightly.
- Market conditions: 29 active listings in the ZIP; 4 units permitted in Crowley County in 2024 (0 in 5+ unit buildings).
Forward outlook
- Local home prices are declining (-2.4%/yr); year-one equity from $816 of loan paydown is wiped out by about $3k of value loss. Plan a longer hold.
- Crowley County population projected at +14% by 2050 — modest demand growth; plan on rents tracking national, not racing it.
Negotiation context
- It's been on market 93 days — a 9% lower offer ($107k) is reasonable based on typical stale-listing flexibility.
- 4 sale attempts since 19y ago with the ask held roughly flat each time — persistent listings suggest the price (not the market) is what's stuck; bring a comps-based counter.
- Current owner paid $34k; list at $118k implies a 247% gain — meaningful room to come down on a strong offer.
Risks & watch-outs
- Watch-outs: built in 1907 — expect roof / HVAC / electrical / plumbing capex.
Questions for the listing agent
- It's been on market 93 days. Have you received any prior offers? Is the seller open to a 9% concession, seller financing, or rate buy-down credit?
- Built in 1907 — when were the roof, HVAC, electrical panel, plumbing, and water heater last replaced?
- Why hasn't it sold? Are there any deal-killer items the seller is aware of (foundation, flood, title, zoning, code violations)?
- Is there a deadline driving the sale (1031 exchange, divorce, estate, relocation)? That informs how much negotiation room exists.
- Schools are F-rated, which usually means shorter tenancies and higher turnover. Who's the typical renter profile here, and what's been the actual vacancy rate?
- What's the average days-on-market for RENTAL listings here right now (not sales)? A rising rental-DOM trend means longer vacancies and softer asking-rent achievability than the comps imply.
- What's the recent tenant-quality profile in this submarket — average credit score on applications, eviction rate, late-payment / NSF rate, and stable-employment percentage? A property-management company in the area should have these aggregated.
- How much new for-sale + rental construction is in the pipeline within 1–3 miles? Heavy new supply typically softens prices + rents 12–24 months out; constrained supply supports both.
Investment metrics
- 1% rule
- 1.04% ✓
- Cap rate
- 7.86%
- Cash-on-cash
- 5.61%
- DSCR
- 1.25
- GRM
- 8.0
CMA / ARV
- ARV (on-the-fly)
- $209,166
- Comps found
- 3
Show comp detail 3 sales within ~0.75 mi
| Address | Dist | Beds/Ba | Sqft | Sold | Price | $/sf | Match |
|---|---|---|---|---|---|---|---|
| 510 Mitchell Ave | 0.14mi | 3/2.0 (+1) | 1,594 (+8%) | 8mo | $226,000 | $142 | 64 |
| 229 Sherman Ave | 0.41mi | 2/1.0 | 1,260 (-14%) | 1mo | $167,000 | $133 | 56 |
| 517 Sunset Ave | 0.24mi | 3/2.0 (+1) | 1,602 (+9%) | 20mo | $288,000 | $180 | 48 |
Match score weights: distance 35% · size 25% · config 20% · recency 20%. Top-matched comps best support the ARV.
Projected returns pro-forma
-2.42% appreciation · 3.0% rent growth · sell at horizon
- IRR
- -5.0%
- Equity multiple
- 0.81×
- Total profit
- $-6,403
- Equity at exit
- $20,645
- IRR
- 3.7%
- Equity multiple
- 1.29×
- Total profit
- $9,662
- Equity at exit
- $15,521
Cash invested: $33,040 (down + closing). Projections, not guarantees.
Landlord ↔ Tenant lean methodology
- Overall (STATE)
- 38 Tenant-Leaning
- State Colorado
- 38 Tenant-Leaning · D+4
- County
- — inherits STATE
- City
- — inherits STATE
ZIP-level market 81063
- Home prices YoY
- -1.1%
- Active inventory
- 29
- Price-to-rent
- 8.0×
Monthly cashflow live
- Estimated rent
- $1,228 medium interval (Pro) →
- Mortgage (P&I)
- −$619
- Tax est. 1.5%
- −$148 /mo · $1,770/yr
- Insurance
- −$49
- HOA
- −$0
- Vacancy / Maint / Mgmt
- −$258
- Net cashflow
- $154
Break-even live
UW: 25.0% down · 7.5% · 30yr · 1.5% tax · 5.0% vac · 8.0% maint · 8.0% mgmt
Financing live
Cash to close
- Down payment
- $29,500
- Closing costs
- $3,540
- Reserves months
- —
- Total cash needed
- —
Loan-product check · same deal, 3 products live
Conventional
25% down · 7.5% · 30yr
- Down + closing
- —
- Monthly P&I
- —
- Monthly cashflow
- —
- DSCR
- —
- Eligible?
- —
Personal DTI + credit; lowest rate.
DSCR
20% down · 8.5% · 30yr
- Down + closing
- —
- Monthly P&I
- —
- Monthly cashflow
- —
- DSCR
- —
- Eligible?
- —
No personal income docs; deal must DSCR.
Hard money
10% down · 12.0% · 12mo
- Down + closing
- —
- Monthly P&I
- —
- Monthly cashflow
- —
- DSCR
- —
- Eligible?
- —
Short-term bridge; refi at stabilization.
Listing history 20 events
-
2026-06-19days on market $118,000 Active 93 DOM
-
2026-06-18days on market $118,000 Active 92 DOM
-
2026-06-17days on market $118,000 Active 91 DOM
-
2026-06-16days on market $118,000 Active 90 DOM
-
2026-06-15days on market $118,000 Active 89 DOM
-
2026-06-13days on market $118,000 Active 87 DOM
-
2026-06-12days on market $118,000 Active 86 DOM
-
2026-06-09days on market $118,000 Active 83 DOM
-
2026-06-08days on market $118,000 Active 82 DOM
-
2026-06-07days on market $118,000 Active 81 DOM
-
2026-06-04days on market $118,000 Active 77 DOM
-
2026-06-02days on market $118,000 Active 76 DOM
-
2026-06-01days on market $118,000 Active 75 DOM
-
2026-05-31days on market $118,000 Active 74 DOM
-
2026-05-31days on market $118,000 Active 73 DOM
-
2026-04-08status Active
-
2026-03-04$118,000 Active
-
2014-04-01soldstatus $34,000
-
2009-09-23$59,000
-
2007-04-20$59,900
ⓘ Source: listings_history table (triggers on properties + properties_extension) + one-shot
backfill from property_details.listing_events for pre-trigger history.
Nearby sold comps map
Loading sold comps map…
Walkable amenities ~0.75 mi
Loading nearby amenities…
Taxation est. · year 1
- Rental income
- $14,732
- − Mortgage interest
- −$6,610
- − Property taxes
- −$1,770
- − Insurance
- −$590
- − Repairs & maintenance
- −$1,179
- − Management
- −$1,179
- − Depreciation
- −$3,433
- Taxable loss
- −$28
- Est. tax savings @ 24.0%
- +$7
- After-tax cash flow
- $1,859/yr
For passive investors: Depreciation is non-cash, so a rental often shows a tax loss while cash-flowing — sheltering income. Rental losses are passive: they offset passive income freely, and up to $25,000/yr can offset ordinary (W-2) income if you actively participate and your MAGI is under $100k (phasing out to $0 by $150k); unused losses carry forward. On sale, claimed depreciation is recaptured at up to 25%, and gains may owe capital-gains tax (a 1031 exchange can defer both). Figures are a year-1 estimate at your 24.0% rate — not tax advice; consult a CPA.
Schools (NCES district)
- District
- Crowley County School District No. Re-1-J
- NCES district ID
- 0803210
- Math proficiency
- 16% ▼ -10.00%
- Reading proficiency
- 28% ▼ -12.00%
- Median HH income
- $35,031
- Composite
- 21.28/100
- National rank
- #13663
- State rank
- #150 of 176 in CO
Livability — Ordway
- Score
- 61/100
- State rank
- #233
- US rank
- #18425
Category grades
Schools grade is shown separately in the Schools card above.
Census & demographics
- Census place
- Ordway, CO
- Population (ZIP)
- 3,060
Population outlook (Crowley County) Hauer SSP2
- Today (2025)
- 5,612 people
- By 2030
- 5,725 · +2.0%
- By 2040
- 6,092 · +8.6%
- By 2050
- 6,391 · +13.9%
- By 2075
- 6,250 · +11.4%
- By 2100
- 5,349 · -4.7%
Race, ethnicity, and origin ACS 2023
- Neighborhood character
- Diverse neighborhood (Simpson 0.64)
- Race & ethnicity
- White 52% Hispanic / Latino 28% Two or more races 18% Black 7% Native American 6%
- Hispanic origin (detail)
- Mexican 11%
- Common ancestry
- Serbian 3% Portuguese 2% Iranian 1%
- Foreign-born
- 2% · Vietnam, Canada
- Languages at home
- 91% English-only · Spanish 8% Vietnamese 1%
Political lean MEDSL · Crowley
- 2024 margin
- Solid R (+47.4) · D 24.7% · R 72.2% · Other 3.1%
- 2008→2024 swing
- -20.2pp toward R · 2008: -27.2pp · 2024: -47.4pp
- All cycles
- 2024: R+47.4 2020: R+47.7 2016: R+48.5 2012: R+25.9 2008: R+27.2
Not yet ingested
- Civics
- —
Market trends
- HPI YoY
- ▼ -2.42%
- Current HPI
- 211.1097
- Rent YoY
- —
- Metro
- —
- State GDP YoY
- ▲ 1.95%
- F500 in state
- 14
Industry mix (Fortune 500 HQ in CO)
| Industry | F500 HQs | Revenue |
|---|---|---|
| Technology Distribution | 1 | $31B |
|
||
| Food / Agriculture | 1 | $18B |
|
||
| Packaging | 1 | $14B |
|
||
| Healthcare | 1 | $13B |
|
||
| Energy | 1 | $10B |
|
||
| Technology | 1 | $4B |
|
||
Price history
+97.0% since first listed5 events — show timeline
- 2026-04-08 Relisted — PARMLS
- 2026-03-04 Listed $118,000 PARMLS
- 2014-04-01 Sold (Public Records) $34,000 Public Records
- 2009-09-23 Listed $59,000 PARMLS
- 2007-04-20 Listed $59,900 PARMLS
Property tax history
+3.4%/yrLatest (2025): $213 · +110.5% YoY. Source: county tax records.
Cash-flow waterfall
monthlySold comps — $/sqft
last 12 mo · ≤1 miLoading sold comps…