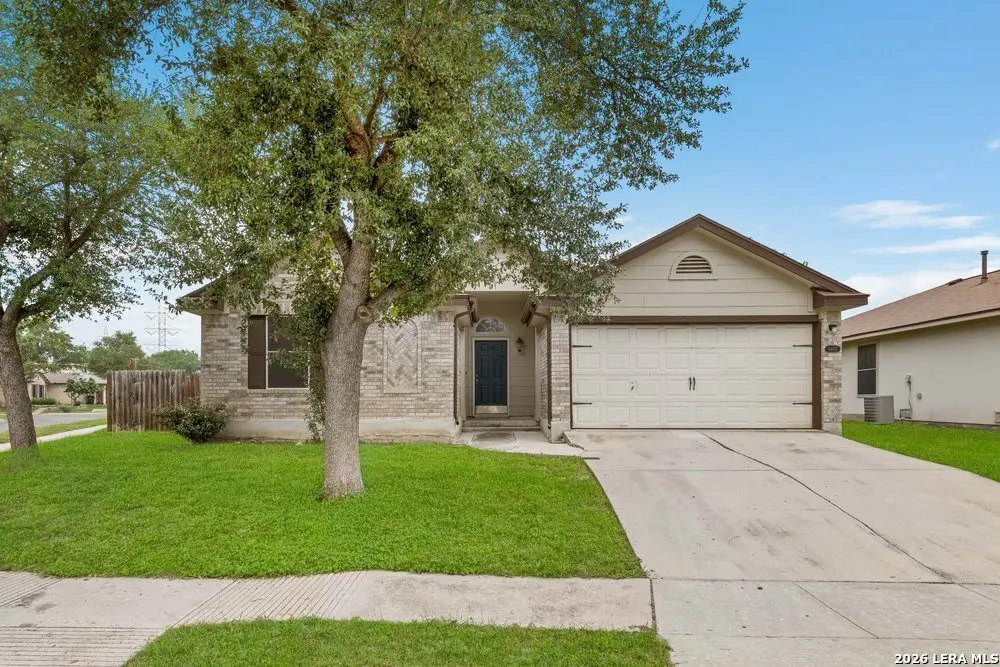
8403 Pigeonberry Dr · San Antonio, TX
Flood risk 1/10 · Minimal
- FEMA flood zone
- X (unshaded)
- Chance of flooding over 30 yrs
- 0.0%
- Est. flood insurance / yr
- $507 – $1,088
Fire risk 4/10 · Minor
- Est. fire insurance / yr
- $1,222 – $2,270
Heat risk 8/10 · Major
- Hot days now (above 108°F)
- 7 days/yr
- Hot days in 30 yrs
- 22 days/yr
Wind risk 8/10 · Major
- Chance of severe wind over 30 yrs
- 80.0%
Air-quality risk 1/10 · Minimal
- Unhealthy air days now
- 0 days/yr
- Unhealthy air days in 30 yrs
- 0 days/yr
Risk factors via First Street. Map © Google.
Why this score? — see what drove the D- grade
The composite is a weighted blend of 9 inputs, each scored 0–100. Each bar is that input's sub-score; the figure is the points it added to the 100-point composite (weight × sub-score).
- ARV discount +12.6/15.0
- Cash flow +9.1/30.0
- Livability +4.0/5.0
- 1% rule +3.4/10.0
- DSCR +2.5/10.0
- Condition / age +2.5/5.0
- Schools +2.4/10.0
- Rent growth +2.2/5.0
- Appreciation +0.0/10.0
$220,000
🖨 Deal sheet (PDF) 📄 Offer letter ✓ Due diligence
Listing remarks MLS
Very nice single story home on a large corner lot with no neighbors behind! Fresh interior paint! Tile in wet areas, carpet in bedrooms and laminate wood elsewhere! Private study/nursery with french doors off the master bedroom! Corner fireplace in living room! Large kitchen with lots of cabinets and a gas range! Open floorplan with high ceilings! Separate dining room! Dual closets in the master bath! Very clean and move in ready! Get here quick, won't last long!
Key facts
- Move-in ready
- Convenient location
- 8,886 sq ft lot
Tags
Property features AI
Finance
- HOA & community: Mandatory HOA; HOA fee $175 annually; Association transfer fee $275
Exterior
- Parking: 2-car garage
- Utilities: Water system available; Sewer system available
- Home design: Pre-owned single-family home; Approximately 22 years old
- Construction: Slab foundation; Composition roof
- Exterior features: Brick and siding exterior; Subdivision: Escondido Creek; Pool and basketball court in community
Interior
- Kitchen: Kitchen (12 x 12); Stove/Range; Dishwasher; Custom cabinets
- Bedrooms: Master bedroom on lower level with walk-in closet, multiple closets, ceiling fan, and full bath (16 x 12); Bedroom 2 (12 x 12); Bedroom 3 (12 x 12)
- Flooring: Carpeting; Laminate flooring
- Bathrooms: Two full bathrooms total; Master bathroom with tub/shower combination and double vanity (10 x 6)
- Heating & cooling: Central heating (natural gas); Central air conditioning
- Interior features: Ceiling fans; Washer and dryer connections; Gas water heater; Custom cabinets; Open floor plan; High ceilings; Utility room inside; Separate dining room; Study/library; One living area; All bedrooms on lower level
- Laundry & utility: Washer connection; Dryer connection; Utility room inside
Neighborhood map
What this means for you Summary
Snapshot
- This is a 3-bed/2.0-bath single-family listed at $220k.
Deal economics
- At list price, monthly cash flow is $-168 ($-2k/yr) — negative.
- To cash-flow at today's rent, offer at most $190k (13.5% below list).
- To meet the 1% rule (rent ≥ 1% of price), the offer needs to be $184k (16.4% below list).
- Recommended offer: $184k (16.4% below list) — sets the bar for 1% rule.
- Cap rate 5.4% vs local median 3.8% in San Antonio — top-decile yield for the area; either an underpriced asset or a hidden risk that comps aren't pricing in. Stress-test before assuming the spread holds.
Location & tenants
- Location reads 80/100 on livability (#31 in TX, #1,616 nationally) — a professional / high-income tenant draw. Strengths: amenities A+, commute A+, cost of living A+; Watch: crime F.
- Judson ISD (suburban): math 21% / reading 33% proficiency, ranked #660 of 826 in TX (top 80%) — low school quality limits family demand, transient renter base, plan for 1-2y turnover.
- Zoned schools: James L Masters (math 17% / reading 32%, grade F, #3,052 of 4,322 statewide, top 74%, 802 students, 66% FRL); Henry Metzger Middle (math 12% / reading 20%, grade F, #1,543 of 1,662 statewide, top 94%, 953 students, 90% FRL); Karen Wagner H S (math 12% / reading 29%, grade F, #1,389 of 1,632 statewide, top 86%, 2,366 students, 80% FRL) — zoned schools average 79% FRL vs 57% district-wide (22 pts higher); higher-poverty schools than district average — tighter screening recommended.
- Market conditions: Rents soft (-1.1%/yr); 1207 active listings in the ZIP; 40 comparable units currently listed for rent nearby; rentals at typical pace (median 18d on market — plan ~3-4 weeks tenant-placement turnaround); solid renter incomes; 8,308 units permitted in Bexar County in 2024 (2,506 in 5+ unit buildings).
Forward outlook
- Local home prices are declining (-3.0%/yr); year-one equity from $2k of loan paydown is wiped out by about $7k of value loss. Plan a longer hold.
- Bexar County population projected at +50% by 2050 — long-run rental-demand tailwind backs the buy-and-hold thesis.
Negotiation context
- It's been on market 39 days — a 3% lower offer ($213k) is reasonable based on typical stale-listing flexibility.
- 5 sale attempts since 19y ago with the ask held roughly flat each time — persistent listings suggest the price (not the market) is what's stuck; bring a comps-based counter.
Risks & watch-outs
- Climate carrying-cost: severe wind risk, 80% chance of damaging wind over 30y; extreme-heat days projected 7→22/yr by 2055 (HVAC capex compounding) — expect insurance premiums to compound above CPI over the hold.
Questions for the listing agent
- What do current leases actually rent for vs. the listed asking? Can we see a recent rent roll and the last 12 months of T-12 income?
- It's been on market 39 days. Have you received any prior offers? Is the seller open to a 16% concession, seller financing, or rate buy-down credit?
- What does the HOA fee cover, when was the last increase, and are there any pending special assessments or reserve-fund shortfalls?
- Is there a deadline driving the sale (1031 exchange, divorce, estate, relocation)? That informs how much negotiation room exists.
- Crime grade is F in this area — have there been break-ins, vandalism, or insurance claims at this property in the last 3 years? What carrier currently insures it and at what premium?
- The area grade is low — what's the realistic commute time and amenity access for the typical tenant pool here? Any planned neighborhood developments (good or bad) we should know about?
- What's the average days-on-market for RENTAL listings here right now (not sales)? A rising rental-DOM trend means longer vacancies and softer asking-rent achievability than the comps imply.
- What's the recent tenant-quality profile in this submarket — average credit score on applications, eviction rate, late-payment / NSF rate, and stable-employment percentage? A property-management company in the area should have these aggregated.
- How much new for-sale + rental construction is in the pipeline within 1–3 miles? Heavy new supply typically softens prices + rents 12–24 months out; constrained supply supports both.
Investment metrics
- 1% rule
- 0.84% ✗
- Cap rate
- 5.38%
- Cash-on-cash
- -3.26%
- DSCR
- 0.85
- GRM
- 10.0
CMA / ARV
- ARV (median comp)
- $248,174
- List price
- $220,000
- Delta
- -11.35%
- Verdict
- UNDERPRICED
- Comps
- 20 within 1.0 mi
Show comp detail 12 sales within ~0.75 mi
| Address | Dist | Beds/Ba | Sqft | Sold | Price | $/sf | Match |
|---|---|---|---|---|---|---|---|
| 4102 Texas Palm Dr | 0.10mi | 4/2.5 (+1) | 1,941 (+0%) | 2mo | $250,000 | $129 | 86 |
| 3845 Mistflower | 0.26mi | 4/2.5 (+1) | 1,934 (+0%) | 0mo | $229,990 | $119 | 80 |
| 3914 Bacall Way | 0.41mi | 3/2.0 | 1,903 (-2%) | 3mo | $279,900 | $147 | 76 |
| 4447 Tivoli | 0.26mi | 3/2.5 | 1,772 (-8%) | 3mo | $240,000 | $135 | 70 |
| 8423 Snakeweed Dr | 0.25mi | 3/2.0 | 1,668 (-14%) | 3mo | $245,000 | $147 | 63 |
| 8706 Joshua Tree | 0.55mi | 3/2.5 | 2,031 (+5%) | 1mo | $250,000 | $123 | 63 |
| 8630 Spotted Owl | 0.42mi | 3/2.5 | 2,096 (+8%) | 2mo | $260,000 | $124 | 62 |
| 8411 Favero Cv | 0.41mi | 4/2.0 (+1) | 1,742 (-10%) | 4mo | $195,720 | $112 | 56 |
| 8619 Key North | 0.42mi | 3/2.5 | 1,701 (-12%) | 3mo | $184,777 | $109 | 56 |
| 3963 Bacall | 0.41mi | 3/2.0 | 1,654 (-14%) | 2mo | $264,900 | $160 | 54 |
| 7927 Hatchmere | 0.55mi | 3/2.0 | 1,656 (-14%) | 1mo | $249,999 | $151 | 49 |
| 8517 Terlingua Cv | 0.64mi | 4/2.0 (+1) | 1,674 (-13%) | 1mo | $230,000 | $137 | 42 |
Match score weights: distance 35% · size 25% · config 20% · recency 20%. Top-matched comps best support the ARV.
Projected returns pro-forma
-3.0% appreciation · 0.0% rent growth · sell at horizon
- IRR
- -25.4%
- Equity multiple
- 0.16×
- Total profit
- $-51,620
- Equity at exit
- $32,803
- IRR
- -36.1%
- Equity multiple
- -0.29×
- Total profit
- $-79,161
- Equity at exit
- $19,022
Cash invested: $61,600 (down + closing). Projections, not guarantees.
Landlord ↔ Tenant lean methodology
- Overall (STATE)
- 87 Strongly Landlord-Friendly
- State Texas
- 87 Strongly Landlord-Friendly · R+5
- County
- — inherits STATE
- City
- — inherits STATE
ZIP-level market 78109
- Home prices YoY
- -17.8%
- Rents YoY
- -1.1%
- Active inventory
- 1207
- Price-to-rent
- 10.0×
Monthly cashflow live
- Estimated rent
- $1,840 high interval (Pro) →
- Mortgage (P&I)
- −$1,154
- Tax from tax record
- −$361 /mo · $4,327/yr
- Insurance
- −$92
- HOA
- −$15
- Vacancy / Maint / Mgmt
- −$386
- Net cashflow
- $-168
Break-even live
Sensitivity live
| Price | -10% $-43 | -5% $-105 | +0% $-168 | +5% $-230 | +10% $-292 |
|---|---|---|---|---|---|
| Rent | -10% $-313 | -5% $-240 | +0% $-168 | +5% $-95 | +10% $-22 |
| Rate | -1.0pp $-57 | -0.5pp $-112 | base $-168 | +0.5pp $-225 | +1.0pp $-283 |
UW: 25.0% down · 7.5% · 30yr · 1.5% tax · 5.0% vac · 8.0% maint · 8.0% mgmt
Financing live
Cash to close
- Down payment
- $55,000
- Closing costs
- $6,600
- Reserves months
- —
- Total cash needed
- —
Loan-product check · same deal, 3 products live
Conventional
25% down · 7.5% · 30yr
- Down + closing
- —
- Monthly P&I
- —
- Monthly cashflow
- —
- DSCR
- —
- Eligible?
- —
Personal DTI + credit; lowest rate.
DSCR
20% down · 8.5% · 30yr
- Down + closing
- —
- Monthly P&I
- —
- Monthly cashflow
- —
- DSCR
- —
- Eligible?
- —
No personal income docs; deal must DSCR.
Hard money
10% down · 12.0% · 12mo
- Down + closing
- —
- Monthly P&I
- —
- Monthly cashflow
- —
- DSCR
- —
- Eligible?
- —
Short-term bridge; refi at stabilization.
Rent comps 40 comps
| Address | Beds | Baths | Sqft | Rent | $/sqft | DOM | Units | Dist |
|---|---|---|---|---|---|---|---|---|
| 8422 Cherisse Dr Converse, TX | 3.0 | 2.0 | 1436 | $1,681 | $1.17 | 0d | 1 | 0.12mi |
| 8514 Whitebrush Converse, TX | 3.0 | 2.0 | 1535 | $1,700 | $1.11 | 25d | 1 | 0.15mi |
| 8215 Torchwood Dr Converse, TX | 4.0 | 2.0 | 1958 | $1,900 | $0.97 | 45d | 1 | 0.16mi |
| 8411 Crinum Lily Dr Converse, TX | 3.0 | 2.0 | 1259 | $1,550 | $1.23 | 25d | 1 | 0.17mi |
| 8329 Kinclaven Ct Converse, TX | 4.0 | 2.0 | 1418 | $1,895 | $1.34 | 0d | 1 | 0.22mi |
| 8423 Snakeweed Dr Unit 1 Converse, TX | 3.0 | 2.0 | 1668 | $1,500 | $0.90 | 45d | 1 | 0.22mi |
| 8531 Rita Blanca St Converse, TX | 4.0 | 2.5 | 1941 | $1,700 | $0.88 | 16d | 1 | 0.27mi |
| 8519 Snakeweed Dr Converse, TX | 3.0 | 2.0 | 1259 | $1,450 | $1.15 | 14d | 1 | 0.29mi |
| 4330 Gambels Quail Converse, TX | 3.0 | 2.5 | 2240 | $1,695 | $0.76 | 25d | 1 | 0.37mi |
| 3947 West Way Key W Converse, TX | 4.0 | 2.5 | 2338 | $1,841 | $0.79 | 0d | 1 | 0.38mi |
| 3922 West Way Key W Converse, TX | 3.0 | 2.0 | 1981 | $2,300 | $1.16 | 6d | 1 | 0.38mi |
| 4660 Via Sonoma Trl Converse, TX | 3.0 | 2.5 | 2098 | $1,900 | $0.91 | 45d | 1 | 0.39mi |
| 8611 Key Windy Way Unit 2 Converse, TX | 3.0 | 2.5 | 1514 | $1,850 | $1.22 | 3d | 1 | 0.40mi |
| 8611 Key Windy Way Unit 2 Converse, TX | 3.0 | 2.5 | 1514 | $1,850 | $1.22 | 45d | 1 | 0.40mi |
| 8411 Favero Cv Converse, TX | 4.0 | 2.0 | 1668 | $1,695 | $1.02 | 45d | 1 | 0.45mi |
| 8639 Key Windy Way Unit 1 Converse, TX | 3.0 | 2.5 | 1225 | $1,475 | $1.20 | 25d | 1 | 0.46mi |
| 8639 Key Windy Way Converse, TX | 3.0 | 2.5 | 1225 | $1,475 | $1.20 | 6d | 1 | 0.46mi |
| 4315 Roundhay Park Converse, TX | 3.0 | 2.0 | 1976 | $2,800 | $1.42 | 25d | 1 | 0.59mi |
| 4931 Badland Beacon Converse, TX | 3.0 | 2.0 | 1509 | $1,625 | $1.08 | 0d | 1 | 0.59mi |
| 4931 Badland Beacon Converse, TX | 3.0 | 2.0 | 1509 | $1,625 | $1.08 | 45d | 1 | 0.59mi |
| 4746 Gambels Quail Converse, TX | 3.0 | 2.5 | 2214 | $1,695 | $0.77 | 4d | 1 | 0.62mi |
| 5118 Everett Loop Converse, TX | 4.0 | 2.0 | 1635 | $1,599 | $0.98 | 16d | 1 | 0.72mi |
| 8511 Cassia Cv Converse, TX | 3.0 | 2.0 | 1910 | $1,700 | $0.89 | 45d | 1 | 0.72mi |
| 8902 Grand Western Converse, TX | 3.0 | 2.5 | 1570 | $1,995 | $1.27 | 45d | 1 | 0.75mi |
| 8511 Amistad Cv Converse, TX | 3.0 | 2.0 | 1440 | $1,479 | $1.03 | 6d | 1 | 0.78mi |
| 7703 Redstone Mnr Converse, TX | 3.0 | 2.0 | 1656 | $1,750 | $1.06 | 25d | 1 | 0.79mi |
| 8907 Arundal Gdn Converse, TX | 3.0 | 2.0 | 1921 | $1,895 | $0.99 | 19d | 1 | 0.82mi |
| 8555 Barefoot Ln Converse, TX | 3.0 | 2.5 | 1780 | $2,050 | $1.15 | 25d | 1 | 0.83mi |
| 8931 Arundal Gdn Converse, TX | 4.0 | 2.5 | 2507 | $2,300 | $0.92 | 14d | 1 | 0.85mi |
| 7715 Shining Glow San Antonio, TX | 3.0 | 2.5 | 1554 | $1,529 | $0.98 | 17d | 1 | 0.86mi |
| 7715 Shining Glow San Antonio, TX | 3.0 | 2.5 | 1554 | $1,499 | $0.96 | 5d | 1 | 0.86mi |
| 9026 Bowring Park Converse, TX | 3.0 | 2.0 | 1721 | $1,795 | $1.04 | 45d | 1 | 0.88mi |
| 9110 Longhorn Park Converse, TX | 3.0 | 2.0 | 1646 | $1,675 | $1.02 | 17d | 1 | 0.89mi |
| 9110 Longhorn Park Converse, TX | 3.0 | 2.0 | 1646 | $1,675 | $1.02 | 14d | 1 | 0.89mi |
| 8907 Ladbroke Grv Converse, TX | 3.0 | 2.0 | 1921 | $1,900 | $0.99 | 3d | 1 | 0.89mi |
| 7923 Horse Holw San Antonio, TX | 3.0 | 2.0 | 1916 | $1,599 | $0.83 | 4d | 1 | 0.89mi |
| 7718 Burro Bnd San Antonio, TX | 3.0 | 2.5 | 1547 | $1,650 | $1.07 | 5d | 1 | 0.89mi |
| 5475 Bluebell Mdw Converse, TX | 3.0 | 2.5 | 1605 | $1,695 | $1.06 | 45d | 1 | 0.89mi |
| 5514 Soothing Water San Antonio, TX | 3.0 | 2.5 | 1700 | $1,750 | $1.03 | 5d | 1 | 0.94mi |
| 4715 Appaloosa Run San Antonio, TX | 3.0 | 2.5 | 1774 | $1,595 | $0.90 | 17d | 1 | 0.95mi |
HOA detail
- Monthly dues
- $15 · $180/yr
- Likely covers
- gas
Listing history 29 events
-
2026-06-21days on market $220,000 Active 39 DOM
-
2026-06-18days on market $220,000 Active 36 DOM
-
2026-06-17days on market $220,000 Active 35 DOM
-
2026-06-16days on market $220,000 Active 34 DOM
-
2026-06-15days on market $220,000 Active 33 DOM
-
2026-06-13days on market $220,000 Active 31 DOM
-
2026-06-09days on market $220,000 Active 27 DOM
-
2026-06-08days on market $220,000 Active 26 DOM
-
2026-06-07days on market $220,000 Active 25 DOM
-
2026-06-04days on market $220,000 Active 22 DOM
-
2026-06-03days on market $220,000 Active 21 DOM
-
2026-06-02days on market $220,000 Active 20 DOM
-
2026-06-01days on market $220,000 Active 19 DOM
-
2026-05-31days on market $220,000 Active 18 DOM
-
2026-05-13$220,000 New 688-char remark
-
2024-03-05historical
-
2024-01-25price $270,000
-
2024-01-14$285,000 New
-
2015-07-30soldstatus
-
2015-07-24soldstatus Sold
Show marketing remark (477 chars)
Very nice single story home on a large corner lot with no neighbors behind! Fresh interior paint! Tile in wet areas, carpet in bedrooms and laminate wood elsewhere! Private study/nursery with french doors off the master bedroom! Corner fireplace in living room! Large kitchen with lots of cabinets and a gas range! Open floorplan with high ceilings! Separate dining room! Dual closets in the master bath! Very clean and move in ready! Get here quick, won't last long!
-
2015-07-10status Pending SB
Show marketing remark (477 chars)
Very nice single story home on a large corner lot with no neighbors behind! Fresh interior paint! Tile in wet areas, carpet in bedrooms and laminate wood elsewhere! Private study/nursery with french doors off the master bedroom! Corner fireplace in living room! Large kitchen with lots of cabinets and a gas range! Open floorplan with high ceilings! Separate dining room! Dual closets in the master bath! Very clean and move in ready! Get here quick, won't last long!
-
2015-06-23historical Active Option
Show marketing remark (477 chars)
Very nice single story home on a large corner lot with no neighbors behind! Fresh interior paint! Tile in wet areas, carpet in bedrooms and laminate wood elsewhere! Private study/nursery with french doors off the master bedroom! Corner fireplace in living room! Large kitchen with lots of cabinets and a gas range! Open floorplan with high ceilings! Separate dining room! Dual closets in the master bath! Very clean and move in ready! Get here quick, won't last long!
-
2015-06-19$154,900 New
Show marketing remark (477 chars)
Very nice single story home on a large corner lot with no neighbors behind! Fresh interior paint! Tile in wet areas, carpet in bedrooms and laminate wood elsewhere! Private study/nursery with french doors off the master bedroom! Corner fireplace in living room! Large kitchen with lots of cabinets and a gas range! Open floorplan with high ceilings! Separate dining room! Dual closets in the master bath! Very clean and move in ready! Get here quick, won't last long!
-
2009-11-24soldstatus
-
2009-11-13soldstatus
-
2009-10-01historical
-
2009-09-12$124,999
-
2007-07-02historical
-
2007-04-10$140,000
ⓘ Source: listings_history table (triggers on properties + properties_extension) + one-shot
backfill from property_details.listing_events for pre-trigger history.
Tax reassessment forecast TX · Resets to sale price
- Current annual tax
- $4,327 · $361/mo
- Projected year-2 tax
- $4,327 · $361/mo
- Expected delta
- $0/yr ($0/mo · 0.0%)
ⓘ Screening estimate from a state-policy table — verify with the county assessor before closing.
Climate risk First Street
- Flood 1/10 Low FEMA zone X (unshaded) · 0% chance over 30 yrs
- Wildfire 4/10 Moderate
- Heat 8/10 Severe 7 d/yr ≥108°F today · 22 d/yr by 30 yrs out
- Wind 8/10 Severe 80% chance of damaging wind over 30 yrs
- Air quality 1/10 Low 0 unhealthy d/yr today · 0 by 30 yrs out
Nearby sold comps map
Loading sold comps map…
Walkable amenities ~0.75 mi
Loading nearby amenities…
Taxation est. · year 1
- Rental income
- $22,078
- − Mortgage interest
- −$12,323
- − Property taxes
- −$4,327
- − Insurance
- −$1,100
- − Repairs & maintenance
- −$1,766
- − Management
- −$1,766
- − HOA
- −$180
- − Depreciation
- −$6,400
- Taxable loss
- −$5,785
- Est. tax savings @ 24.0%
- +$1,388
- After-tax cash flow
- $-622/yr
For passive investors: Depreciation is non-cash, so a rental often shows a tax loss while cash-flowing — sheltering income. Rental losses are passive: they offset passive income freely, and up to $25,000/yr can offset ordinary (W-2) income if you actively participate and your MAGI is under $100k (phasing out to $0 by $150k); unused losses carry forward. On sale, claimed depreciation is recaptured at up to 25%, and gains may owe capital-gains tax (a 1031 exchange can defer both). Figures are a year-1 estimate at your 24.0% rate — not tax advice; consult a CPA.
Schools (NCES district)
- District
- Judson ISD
- NCES district ID
- 4824990
- Math proficiency
- 21% ▼ -21.00%
- Reading proficiency
- 33% ▼ -7.00%
- Median HH income
- $57,542
- Composite
- 24.39/100
- National rank
- #7689
- State rank
- #660 of 826 in TX
Livability — San Antonio
- Score
- 80/100
- State rank
- #31
- US rank
- #1616
Category grades
Schools grade is shown separately in the Schools card above.
Census & demographics
- County
- Bexar County · 1,990,555 people
- City population
- 1,806,925
- Metro
- San Antonio-New Braunfels, TX
- Population (ZIP)
- 63,067
- Household income
- $91,320
- Rent vs Own
- Severe rent burden
- 1732.0
Population outlook (Bexar County) Hauer SSP2
- Today (2025)
- 2,336,851 people
- By 2030
- 2,560,728 · +9.6%
- By 2040
- 3,020,569 · +29.3%
- By 2050
- 3,493,522 · +49.5%
- By 2075
- 4,668,459 · +99.8%
- By 2100
- 5,533,242 · +136.8%
Race, ethnicity, and origin ACS 2023
- Neighborhood character
- Diverse neighborhood (Simpson 0.69)
- Race & ethnicity
- Hispanic / Latino 44% White 27% Two or more races 21% Black 21% Asian 3%
- Hispanic origin (detail)
- Mexican 29% Puerto Rican 4%
- Common ancestry
- Lithuanian 1% Romanian 1% Italian 1%
- Foreign-born
- 11% · Canada, Vietnam, South Korea
- Languages at home
- 71% English-only · Spanish 23% Tagalog/Filipino 1% Other Asian/Pacific 1%
Political lean MEDSL · Bexar
- 2024 margin
- Lean D (+9.8) · D 54.3% · R 44.6% · Other 1.1%
- 2008→2024 swing
- +4.2pp toward D · 2008: 5.6pp · 2024: 9.8pp
- All cycles
- 2024: D+9.8 2020: D+18.2 2016: D+13.5 2012: D+4.6 2008: D+5.6
Not yet ingested
- Civics
- —
Market trends
- HPI YoY
- ▼ -51.02%
- Current HPI
- 236.4923
- Rent YoY
- ▼ -1.08%
- Metro
- San Antonio-New Braunfels, TX
- State GDP YoY
- ▲ 3.95%
- F500 in state
- 110
Industry mix (Fortune 500 HQ in TX)
| Industry | F500 HQs | Revenue |
|---|---|---|
| Energy | 16 | $1,198B |
|
||
| Technology | 5 | $198B |
|
||
| Engineering / Construction | 4 | $72B |
|
||
| Energy Services | 3 | $60B |
|
||
| Utilities | 3 | $41B |
|
||
| Healthcare | 2 | $330B |
|
||
Price history
+57.1% since first listed15 events — show timeline
- 2026-05-13 Listed $220,000 LERA
- 2024-03-05 Listing Removed — LERA
- 2024-01-25 Price Changed $270,000 LERA
- 2024-01-14 Listed $285,000 LERA
- 2015-07-30 Sold (Public Records) — Public Records
- 2015-07-24 Sold (MLS) — LERA
- 2015-07-10 Pending — LERA
- 2015-06-23 Contingent — LERA
- 2015-06-19 Listed $154,900 LERA
- 2009-11-24 Sold (Public Records) — Public Records
- 2009-11-13 Sold (MLS) — LERA
- 2009-10-01 Listing Removed — LERA
- 2009-09-12 Listed $124,999 LERA
- 2007-07-02 Listing Removed — LERA
- 2007-04-10 Listed $140,000 LERA
Property tax history
+11.9%/yrLatest (2025): $4,327 · -17.2% YoY. Source: county tax records.
Cash-flow waterfall
monthlySold comps — $/sqft
last 12 mo · ≤1 miLoading sold comps…