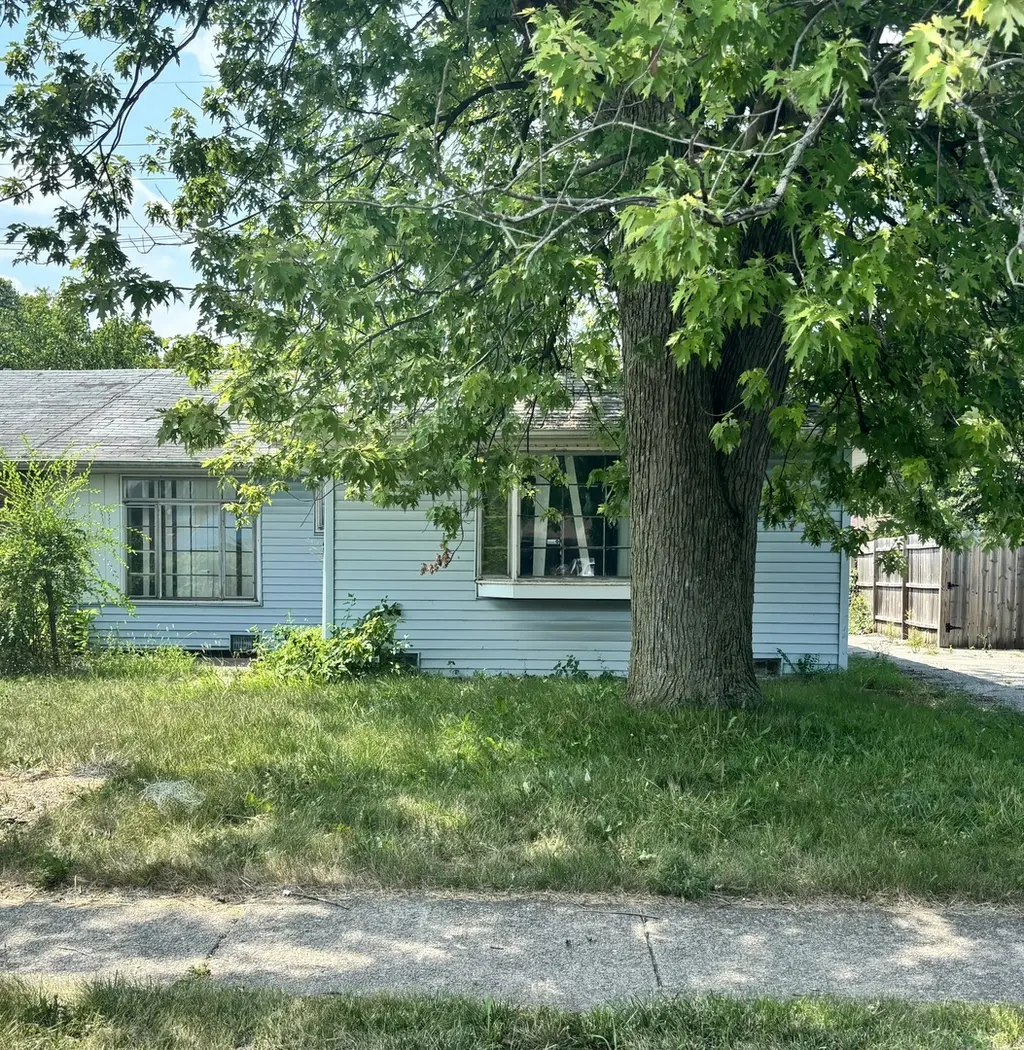
14044 S Grace Ave · Robbins, IL
Flood risk 1/10 · Minimal
- FEMA flood zone
- X (unshaded)
- Chance of flooding over 30 yrs
- 0.0%
- Est. flood insurance / yr
- $473 – $860
Fire risk 1/10 · Minimal
- Est. fire insurance / yr
- $804 – $1,492
Heat risk 3/10 · Minor
- Hot days now (above 102°F)
- 7 days/yr
- Hot days in 30 yrs
- 15 days/yr
Wind risk 2/10 · Minimal
- Chance of severe wind over 30 yrs
- —
Air-quality risk 3/10 · Minor
- Unhealthy air days now
- 4 days/yr
- Unhealthy air days in 30 yrs
- 4 days/yr
Risk factors via First Street. Map © Google.
Why this score? — see what drove the C- grade
The composite is a weighted blend of 9 inputs, each scored 0–100. Each bar is that input's sub-score; the figure is the points it added to the 100-point composite (weight × sub-score).
- Cash flow +15.0/30.0
- Appreciation +10.0/10.0
- ARV discount +7.5/15.0
- 1% rule +5.0/10.0
- DSCR +5.0/10.0
- Livability +3.3/5.0
- Rent growth +2.5/5.0
- Condition / age +2.5/5.0
- Schools +1.6/10.0
$42,900
🖨 Deal sheet 📄 Offer letter ✓ Due diligence
Listing remarks MLS
Investor special located in Robbins, IL! Spacious 4-bedroom 1.5 bath with a potential for a 5th bedroom. Ideal for investors looking to buy and hold or fix and flip. With strong rental income potential or resale value, this property is a smart addition to any portfolio. Schedule your private showing today.
Key facts
- 4 parking spots
- Built 1955
- Listed 283 days
Neighborhood map
What this means for you Summary
Snapshot
- This is a 3-bed/1.0-bath townhouse listed at $43k.
Deal economics
- At list price, monthly cash flow is $1k ($12k/yr) — positive.
- The deal already cash-flows at list — no discount required.
- Meets the 1% rule at list price ($2k rent vs $43k).
- Recommended offer: $38k (12.0% below list) — sets the bar for market timing.
Location & tenants
- Location reads 66/100 on livability (#583 in IL) — a middle-class / working-renter tenant base. Strengths: commute A+, cost of living A+, housing A+; Watch: crime D+, schools F, amenities F.
- Chsd 218 (suburban): math 14% / reading 20% proficiency, ranked #454 of 620 in IL (top 73%) — low school quality limits family demand, transient renter base, plan for 1-2y turnover.
- Market conditions: 28 active listings in the ZIP; 4 comparable units currently listed for rent nearby; rentals leasing fast (median 7d on market — plan ~1-2 weeks tenant-placement turnaround); 6,272 units permitted in Cook County in 2024 (4,658 in 5+ unit buildings).
Forward outlook
- In year one you build about $5k of equity ($297 loan paydown + $4k appreciation (10.0% local appreciation)).
- At projected returns (10.0% appreciation + 3.0% rent growth), your $12k cash investment doubles in ~1 year — after that, you're playing with house money.
- By year 7, paydown + projected appreciation supports a ~$33k cash-out refi (75% LTV) — recoverable capital for the next deal without selling this one.
Negotiation context
- It's been on market 283 days — a 12% lower offer ($38k) is reasonable based on typical stale-listing flexibility.
- 2 sale attempts; this cycle's ask has dropped $17k (28%) from the opening price — seller is motivated, your offer sets the floor, not the list.
Risks & watch-outs
- Watch-outs: property tax is 4.7% of price; built in 1955 — expect roof / HVAC / electrical / plumbing capex.
Questions for the listing agent
- It's been on market 283 days. Have you received any prior offers? Is the seller open to a 12% concession, seller financing, or rate buy-down credit?
- Built in 1955 — when were the roof, HVAC, electrical panel, plumbing, and water heater last replaced?
- Property tax is high relative to price — has the assessment been appealed recently, and will the sale trigger a re-assessment?
- Why hasn't it sold? Are there any deal-killer items the seller is aware of (foundation, flood, title, zoning, code violations)?
- Is there a deadline driving the sale (1031 exchange, divorce, estate, relocation)? That informs how much negotiation room exists.
- Schools are F-rated, which usually means shorter tenancies and higher turnover. Who's the typical renter profile here, and what's been the actual vacancy rate?
- Crime grade is D in this area — have there been break-ins, vandalism, or insurance claims at this property in the last 3 years? What carrier currently insures it and at what premium?
- What's the average days-on-market for RENTAL listings here right now (not sales)? A rising rental-DOM trend means longer vacancies and softer asking-rent achievability than the comps imply.
- What's the recent tenant-quality profile in this submarket — average credit score on applications, eviction rate, late-payment / NSF rate, and stable-employment percentage? A property-management company in the area should have these aggregated.
- How much new for-sale + rental construction is in the pipeline within 1–3 miles? Heavy new supply typically softens prices + rents 12–24 months out; constrained supply supports both.
Investment metrics
- 1% rule
- 4.27% ✓
- Cap rate
- 35.26%
- Cash-on-cash
- 103.46%
- DSCR
- 5.60
- GRM
- 2.0
CMA / ARV
- ARV (median comp)
- $195,275
- List price
- $42,900
- Delta
- -78.03%
- Verdict
- UNDERPRICED
- Comps
- 3 within 1.0 mi
Show comp detail 7 sales within ~0.75 mi
| Address | Dist | Beds/Ba | Sqft | Sold | Price | $/sf | Match |
|---|---|---|---|---|---|---|---|
| 3226 W Lydia Ave | 0.08mi | 3/1.0 | 937 (0%) | 8mo | $133,500 | $142 | 89 |
| 3206 W Lydia Ave | 0.05mi | 3/1.0 | 931 (-1%) | 10mo | $105,000 | $113 | 89 |
| 3210 Mcbreen Ave | 0.18mi | 3/1.0 | 937 (0%) | 5mo | $50,000 | $53 | 87 |
| 14032 S Grace Ave | 0.05mi | 3/1.0 | 937 (0%) | 15mo | $105,000 | $112 | 85 |
| 14028 S Grace Ave | 0.06mi | 3/1.5 | 950 (+1%) | 13mo | $34,000 | $36 | 82 |
| 3223 S Lydia Ave | 0.11mi | 3/1.0 | 937 (0%) | 15mo | $143,500 | $153 | 82 |
| 3224 W Lydia Ave | 0.09mi | 3/1.0 | 931 (-1%) | 18mo | $54,000 | $58 | 80 |
Match score weights: distance 35% · size 25% · config 20% · recency 20%. Top-matched comps best support the ARV.
Projected returns pro-forma
10.0% appreciation · 3.0% rent growth · sell at horizon
- IRR
- —
- Equity multiple
- 8.44×
- Total profit
- $89,420
- Equity at exit
- $38,648
- IRR
- —
- Equity multiple
- 18.62×
- Total profit
- $211,656
- Equity at exit
- $83,345
Cash invested: $12,012 (down + closing). Projections, not guarantees.
Landlord ↔ Tenant lean methodology
- Overall (STATE)
- 43 Moderately Tenant-Leaning
- State Illinois
- 43 Moderately Tenant-Leaning · D+7
- County
- — inherits STATE
- City
- — inherits STATE
ZIP-level market 60472
- Home prices YoY
- 3.5%
- Active inventory
- 28
- Price-to-rent
- 2.0×
Monthly cashflow live
- Estimated rent
- $1,832 medium interval (Pro) →
- Mortgage (P&I)
- −$225
- Tax from tax record
- −$169 /mo · $2,026/yr
- Insurance
- −$18
- HOA
- −$0
- Vacancy / Maint / Mgmt
- −$385
- Net cashflow
- $1,036
Break-even live
UW: 25.0% down · 7.5% · 30yr · 1.5% tax · 5.0% vac · 8.0% maint · 8.0% mgmt
Financing live
Cash to close
- Down payment
- $10,725
- Closing costs
- $1,287
- Reserves months
- —
- Total cash needed
- —
Loan-product check · same deal, 3 products live
Conventional
25% down · 7.5% · 30yr
- Down + closing
- —
- Monthly P&I
- —
- Monthly cashflow
- —
- DSCR
- —
- Eligible?
- —
Personal DTI + credit; lowest rate.
DSCR
20% down · 8.5% · 30yr
- Down + closing
- —
- Monthly P&I
- —
- Monthly cashflow
- —
- DSCR
- —
- Eligible?
- —
No personal income docs; deal must DSCR.
Hard money
10% down · 12.0% · 12mo
- Down + closing
- —
- Monthly P&I
- —
- Monthly cashflow
- —
- DSCR
- —
- Eligible?
- —
Short-term bridge; refi at stabilization.
Rent comps 4 comps
| Address | Beds | Baths | Sqft | Rent | $/sqft | DOM | Units | Dist |
|---|---|---|---|---|---|---|---|---|
| 13906 Central Park Ave Unit 2N Robbins, IL | 3.0 | 2.0 | 900 | $2,200 | $2.44 | 1d | 1 | 0.29mi |
| 3542 147th St Midlothian, IL | 2.0 | 1.0 | 817 | $1,500 | $1.84 | 6d | 2 | 0.69mi |
| 3349 147th St Unit 3240 06 Midlothian, IL | 2.0 | 1.0 | 817 | $1,500 | $1.84 | 5d | 1 | 0.78mi |
| 14521 Richmond Ave Unit 3 Posen, IL | 2.0 | 1.0 | 850 | $1,375 | $1.62 | 25d | 1 | 0.96mi |
Listing history 20 events
-
2026-06-18days on market $42,900 Active 283 DOM
-
2026-06-17days on market $42,900 Active 282 DOM
-
2026-06-16days on market $42,900 Active 281 DOM
-
2026-06-15days on market $42,900 Active 280 DOM
-
2026-06-13days on market $42,900 Active 278 DOM
-
2026-06-09days on market $42,900 Active 274 DOM
-
2026-06-08days on market $42,900 Active 273 DOM
-
2026-06-07days on market $42,900 Active 272 DOM
-
2026-06-04days on market $42,900 Active 269 DOM
-
2026-06-03days on market $42,900 Active 268 DOM
-
2026-06-02days on market $42,900 Active 267 DOM
-
2026-06-01days on market $42,900 Active 266 DOM
-
2026-05-31days on market $42,900 Active 265 DOM
-
2026-04-17status Active 307-char remark
Show marketing remark (307 chars)
Investor special located in Robbins, IL! Spacious 4-bedroom 1.5 bath with a potential for a 5th bedroom. Ideal for investors looking to buy and hold or fix and flip. With strong rental income potential or resale value, this property is a smart addition to any portfolio. Schedule your private showing today.
-
2026-03-15status Pending 307-char remark
Show marketing remark (307 chars)
Investor special located in Robbins, IL! Spacious 4-bedroom 1.5 bath with a potential for a 5th bedroom. Ideal for investors looking to buy and hold or fix and flip. With strong rental income potential or resale value, this property is a smart addition to any portfolio. Schedule your private showing today.
-
2026-01-14price $42,900 307-char remark
Show marketing remark (307 chars)
Investor special located in Robbins, IL! Spacious 4-bedroom 1.5 bath with a potential for a 5th bedroom. Ideal for investors looking to buy and hold or fix and flip. With strong rental income potential or resale value, this property is a smart addition to any portfolio. Schedule your private showing today.
-
2025-12-17price $47,900 307-char remark
Show marketing remark (307 chars)
Investor special located in Robbins, IL! Spacious 4-bedroom 1.5 bath with a potential for a 5th bedroom. Ideal for investors looking to buy and hold or fix and flip. With strong rental income potential or resale value, this property is a smart addition to any portfolio. Schedule your private showing today.
-
2025-11-22price $50,500 307-char remark
Show marketing remark (307 chars)
Investor special located in Robbins, IL! Spacious 4-bedroom 1.5 bath with a potential for a 5th bedroom. Ideal for investors looking to buy and hold or fix and flip. With strong rental income potential or resale value, this property is a smart addition to any portfolio. Schedule your private showing today.
-
2025-09-18price $55,000 307-char remark
Show marketing remark (307 chars)
Investor special located in Robbins, IL! Spacious 4-bedroom 1.5 bath with a potential for a 5th bedroom. Ideal for investors looking to buy and hold or fix and flip. With strong rental income potential or resale value, this property is a smart addition to any portfolio. Schedule your private showing today.
-
2025-08-05$60,000 Active 307-char remark
Show marketing remark (307 chars)
Investor special located in Robbins, IL! Spacious 4-bedroom 1.5 bath with a potential for a 5th bedroom. Ideal for investors looking to buy and hold or fix and flip. With strong rental income potential or resale value, this property is a smart addition to any portfolio. Schedule your private showing today.
ⓘ Source: listings_history table (triggers on properties + properties_extension) + one-shot
backfill from property_details.listing_events for pre-trigger history.
Tax reassessment forecast IL · Partial reset (capped growth)
- Current annual tax
- $2,026 · $169/mo
- Projected year-2 tax
- $2,026 · $169/mo
- Expected delta
- $0/yr ($0/mo · 0.0%)
ⓘ Screening estimate from a state-policy table — verify with the county assessor before closing.
Climate risk First Street
- Flood 1/10 Low FEMA zone X (unshaded) · 0% chance over 30 yrs
- Wildfire 1/10 Low
- Heat 3/10 Moderate 7 d/yr ≥102°F today · 15 d/yr by 30 yrs out
- Wind 2/10 Low
- Air quality 3/10 Moderate 4 unhealthy d/yr today · 4 by 30 yrs out
Nearby sold comps map
Loading sold comps map…
Walkable amenities ~0.75 mi
Loading nearby amenities…
Taxation est. · year 1
- Rental income
- $21,984
- − Mortgage interest
- −$2,403
- − Property taxes
- −$2,026
- − Insurance
- −$214
- − Repairs & maintenance
- −$1,759
- − Management
- −$1,759
- − Depreciation
- −$1,248
- Taxable income
- $12,575
- Est. tax owed @ 24.0%
- −$3,018
- After-tax cash flow
- $9,409/yr
For passive investors: Depreciation is non-cash, so a rental often shows a tax loss while cash-flowing — sheltering income. Rental losses are passive: they offset passive income freely, and up to $25,000/yr can offset ordinary (W-2) income if you actively participate and your MAGI is under $100k (phasing out to $0 by $150k); unused losses carry forward. On sale, claimed depreciation is recaptured at up to 25%, and gains may owe capital-gains tax (a 1031 exchange can defer both). Figures are a year-1 estimate at your 24.0% rate — not tax advice; consult a CPA.
Schools (NCES district)
- District
- Chsd 218
- NCES district ID
- 1706540
- Math proficiency
- 14% ▼ -4.00%
- Reading proficiency
- 20% ▼ -1.00%
- Median HH income
- $57,166
- Composite
- 16.09/100
- National rank
- #9235
- State rank
- #454 of 620 in IL
Livability — Robbins
- Score
- 66/100
- State rank
- #583
- US rank
- #12161
Category grades
Schools grade is shown separately in the Schools card above.
Census & demographics
- Census place
- Robbins, IL
- City population
- 4,961
- Population (ZIP)
- 4,961
Population outlook (Cook County) Hauer SSP2
- Today (2025)
- 5,347,519 people
- By 2030
- 5,357,703 · +0.2%
- By 2040
- 5,324,924 · -0.4%
- By 2050
- 5,230,762 · -2.2%
- By 2075
- 4,785,735 · -10.5%
- By 2100
- 4,188,836 · -21.7%
Race, ethnicity, and origin ACS 2023
- Neighborhood character
- Predominantly Black (85%)
- Race & ethnicity
- Black 85% Hispanic / Latino 9% White 4% Two or more races 3%
- Hispanic origin (detail)
- Mexican 8%
- Common ancestry
- Hispanic 4%
- Foreign-born
- 4% · Canada
- Languages at home
- 92% English-only · Spanish 7%
Political lean MEDSL · Cook
- 2024 margin
- Solid D (+42.0) · D 70.4% · R 28.4% · Other 1.2%
- 2008→2024 swing
- -11.4pp toward R · 2008: 53.4pp · 2024: 42.0pp
- All cycles
- 2024: D+42.0 2020: D+50.3 2016: D+53.0 2012: D+49.4 2008: D+53.4
Not yet ingested
- Civics
- —
Market trends
- HPI YoY
- ▲ 16.74%
- Current HPI
- 494.1622
- Rent YoY
- —
- Metro
- —
- State GDP YoY
- ▲ 1.59%
- F500 in state
- 60
Industry mix (Fortune 500 HQ in IL)
| Industry | F500 HQs | Revenue |
|---|---|---|
| Insurance | 4 | $201B |
|
||
| Consumer Goods | 4 | $87B |
|
||
| Industrial Machinery | 3 | $64B |
|
||
| Healthcare | 2 | $55B |
|
||
| Retail / Pharmacy | 1 | $148B |
|
||
| Agriculture / Food | 1 | $86B |
|
||
Price history
-28.5% since first listed7 events — show timeline
- 2026-04-17 Relisted — MRED as Distributed by MLS Grid
- 2026-03-15 Pending — MRED as Distributed by MLS Grid
- 2026-01-14 Price Changed $42,900 MRED as Distributed by MLS Grid
- 2025-12-17 Price Changed $47,900 MRED as Distributed by MLS Grid
- 2025-11-22 Price Changed $50,500 MRED as Distributed by MLS Grid
- 2025-09-18 Price Changed $55,000 MRED as Distributed by MLS Grid
- 2025-08-05 Listed $60,000 MRED as Distributed by MLS Grid
Property tax history
+1.6%/yrLatest (2023): $2,026 · +11.4% YoY. Source: county tax records.
Cash-flow waterfall
monthlySold comps — $/sqft
last 12 mo · ≤1 miLoading sold comps…