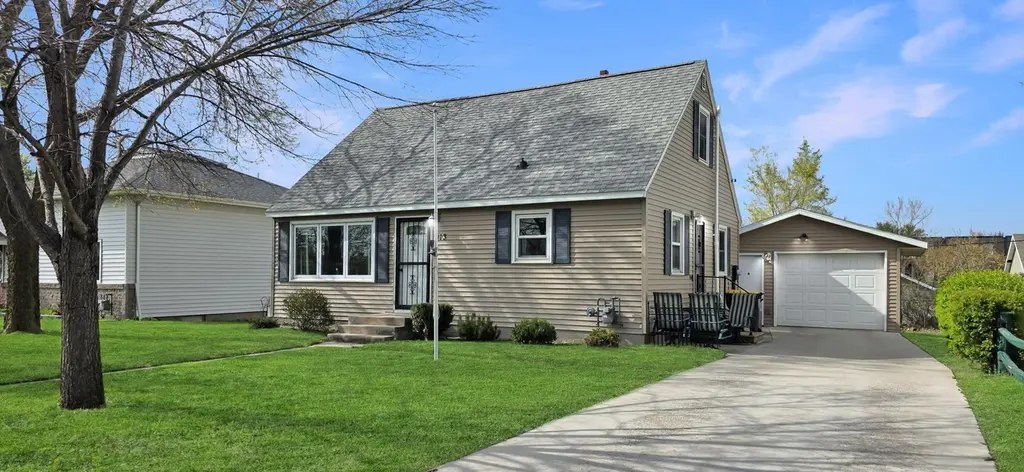
913 E Elm St · Redwood Falls, MN
Flood risk No data
- FEMA flood zone
- —
- Chance of flooding over 30 yrs
- —
- Est. flood insurance / yr
- —
Fire risk No data
- Est. fire insurance / yr
- —
Heat risk No data
- Hot days now (above threshold)
- —
- Hot days in 30 yrs
- —
Wind risk No data
- Chance of severe wind over 30 yrs
- —
Air-quality risk No data
- Unhealthy air days now
- —
- Unhealthy air days in 30 yrs
- —
Risk factors via First Street. Map © Google.
Why this score? — see what drove the B- grade
The composite is a weighted blend of 9 inputs, each scored 0–100. Each bar is that input's sub-score; the figure is the points it added to the 100-point composite (weight × sub-score).
- Cash flow +25.8/30.0
- ARV discount +15.0/15.0
- DSCR +8.6/10.0
- 1% rule +6.0/10.0
- Livability +3.8/5.0
- Schools +3.6/10.0
- Rent growth +2.5/5.0
- Condition / age +2.5/5.0
- Appreciation +0.0/10.0
$178,000
🖨 Deal sheet 📄 Offer letter ✓ Due diligence
Listing remarks
Beautifully maintained and full of character, this spacious 4-bedroom home offers a blend of classic charm and thoughtful updates throughout! Step inside and appreciate the gorgeous natural wood floors, abundant natural light, and inviting spaces designed for comfortable living. The kitchen provides modern convenience while maintaining warmth and functionality for everyday living. The main level features two bedrooms and a full bathroom, while the remodeled upper level adds two additional bedrooms with fresh updates and added living appeal. The lower level offers exciting future potential with a basement already framed and in progress, including laundry space, non-conforming bedroom, and a
Key facts
- 7,405 sq ft lot
- Garage
- Built 1962
Property features AI
Exterior
- Parking: Detached or attached 1-car garage (16 x 22)
- Utilities: City water connected; City sewer connected; Natural gas; Electric service with circuit breakers
- Home design: Residential property; One and one-half story
- Construction: Block construction; Asphalt roof; Block foundation (foundation area 832)
- Exterior features: Vinyl exterior
Interior
- Kitchen: Range; Refrigerator
- Bedrooms: 4 bedrooms total — bedrooms on main and upper levels
- Bathrooms: One full bathroom on the main level
- Heating & cooling: Forced air heating; Central air conditioning
- Interior features: Informal dining area that connects to the kitchen; Full, unfinished basement; Water softener (rented)
- Laundry & utility: Washer and Dryer; Laundry area located in the basement; Gas water heater
Neighborhood map
What this means for you Summary
Snapshot
- This is a 4-bed/1.0-bath single-family listed at $178k.
Deal economics
- At list price, monthly cash flow is $433 ($5k/yr) — positive.
- The deal already cash-flows at list — no discount required.
- Meets the 1% rule at list price ($2k rent vs $178k).
- Recommended offer: $173k (3.0% below list) — sets the bar for market timing.
- Cap rate 9.2% vs local median 6.0% in Redwood Falls — top-decile yield for the area; either an underpriced asset or a hidden risk that comps aren't pricing in. Stress-test before assuming the spread holds.
Location & tenants
- Location reads 76/100 on livability (#169 in MN, #3,642 nationally) — a middle-class / working-renter tenant base. Strengths: cost of living A+, housing A+, health & safety A+; Watch: amenities F, commute F.
- Redwood Area School District (town): math 39% / reading 46% proficiency, ranked #207 of 301 in MN (top 69%) — families likely to look elsewhere, expect single-tenant / working-renter base with shorter leases.
- Market conditions: 46 active listings in the ZIP; 4 comparable units currently listed for rent nearby; rentals lingering (median 44d on market — plan ~5-8 weeks vacancy on turnover, expect pricing pressure); 100% of comp listings sitting > 30 days — soft ceiling on asking rent; 25 units permitted in Redwood County in 2024 (0 in 5+ unit buildings).
Forward outlook
- Local home prices are declining (-3.0%/yr); year-one equity from $1k of loan paydown is wiped out by about $5k of value loss. Plan a longer hold.
- Redwood County population projected at -16% by 2050 — secular population decline; favor cash flow + early exit over multi-decade hold.
Negotiation context
- It's been on market 35 days — a 3% lower offer ($173k) is reasonable based on typical stale-listing flexibility.
Questions for the listing agent
- It's been on market 35 days. Have you received any prior offers? Is the seller open to a 3% concession, seller financing, or rate buy-down credit?
- Built in 1962 — when were the roof, HVAC, electrical panel, plumbing, and water heater last replaced?
- Is there a deadline driving the sale (1031 exchange, divorce, estate, relocation)? That informs how much negotiation room exists.
- What's the average days-on-market for RENTAL listings here right now (not sales)? A rising rental-DOM trend means longer vacancies and softer asking-rent achievability than the comps imply.
- What's the recent tenant-quality profile in this submarket — average credit score on applications, eviction rate, late-payment / NSF rate, and stable-employment percentage? A property-management company in the area should have these aggregated.
- How much new for-sale + rental construction is in the pipeline within 1–3 miles? Heavy new supply typically softens prices + rents 12–24 months out; constrained supply supports both.
Investment metrics
- 1% rule
- 1.10% ✓
- Cap rate
- 9.21%
- Cash-on-cash
- 10.42%
- DSCR
- 1.46
- GRM
- 7.6
CMA / ARV
- ARV (median comp)
- $299,903
- List price
- $178,000
- Delta
- -40.65%
- Verdict
- UNDERPRICED
- Comps
- 1 within 2.0 mi
Projected returns pro-forma
-3.0% appreciation · 3.0% rent growth · sell at horizon
- IRR
- -0.7%
- Equity multiple
- 0.97×
- Total profit
- $-1,329
- Equity at exit
- $26,540
- IRR
- 8.9%
- Equity multiple
- 1.69×
- Total profit
- $34,151
- Equity at exit
- $15,390
Cash invested: $49,840 (down + closing). Projections, not guarantees.
Landlord ↔ Tenant lean methodology
- Overall (STATE)
- 46 Balanced
- State Minnesota
- 46 Balanced · D+2
- County
- — inherits STATE
- City
- — inherits STATE
ZIP-level market 56283
- Home prices YoY
- -15.6%
- Active inventory
- 46
- Price-to-rent
- 7.6×
Monthly cashflow live
- Estimated rent
- $1,954 medium interval (Pro) →
- Mortgage (P&I)
- −$933
- Tax from tax record
- −$103 /mo · $1,236/yr
- Insurance
- −$74
- HOA
- −$0
- Vacancy / Maint / Mgmt
- −$410
- Net cashflow
- $433
Break-even live
UW: 25.0% down · 7.5% · 30yr · 1.5% tax · 5.0% vac · 8.0% maint · 8.0% mgmt
Financing live
Cash to close
- Down payment
- $44,500
- Closing costs
- $5,340
- Reserves months
- —
- Total cash needed
- —
Loan-product check · same deal, 3 products live
Conventional
25% down · 7.5% · 30yr
- Down + closing
- —
- Monthly P&I
- —
- Monthly cashflow
- —
- DSCR
- —
- Eligible?
- —
Personal DTI + credit; lowest rate.
DSCR
20% down · 8.5% · 30yr
- Down + closing
- —
- Monthly P&I
- —
- Monthly cashflow
- —
- DSCR
- —
- Eligible?
- —
No personal income docs; deal must DSCR.
Hard money
10% down · 12.0% · 12mo
- Down + closing
- —
- Monthly P&I
- —
- Monthly cashflow
- —
- DSCR
- —
- Eligible?
- —
Short-term bridge; refi at stabilization.
Rent comps 4 comps
| Address | Beds | Baths | Sqft | Rent | $/sqft | DOM | Units | Dist |
|---|---|---|---|---|---|---|---|---|
| 100 Fallwood Rd Unit 123 Redwood Falls, MN | 3.0 | 1.0 | 1306 | $1,900 | $1.45 | 43d | 1 | 0.52mi |
| 100 Fallwood Rd Unit 122 Redwood Falls, MN | 3.0 | 1.0 | 919 | $1,550 | $1.69 | 43d | 1 | 0.52mi |
| 100 Fallwood Rd Unit 118 Redwood Falls, MN | 3.0 | 1.0 | 1341 | $1,990 | $1.48 | 43d | 1 | 0.52mi |
| 100 Fallwood Rd Unit 119 Redwood Falls, MN | 3.0 | 1.0 | 1373 | $2,300 | $1.68 | 43d | 1 | 0.52mi |
Listing history 16 events
-
2026-06-18days on market $178,000 Active 35 DOM
-
2026-06-17days on market $178,000 Active 34 DOM
-
2026-06-16days on market $178,000 Active 33 DOM
-
2026-06-15days on market $178,000 Active 32 DOM
-
2026-06-13days on market $178,000 Active 30 DOM
-
2026-06-12days on market $178,000 Active 29 DOM
-
2026-06-09days on market $178,000 Active 26 DOM
-
2026-06-08days on market $178,000 Active 25 DOM
-
2026-06-07days on market $178,000 Active 24 DOM
-
2026-06-05days on market $178,000 Active 22 DOM
-
2026-06-04days on market $178,000 Active 20 DOM
-
2026-06-02days on market $178,000 Active 19 DOM
-
2026-06-01days on market $178,000 Active 18 DOM
-
2026-05-31days on market $178,000 Active 17 DOM
-
2026-05-31days on market $178,000 Active 16 DOM
-
2026-05-14$178,000 Active 964-char remark
ⓘ Source: listings_history table (triggers on properties + properties_extension) + one-shot
backfill from property_details.listing_events for pre-trigger history.
Tax reassessment forecast MN · Partial reset (capped growth)
- Current annual tax
- $1,236 · $103/mo
- Projected year-2 tax
- $1,615 · $135/mo
- Expected delta
- +$379/yr (+$32/mo · 30.6%)
ⓘ Screening estimate from a state-policy table — verify with the county assessor before closing.
Nearby sold comps map
Loading sold comps map…
Walkable amenities ~0.75 mi
Loading nearby amenities…
Taxation est. · year 1
- Rental income
- $23,443
- − Mortgage interest
- −$9,971
- − Property taxes
- −$1,236
- − Insurance
- −$890
- − Repairs & maintenance
- −$1,875
- − Management
- −$1,875
- − Depreciation
- −$5,178
- Taxable income
- $2,417
- Est. tax owed @ 24.0%
- −$580
- After-tax cash flow
- $4,612/yr
For passive investors: Depreciation is non-cash, so a rental often shows a tax loss while cash-flowing — sheltering income. Rental losses are passive: they offset passive income freely, and up to $25,000/yr can offset ordinary (W-2) income if you actively participate and your MAGI is under $100k (phasing out to $0 by $150k); unused losses carry forward. On sale, claimed depreciation is recaptured at up to 25%, and gains may owe capital-gains tax (a 1031 exchange can defer both). Figures are a year-1 estimate at your 24.0% rate — not tax advice; consult a CPA.
Schools (NCES district)
- District
- Redwood Area School District
- NCES district ID
- 2700182
- Math proficiency
- 39% ▼ -14.00%
- Reading proficiency
- 46% ▼ -12.00%
- Median HH income
- $45,326
- Composite
- 36.1/100
- National rank
- #4756
- State rank
- #207 of 301 in MN
Livability — Redwood Falls
- Score
- 76/100
- State rank
- #169
- US rank
- #3642
Category grades
Schools grade is shown separately in the Schools card above.
Census & demographics
- Census place
- Redwood Falls, MN
- Population (ZIP)
- 6,469
Population outlook (Redwood County) Hauer SSP2
- Today (2025)
- 14,504 people
- By 2030
- 13,983 · -3.6%
- By 2040
- 13,056 · -10.0%
- By 2050
- 12,225 · -15.7%
- By 2075
- 11,051 · -23.8%
- By 2100
- 9,786 · -32.5%
Race, ethnicity, and origin ACS 2023
- Neighborhood character
- Predominantly White (90%)
- Race & ethnicity
- White 90% Two or more races 4% Hispanic / Latino 4% Native American 3%
- Common ancestry
- Portuguese 12% Romanian 2% Lithuanian 2%
- Foreign-born
- 1% · Canada
- Languages at home
- 95% English-only · Spanish 3% German/W. Germanic 1%
Political lean MEDSL · Redwood
- 2024 margin
- Solid R (+43.3) · D 27.7% · R 71.0% · Other 1.2%
- 2008→2024 swing
- -29.8pp toward R · 2008: -13.6pp · 2024: -43.3pp
- All cycles
- 2024: R+43.3 2020: R+41.2 2016: R+43.0 2012: R+20.1 2008: R+13.6
Not yet ingested
- Civics
- —
Market trends
- HPI YoY
- ▼ -39.40%
- Current HPI
- 213.8535
- Rent YoY
- —
- Metro
- —
- State GDP YoY
- ▲ 2.41%
- F500 in state
- 34
Industry mix (Fortune 500 HQ in MN)
| Industry | F500 HQs | Revenue |
|---|---|---|
| Healthcare | 2 | $407B |
|
||
| Retail | 2 | $150B |
|
||
| Consumer Goods | 2 | $32B |
|
||
| Industrial Machinery | 2 | $6B |
|
||
| Agriculture | 1 | $40B |
|
||
| Healthcare / Medical Devices | 1 | $32B |
|
||
Price history
1 event — show timeline
- 2026-05-14 Listed $178,000 NORTHSTARMLS as Distributed by MLS Grid
Property tax history
+5.7%/yrLatest (2025): $1,236 · +3.2% YoY. Source: county tax records.
Cash-flow waterfall
monthlySold comps — $/sqft
last 12 mo · ≤1 miLoading sold comps…