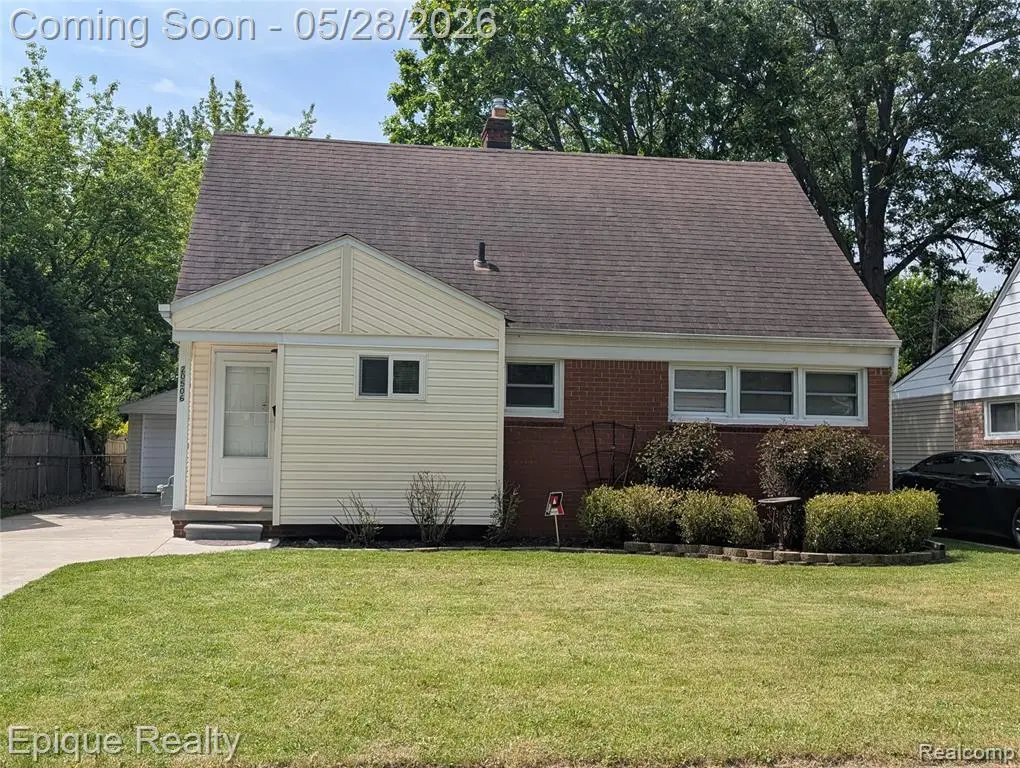
20506 Lancaster St · Harper Woods, MI
Flood risk 1/10 · Minimal
- FEMA flood zone
- X (unshaded)
- Chance of flooding over 30 yrs
- 0.0%
- Est. flood insurance / yr
- $507 – $1,088
Fire risk 1/10 · Minimal
- Est. fire insurance / yr
- $784 – $1,456
Heat risk 3/10 · Minor
- Hot days now (above 96°F)
- 7 days/yr
- Hot days in 30 yrs
- 15 days/yr
Wind risk 2/10 · Minimal
- Chance of severe wind over 30 yrs
- —
Air-quality risk 3/10 · Minor
- Unhealthy air days now
- 3 days/yr
- Unhealthy air days in 30 yrs
- 4 days/yr
Risk factors via First Street. Map © Google.
Why this score? — see what drove the F grade
The composite is a weighted blend of 9 inputs, each scored 0–100. Each bar is that input's sub-score; the figure is the points it added to the 100-point composite (weight × sub-score).
- Cash flow +12.9/30.0
- Schools +5.7/10.0
- DSCR +3.9/10.0
- Rent growth +3.8/5.0
- Livability +3.7/5.0
- 1% rule +2.7/10.0
- Condition / age +2.5/5.0
- ARV discount +0.0/15.0
- Appreciation +0.0/10.0
$209,900
🖨 Deal sheet 📄 Offer letter ✓ Due diligence
Listing remarks
Discover the enduring appeal of 20506 Lancaster ST, a single-family residence in Harper Woods, MI, built in 1950. This home offers a unique opportunity to embrace a classic Michigan lifestyle, blending historical charm with modern potential. With four comfortable bedrooms, there is ample space to create personalized retreats for relaxation and rejuvenation. Each room provides a blank canvas for individual style and comfort. The two well-appointed bathrooms offer convenience and functionality for daily routines (one in basement). Two additional bedrooms as needed can be found in the basement for additional living and storage space. These spaces are designed to accommodate the needs of a busy
Key facts
- 6,534 sq ft lot
- 2 garage spots
- Built 1950
Property features AI
Exterior
- Parking: Detached 2-car garage
- Utilities: Public water (at street); Public sewer (at street); Power/utilities available
- Home design: Residential property; 1 1/2-story structure; Built in 1950; Frontage approximately 50 feet; Approximately 0.15 acre lot
- Construction: Basement foundation; Below-grade finished area present
- Exterior features: Brick exterior; Porch; Paved street frontage
Interior
- Kitchen: Kitchen at entry level, approximately 14 x 12; Microwave; Refrigerator
- Bedrooms: Bedroom 1 (Entry level): 13 x 11; Bedroom 2 (Entry level): 12 x 9; Bedroom 3 (Second level): 11 (width listed); Bedroom 4 (Second level): 12 x 9; Total of 9 rooms
- Bathrooms: 2 full bathrooms (one on entry level, one in basement)
- Heating & cooling: Forced air heating; Central A/C; Natural gas heat/fuel; Gas water heater
- Interior features: Finished basement; Porch
- Laundry & utility: Laundry room in basement, approximately 6 x 8
Neighborhood map
What this means for you Summary
Snapshot
- This is a 4-bed/1.0-bath single-family listed at $210k.
Deal economics
- At list price, monthly cash flow is $-16 ($-197/yr) — negative.
- To cash-flow at today's rent, offer at most $207k (1.4% below list).
- To meet the 1% rule (rent ≥ 1% of price), the offer needs to be $161k (23.5% below list).
- Recommended offer: $161k (23.5% below list) — sets the bar for 1% rule.
Location & tenants
- Location reads 73/100 on livability (#199 in MI) — a middle-class / working-renter tenant base. Strengths: commute A+, cost of living A+, housing A+; Watch: employment D+, health & safety D+, schools D-.
- Grosse Pointe Public Schools (suburban): math 56% / reading 68% proficiency, ranked #24 of 540 in MI (top 4%) — acceptable for families but not a draw, mixed tenant base, ~2y average lease; only 13% free/reduced lunch — higher-income household profile.
- Market conditions: Rents rising fast (+5.1%/yr); 133 active listings in the ZIP; 12 comparable units currently listed for rent nearby; rentals at typical pace (median 17d on market — plan ~3-4 weeks tenant-placement turnaround); 2,639 units permitted in Wayne County in 2024 (1,216 in 5+ unit buildings).
- This rent runs 31% of the median local income ($62k/yr) — at the standard rent-burdened threshold; future hikes will face affordability resistance.
Forward outlook
- Local home prices are declining (-3.0%/yr); year-one equity from $1k of loan paydown is wiped out by about $6k of value loss. Plan a longer hold.
- Wayne County population projected at -17% by 2050 — secular population decline; favor cash flow + early exit over multi-decade hold.
Negotiation context
- It's been on market 22 days — a 2% lower offer ($207k) is reasonable based on typical stale-listing flexibility.
- 14 sale attempts since 18y ago; this cycle's ask is 22% above the opening price — seller raised mid-cycle; expect resistance to lowballs.
- Current owner paid $38k; list at $210k implies a 452% gain — meaningful room to come down on a strong offer.
Risks & watch-outs
- Watch-outs: built in 1950 — expect roof / HVAC / electrical / plumbing capex.
Questions for the listing agent
- What do current leases actually rent for vs. the listed asking? Can we see a recent rent roll and the last 12 months of T-12 income?
- Built in 1950 — when were the roof, HVAC, electrical panel, plumbing, and water heater last replaced?
- Is there a deadline driving the sale (1031 exchange, divorce, estate, relocation)? That informs how much negotiation room exists.
- Schools are D-rated, which usually means shorter tenancies and higher turnover. Who's the typical renter profile here, and what's been the actual vacancy rate?
- Crime grade is F in this area — have there been break-ins, vandalism, or insurance claims at this property in the last 3 years? What carrier currently insures it and at what premium?
- The area grade is low — what's the realistic commute time and amenity access for the typical tenant pool here? Any planned neighborhood developments (good or bad) we should know about?
- What's the average days-on-market for RENTAL listings here right now (not sales)? A rising rental-DOM trend means longer vacancies and softer asking-rent achievability than the comps imply.
- What's the recent tenant-quality profile in this submarket — average credit score on applications, eviction rate, late-payment / NSF rate, and stable-employment percentage? A property-management company in the area should have these aggregated.
- How much new for-sale + rental construction is in the pipeline within 1–3 miles? Heavy new supply typically softens prices + rents 12–24 months out; constrained supply supports both.
Investment metrics
- 1% rule
- 0.77% ✗
- Cap rate
- 6.20%
- Cash-on-cash
- -0.33%
- DSCR
- 0.99
- GRM
- 10.9
CMA / ARV
- ARV (on-the-fly)
- $154,908
- Comps found
- 12
Show comp detail 12 sales within ~0.75 mi
| Address | Dist | Beds/Ba | Sqft | Sold | Price | $/sf | Match |
|---|---|---|---|---|---|---|---|
| 20672 Fleetwood Dr | 0.12mi | 3/1.0 (-1) | 1,031 (+4%) | 6mo | $115,000 | $112 | 78 |
| 20688 Fleetwood Dr | 0.13mi | 3/1.0 (-1) | 1,053 (+6%) | 3mo | $173,000 | $164 | 76 |
| 20402 Kenmore Ave | 0.24mi | 3/1.5 (-1) | 1,055 (+6%) | 3mo | $110,000 | $104 | 69 |
| 20602 Kenmore Ave | 0.24mi | 3/2.0 (-1) | 1,055 (+6%) | 3mo | $163,850 | $155 | 67 |
| 20886 Hunt Club Dr | 0.33mi | 3/1.5 (-1) | 1,044 (+5%) | 7mo | $213,300 | $204 | 63 |
| 20450 Lochmoor St | 0.13mi | 3/1.0 (-1) | 1,107 (+12%) | 8mo | $135,000 | $122 | 63 |
| 20842 Ridgemont Rd | 0.61mi | 3/1.0 (-1) | 1,001 (+1%) | 3mo | $85,000 | $85 | 63 |
| 19993 Woodmont St | 0.39mi | 3/1.5 (-1) | 1,064 (+7%) | 10mo | $188,000 | $177 | 55 |
| 21200 Country Club Dr | 0.45mi | 3/1.0 (-1) | 1,094 (+10%) | 9mo | $210,000 | $192 | 49 |
| 20846 Hampton St | 0.66mi | 3/1.0 (-1) | 897 (-10%) | 7mo | $139,900 | $156 | 42 |
| 21101 Norwood Dr | 0.42mi | 3/2.0 (-1) | 1,122 (+13%) | 10mo | $245,000 | $218 | 42 |
| 21191 Lochmoor St | 0.45mi | 3/1.5 (-1) | 1,139 (+15%) | 11mo | $115,000 | $101 | 38 |
Match score weights: distance 35% · size 25% · config 20% · recency 20%. Top-matched comps best support the ARV.
Projected returns pro-forma
-3.0% appreciation · 5.1% rent growth · sell at horizon
- IRR
- -14.8%
- Equity multiple
- 0.46×
- Total profit
- $-31,669
- Equity at exit
- $31,297
- IRR
- -3.4%
- Equity multiple
- 0.76×
- Total profit
- $-14,391
- Equity at exit
- $18,148
Cash invested: $58,772 (down + closing). Projections, not guarantees.
Landlord ↔ Tenant lean methodology
- Overall (STATE)
- 62 Landlord-Friendly
- State Michigan
- 62 Landlord-Friendly · EVEN
- County
- — inherits STATE
- City
- — inherits STATE
ZIP-level market 48225
- Rents YoY
- 5.1%
- Active inventory
- 133
- Price-to-rent
- 10.9×
Monthly cashflow live
- Estimated rent
- $1,606 high interval (Pro) →
- Mortgage (P&I)
- −$1,101
- Tax from tax record
- −$97 /mo · $1,167/yr
- Insurance
- −$87
- HOA
- −$0
- Vacancy / Maint / Mgmt
- −$337
- Net cashflow
- $-16
Break-even live
UW: 25.0% down · 7.5% · 30yr · 1.5% tax · 5.0% vac · 8.0% maint · 8.0% mgmt
Financing live
Cash to close
- Down payment
- $52,475
- Closing costs
- $6,297
- Reserves months
- —
- Total cash needed
- —
Loan-product check · same deal, 3 products live
Conventional
25% down · 7.5% · 30yr
- Down + closing
- —
- Monthly P&I
- —
- Monthly cashflow
- —
- DSCR
- —
- Eligible?
- —
Personal DTI + credit; lowest rate.
DSCR
20% down · 8.5% · 30yr
- Down + closing
- —
- Monthly P&I
- —
- Monthly cashflow
- —
- DSCR
- —
- Eligible?
- —
No personal income docs; deal must DSCR.
Hard money
10% down · 12.0% · 12mo
- Down + closing
- —
- Monthly P&I
- —
- Monthly cashflow
- —
- DSCR
- —
- Eligible?
- —
Short-term bridge; refi at stabilization.
Rent comps 12 comps
| Address | Beds | Baths | Sqft | Rent | $/sqft | DOM | Units | Dist |
|---|---|---|---|---|---|---|---|---|
| 20015 Lochmoor St Harper Woods, MI | 3.0 | 1.0 | 1006 | $1,500 | $1.49 | 16d | 1 | 0.27mi |
| 1992 Hawthorne Rd Grosse Pointe Woods, MI | 3.0 | 2.0 | 1071 | $2,100 | $1.96 | 10d | 1 | 0.76mi |
| 19661 Kenosha St Harper Woods, MI | 3.0 | 2.0 | 1000 | $1,400 | $1.40 | 24d | 1 | 1.06mi |
| 20461 Kingsville St Harper Woods, MI | 4.0 | 1.0 | 1100 | $1,399 | $1.27 | 14d | 1 | 1.09mi |
| 19152 Woodside St Harper Woods, MI | 3.0 | 1.0 | 916 | $1,500 | $1.64 | 17d | 1 | 1.11mi |
| 19982 McCormick St Detroit, MI | 3.0 | 1.0 | 866 | $1,200 | $1.39 | 3d | 1 | 1.19mi |
| 19442 Kingsville St Harper Woods, MI | 3.0 | 1.0 | 1000 | $1,500 | $1.50 | 17d | 1 | 1.22mi |
| 19365 Kingsville St Harper Woods, MI | 4.0 | 1.5 | 996 | $1,650 | $1.66 | 14d | 1 | 1.24mi |
| 10985 Peerless St Detroit, MI | 3.0 | 1.0 | 1000 | $1,364 | $1.36 | 4d | 1 | 1.34mi |
| 10542 Lanark St Detroit, MI | 3.0 | 1.0 | 1023 | $1,250 | $1.22 | 43d | 1 | 1.47mi |
| 12075 Rossiter St Detroit, MI | 3.0 | 1.0 | 1100 | $1,245 | $1.13 | 14d | 1 | 1.50mi |
| 12075 Rossiter St Detroit, MI | 3.0 | 1.0 | 1100 | $1,245 | $1.13 | 43d | 1 | 1.50mi |
Listing history 50 events
-
2026-06-18days on market $209,900 Active 22 DOM
-
2026-06-17days on market $209,900 Active 21 DOM
-
2026-06-16days on market $209,900 Active 20 DOM
-
2026-06-15pricedays on market $209,900 Active 19 DOM
-
2026-06-13days on market $214,800 Active 17 DOM
-
2026-06-13days on market $214,800 Active 16 DOM
-
2026-06-09days on market $214,800 Active 13 DOM
-
2026-06-08days on market $214,800 Active 12 DOM
-
2026-06-07days on market $214,800 Active 11 DOM
-
2026-06-04days on market $214,800 Active 8 DOM
-
2026-06-03days on market $214,800 Active 7 DOM
-
2026-06-02days on market $214,800 Active 6 DOM
-
2026-06-01days on market $214,800 Active 5 DOM
-
2026-05-31days on market $214,800 Active 4 DOM
-
2026-05-26historical $214,800
-
2019-10-25historical
-
2019-10-25historical
-
2019-10-10price $152,900
-
2019-10-10price $152,900
-
2019-08-27price $163,500
-
2019-08-26price $163,500
-
2019-08-19$172,500 Active
-
2019-08-19$172,500 Active
-
2017-06-16soldstatus $38,000 Sold
-
2017-06-16soldstatus $38,000 Closed
-
2017-06-16soldstatus $38,000
-
2017-05-04status Pending
-
2017-05-04status Pending
-
2017-01-20status Active
-
2017-01-16historical
-
2016-12-13status Active
-
2016-12-13$64,900 Active
-
2016-12-13historical
-
2016-12-13historical
-
2016-12-12historical
-
2016-10-19price $64,900
-
2016-10-19price $64,900
-
2016-09-12$49,900 Active
-
2016-09-12$49,900 Active
-
2016-09-12$64,900
-
2016-09-12$64,900
-
2009-07-24soldstatus $30,000
-
2009-07-24soldstatus $30,000
-
2009-07-13historical
-
2008-10-18$44,900
-
2008-10-18$44,900
-
2008-10-07historical
-
2008-09-27$89,900
-
2008-09-15historical
-
2008-09-15historical
ⓘ Source: listings_history table (triggers on properties + properties_extension) + one-shot
backfill from property_details.listing_events for pre-trigger history.
Tax reassessment forecast MI · Partial reset (capped growth)
- Current annual tax
- $1,167 · $97/mo
- Projected year-2 tax
- $2,200 · $183/mo
- Expected delta
- +$1,033/yr (+$86/mo · 88.5%)
ⓘ Screening estimate from a state-policy table — verify with the county assessor before closing.
Climate risk First Street
- Flood 1/10 Low FEMA zone X (unshaded) · 0% chance over 30 yrs
- Wildfire 1/10 Low
- Heat 3/10 Moderate 7 d/yr ≥96°F today · 15 d/yr by 30 yrs out
- Wind 2/10 Low
- Air quality 3/10 Moderate 3 unhealthy d/yr today · 4 by 30 yrs out
Nearby sold comps map
Loading sold comps map…
Walkable amenities ~0.75 mi
Loading nearby amenities…
Taxation est. · year 1
- Rental income
- $19,277
- − Mortgage interest
- −$11,758
- − Property taxes
- −$1,167
- − Insurance
- −$1,050
- − Repairs & maintenance
- −$1,542
- − Management
- −$1,542
- − Depreciation
- −$6,106
- Taxable loss
- −$3,888
- Est. tax savings @ 24.0%
- +$933
- After-tax cash flow
- $736/yr
For passive investors: Depreciation is non-cash, so a rental often shows a tax loss while cash-flowing — sheltering income. Rental losses are passive: they offset passive income freely, and up to $25,000/yr can offset ordinary (W-2) income if you actively participate and your MAGI is under $100k (phasing out to $0 by $150k); unused losses carry forward. On sale, claimed depreciation is recaptured at up to 25%, and gains may owe capital-gains tax (a 1031 exchange can defer both). Figures are a year-1 estimate at your 24.0% rate — not tax advice; consult a CPA.
Schools (NCES district)
- District
- Grosse Pointe Public Schools
- NCES district ID
- 2625740
- Math proficiency
- 56% ▼ -2.00%
- Reading proficiency
- 68% ▲ 2.00%
- Median HH income
- $89,975
- Composite
- 56.51/100
- National rank
- #1152
- State rank
- #24 of 540 in MI
Livability — Harper Woods
- Score
- 73/100
- State rank
- #199
- US rank
- #5054
Category grades
Schools grade is shown separately in the Schools card above.
Census & demographics
- Census place
- Harper Woods, MI
- County
- Wayne County · 1,562,939 people
- City population
- 16,098
- Metro
- Detroit-Warren-Dearborn, MI
- Population (ZIP)
- 16,098
- Household income
- $61,750
- Rent vs Own
- Severe rent burden
- 410.0
Population outlook (Wayne County) Hauer SSP2
- Today (2025)
- 1,675,273 people
- By 2030
- 1,620,300 · -3.3%
- By 2040
- 1,502,341 · -10.3%
- By 2050
- 1,384,039 · -17.4%
- By 2075
- 1,124,592 · -32.9%
- By 2100
- 881,193 · -47.4%
Race, ethnicity, and origin ACS 2023
- Neighborhood character
- Predominantly Black (65%)
- Race & ethnicity
- Black 65% White 28% Two or more races 4% Hispanic / Latino 1%
- Common ancestry
- Romanian 4% Lithuanian 1% German 1%
- Foreign-born
- 2% · Canada
- Languages at home
- 95% English-only · Arabic 2% Spanish 1%
Political lean MEDSL · Wayne
- 2024 margin
- Strong D (+29.0) · D 62.7% · R 33.7% · Other 3.6%
- 2008→2024 swing
- -20.5pp toward R · 2008: 49.5pp · 2024: 29.0pp
- All cycles
- 2024: D+29.0 2020: D+38.1 2016: D+37.3 2012: D+46.9 2008: D+49.5
Not yet ingested
- Civics
- —
Market trends
- HPI YoY
- ▼ -150.40%
- Current HPI
- 181.4961
- Rent YoY
- ▲ 5.10%
- Metro
- Detroit-Warren-Dearborn, MI
- State GDP YoY
- ▲ 1.37%
- F500 in state
- 28
Industry mix (Fortune 500 HQ in MI)
| Industry | F500 HQs | Revenue |
|---|---|---|
| Automotive Parts | 3 | $48B |
|
||
| Automotive | 2 | $372B |
|
||
| Chemicals | 1 | $45B |
|
||
| Automotive Retail | 1 | $29B |
|
||
| Healthcare / Medical Devices | 1 | $23B |
|
||
| Automotive Technology | 1 | $20B |
|
||
Price history
+138.9% since first listed38 events — show timeline
- 2026-05-26 Coming Soon $214,800 MiRealSource-MiMLS
- 2019-10-25 Listing Removed — REALCOMP
- 2019-10-25 Listing Removed — MiRealSource-MiMLS
- 2019-10-10 Price Changed $152,900 MiRealSource-MiMLS
- 2019-10-10 Price Changed $152,900 REALCOMP
- 2019-08-27 Price Changed $163,500 MiRealSource-MiMLS
- 2019-08-26 Price Changed $163,500 REALCOMP
- 2019-08-19 Listed $172,500 MiRealSource-MiMLS
- 2019-08-19 Listed $172,500 REALCOMP
- 2017-06-16 Sold (MLS) $38,000 REALCOMP
- 2017-06-16 Sold (MLS) $38,000 MiRealSource-MiMLS
- 2017-06-16 Sold (MLS) $38,000 REALCOMP
- 2017-05-04 Pending — MiRealSource-MiMLS
- 2017-05-04 Pending — REALCOMP
- 2017-01-20 Relisted — REALCOMP
- 2017-01-16 Listing Removed — REALCOMP
- 2016-12-13 Relisted — MiRealSource-MiMLS
- 2016-12-13 Listed $64,900 REALCOMP
- 2016-12-13 Listing Removed — REALCOMP
- 2016-12-13 Listing Removed — MiRealSource-MiMLS
- 2016-12-12 Listing Removed — MiRealSource-MiMLS
- 2016-10-19 Price Changed $64,900 MiRealSource-MiMLS
- 2016-10-19 Price Changed $64,900 REALCOMP
- 2016-09-12 Listed $49,900 MiRealSource-MiMLS
- 2016-09-12 Listed $49,900 REALCOMP
- 2016-09-12 Listed $64,900 MiRealSource-MiMLS
- 2016-09-12 Listed $64,900 REALCOMP
- 2009-07-24 Sold (MLS) $30,000 MiRealSource-MiMLS
- 2009-07-24 Sold (MLS) $30,000 REALCOMP
- 2009-07-13 Listing Removed — MiRealSource-MiMLS
- 2008-10-18 Listed $44,900 MiRealSource-MiMLS
- 2008-10-18 Listed $44,900 REALCOMP
- 2008-10-07 Listing Removed — MiRealSource-MiMLS
- 2008-09-27 Listed $89,900 MiRealSource-MiMLS
- 2008-09-15 Listing Removed — REALCOMP
- 2008-09-15 Listing Removed — MiRealSource-MiMLS
- 2008-06-16 Listed $89,900 REALCOMP
- 2008-06-15 Listed $89,900 MiRealSource-MiMLS
Property tax history
-7.6%/yrLatest (2025): $1,167 · -74.5% YoY. Source: county tax records.
Cash-flow waterfall
monthlySold comps — $/sqft
last 12 mo · ≤1 miLoading sold comps…