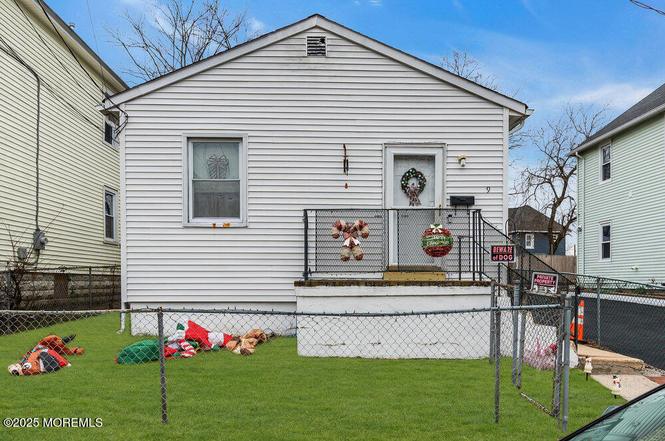
9 De Witt Ave · Asbury Park, NJ
Flood risk 6/10 · Moderate
- FEMA flood zone
- X (unshaded)
- Chance of flooding over 30 yrs
- 0.68%
- Est. flood insurance / yr
- $473 – $860
Fire risk 1/10 · Minimal
- Est. fire insurance / yr
- $526 – $976
Heat risk 8/10 · Major
- Hot days now (above 95°F)
- 7 days/yr
- Hot days in 30 yrs
- 15 days/yr
Wind risk 8/10 · Major
- Chance of severe wind over 30 yrs
- 80.0%
Air-quality risk 3/10 · Minor
- Unhealthy air days now
- 2 days/yr
- Unhealthy air days in 30 yrs
- 3 days/yr
Risk factors via First Street. Map © Google.
Why this score? — see what drove the D+ grade
The composite is a weighted blend of 9 inputs, each scored 0–100. Each bar is that input's sub-score; the figure is the points it added to the 100-point composite (weight × sub-score).
- Cash flow +16.6/30.0
- ARV discount +10.8/15.0
- DSCR +5.2/10.0
- 1% rule +4.4/10.0
- Livability +3.7/5.0
- Rent growth +3.1/5.0
- Condition / age +2.5/5.0
- Schools +0.9/10.0
- Appreciation +0.0/10.0
$279,900
🖨 Deal sheet (PDF) 📄 Offer letter ✓ Due diligence
Listing remarks
Looking to buy or invest in Asbury for under 300k? Search no further than this 2BR 1 bath home on a quiet dead-end street! Currently occupied by a long term tenant that would love to stay. This cozy home has a full basement for add'l space/storage, fenced yard. A great opportunity!
Key facts
- Fenced yard
- Full basement
- 2,613 sq ft lot
Tags
Neighborhood map
What this means for you Summary
Snapshot
- This is a 2-bed/1.0-bath single-family listed at $280k.
Deal economics
- At list price, monthly cash flow is $169 ($2k/yr) — positive.
- The deal already cash-flows at list — no discount required.
- To meet the 1% rule (rent ≥ 1% of price), the offer needs to be $263k (6.0% below list).
- Recommended offer: $255k (9.0% below list) — sets the bar for market timing.
- Cap rate 7.0% vs local median 0.8% in Asbury Park — top-decile yield for the area; either an underpriced asset or a hidden risk that comps aren't pricing in. Stress-test before assuming the spread holds.
Location & tenants
- Location reads 74/100 on livability (#171 in NJ, #4,521 nationally) — a middle-class / working-renter tenant base. Strengths: amenities A+, crime A-, health & safety B+; Watch: cost of living F.
- Asbury Park School District (suburban): math 3% / reading 18% proficiency, ranked #470 of 472 in NJ (top 100%) — low school quality limits family demand, transient renter base, plan for 1-2y turnover; 79% free/reduced lunch — lower-income household profile, screen leases tightly.
- Zoned schools: Dr. Martin Luther King Upper Elementary School (math 2% / reading 15%, grade F, #428 of 431 statewide, top 99%, 267 students, 58% FRL); Asbury Park High School (math 5% / reading 26%, grade F, #385 of 399 statewide, top 96%, 607 students, 46% FRL) — zoned schools average 52% FRL vs 79% district-wide (27 pts lower); this property's tenant base skews higher-income than the district average.
- Market conditions: Rents rising (+2.3%/yr); 277 active listings in the ZIP; 14 comparable units currently listed for rent nearby; rentals leasing fast (median 9d on market — plan ~1-2 weeks tenant-placement turnaround); solid renter incomes; 2,840 units permitted in Monmouth County in 2024 (484 in 5+ unit buildings).
- This rent runs 33% of the median local income ($97k/yr) — at the standard rent-burdened threshold; future hikes will face affordability resistance.
Forward outlook
- Local home prices are declining (-3.0%/yr); year-one equity from $2k of loan paydown is wiped out by about $8k of value loss. Plan a longer hold.
- Monmouth County population projected at -11% by 2050 — secular population decline; favor cash flow + early exit over multi-decade hold.
Negotiation context
- It's been on market 102 days — a 9% lower offer ($255k) is reasonable based on typical stale-listing flexibility.
Risks & watch-outs
- Watch-outs: built in 1946 — expect roof / HVAC / electrical / plumbing capex.
- Climate carrying-cost: major flood risk; severe wind risk, 80% chance of damaging wind over 30y; extreme-heat days projected 7→15/yr by 2055 (HVAC capex compounding) — expect insurance premiums to compound above CPI over the hold.
Questions for the listing agent
- It's been on market 102 days. Have you received any prior offers? Is the seller open to a 9% concession, seller financing, or rate buy-down credit?
- Built in 1946 — when were the roof, HVAC, electrical panel, plumbing, and water heater last replaced?
- Why hasn't it sold? Are there any deal-killer items the seller is aware of (foundation, flood, title, zoning, code violations)?
- Is there a deadline driving the sale (1031 exchange, divorce, estate, relocation)? That informs how much negotiation room exists.
- Schools are F-rated, which usually means shorter tenancies and higher turnover. Who's the typical renter profile here, and what's been the actual vacancy rate?
- The area grade is low — what's the realistic commute time and amenity access for the typical tenant pool here? Any planned neighborhood developments (good or bad) we should know about?
- What's the average days-on-market for RENTAL listings here right now (not sales)? A rising rental-DOM trend means longer vacancies and softer asking-rent achievability than the comps imply.
- What's the recent tenant-quality profile in this submarket — average credit score on applications, eviction rate, late-payment / NSF rate, and stable-employment percentage? A property-management company in the area should have these aggregated.
- How much new for-sale + rental construction is in the pipeline within 1–3 miles? Heavy new supply typically softens prices + rents 12–24 months out; constrained supply supports both.
Investment metrics
- 1% rule
- 0.94% ✗
- Cap rate
- 7.02%
- Cash-on-cash
- 2.59%
- DSCR
- 1.12
- GRM
- 8.9
CMA / ARV
- ARV (on-the-fly)
- $302,328
- Comps found
- 7
Show comp detail 7 sales within ~0.75 mi
| Address | Dist | Beds/Ba | Sqft | Sold | Price | $/sf | Match |
|---|---|---|---|---|---|---|---|
| 9 De Witt Ave | 0.00mi | 2/1.0 | 663 (0%) | 0mo | $265,000 | $400 | 100 |
| 207 Drummond Ave | 0.24mi | 2/1.0 | 600 (-10%) | 8mo | $225,000 | $375 | 67 |
| 1612 Bangs Ave | 0.39mi | 2/1.0 | 704 (+6%) | 14mo | $321,000 | $456 | 60 |
| 128 Broadway | 0.60mi | 2/1.0 | 700 (+6%) | 6mo | $625,000 | $893 | 58 |
| 154 Hawthorne Ave | 0.68mi | 2/1.0 | 636 (-4%) | 14mo | $282,000 | $443 | 50 |
| 503 1/2 Park Pl Ave | 0.74mi | 2/1.0 | 710 (+7%) | 18mo | $580,000 | $817 | 39 |
| 124 Abbott Ave | 0.62mi | 1/1.0 (-1) | 579 (-13%) | 17mo | $511,000 | $883 | 31 |
Match score weights: distance 35% · size 25% · config 20% · recency 20%. Top-matched comps best support the ARV.
Projected returns pro-forma
-3.0% appreciation · 2.29% rent growth · sell at horizon
- IRR
- -13.0%
- Equity multiple
- 0.54×
- Total profit
- $-36,411
- Equity at exit
- $41,734
- IRR
- -5.1%
- Equity multiple
- 0.68×
- Total profit
- $-25,268
- Equity at exit
- $24,201
Cash invested: $78,372 (down + closing). Projections, not guarantees.
Landlord ↔ Tenant lean methodology
- Overall (STATE)
- 21 Tenant-Leaning
- State New Jersey
- 21 Tenant-Leaning · D+6
- County
- — inherits STATE
- City
- — inherits STATE
ZIP-level market 07712
- Rents YoY
- 2.3%
- Active inventory
- 277
- Price-to-rent
- 8.9×
Monthly cashflow live
- Estimated rent
- $2,630 high interval (Pro) →
- Mortgage (P&I)
- −$1,468
- Tax from tax record
- −$324 /mo · $3,889/yr
- Insurance
- −$117
- HOA
- −$0
- Vacancy / Maint / Mgmt
- −$552
- Net cashflow
- $169
Break-even live
Sensitivity live
| Price | -10% $328 | -5% $249 | +0% $169 | +5% $90 | +10% $11 |
|---|---|---|---|---|---|
| Rent | -10% $-38 | -5% $65 | +0% $169 | +5% $273 | +10% $377 |
| Rate | -1.0pp $310 | -0.5pp $241 | base $169 | +0.5pp $97 | +1.0pp $23 |
UW: 25.0% down · 7.5% · 30yr · 1.5% tax · 5.0% vac · 8.0% maint · 8.0% mgmt
Financing live
Cash to close
- Down payment
- $69,975
- Closing costs
- $8,397
- Reserves months
- —
- Total cash needed
- —
Loan-product check · same deal, 3 products live
Conventional
25% down · 7.5% · 30yr
- Down + closing
- —
- Monthly P&I
- —
- Monthly cashflow
- —
- DSCR
- —
- Eligible?
- —
Personal DTI + credit; lowest rate.
DSCR
20% down · 8.5% · 30yr
- Down + closing
- —
- Monthly P&I
- —
- Monthly cashflow
- —
- DSCR
- —
- Eligible?
- —
No personal income docs; deal must DSCR.
Hard money
10% down · 12.0% · 12mo
- Down + closing
- —
- Monthly P&I
- —
- Monthly cashflow
- —
- DSCR
- —
- Eligible?
- —
Short-term bridge; refi at stabilization.
Rent comps 14 comps
| Address | Beds | Baths | Sqft | Rent | $/sqft | DOM | Units | Dist |
|---|---|---|---|---|---|---|---|---|
| 614 Prospect Ave Unit 2 Asbury Park, NJ | 2.0 | 1.0 | 750 | $2,600 | $3.47 | 26d | 1 | 0.55mi |
| 315 Neptune Blvd Apt 1 Neptune City, NJ | 1.0 | 1.0 | 450 | $2,500 | $5.56 | 45d | 1 | 0.66mi |
| 527 Bangs Ave Asbury Park, NJ | 1.0–2.0 | 1.0–2.0 | 908 | $4,200 | $4.63 | 9d | 5 | 0.78mi |
| 610 Sewall Ave Asbury Park, NJ | 1.0–2.0 | 1.0 | 869 | $2,803 | $3.23 | 1d | 7 | 0.81mi |
| 1217 Ocean Ave Unit B6 Bradley Beach, NJ | 1.0 | 1.0 | 730 | $2,850 | $3.90 | 4d | 1 | 1.06mi |
| 1217 Ocean Ave Unit B6 Bradley Beach, NJ | 1.0 | 1.0 | 731 | $2,850 | $3.90 | 9d | 1 | 1.06mi |
| 1010 Grand Ave Unit C7 Asbury Park, NJ | 1.0 | 1.0 | 675 | $2,300 | $3.41 | 26d | 1 | 1.11mi |
| 308 W Sylvania Ave Neptune, NJ | 1.0 | 1.0 | 700 | $1,825 | $2.61 | 15d | 1 | 1.19mi |
| 308 W Sylvania Ave Neptune, NJ | 1.0 | 1.0 | 700 | $1,825 | $2.61 | 9d | 1 | 1.19mi |
| 212 3rd Ave Unit A3 Asbury Park, NJ | 1.0 | 1.0 | 624 | $2,175 | $3.49 | 1d | 1 | 1.23mi |
| 311 4th Ave #101 Asbury Park, NJ | 1.0 | 1.0 | 442 | $5,000 | $11.31 | 1d | 1 | 1.25mi |
| 1150 Kingsley St Asbury Park, NJ | 1.0–4.0 | 1.0–3.5 | 1526 | $5,485 | $3.59 | 0d | 19 | 1.30mi |
| 402 Sixth Ave Unit 2 Asbury Park, NJ | 1.0 | 1.0 | 585 | $1,995 | $3.41 | 6d | 1 | 1.37mi |
| 402 Sixth Ave Apt 18 Asbury Park, NJ | 1.0 | 1.0 | 495 | $1,895 | $3.83 | 6d | 1 | 1.37mi |
Listing history 3 events
-
2026-03-30status Pending
-
2026-02-27price $279,900
-
2025-12-18$295,000 Active
ⓘ Source: listings_history table (triggers on properties + properties_extension) + one-shot
backfill from property_details.listing_events for pre-trigger history.
Tax reassessment forecast NJ · Partial reset (capped growth)
- Current annual tax
- $3,889 · $324/mo
- Projected year-2 tax
- $5,429 · $452/mo
- Expected delta
- +$1,540/yr (+$128/mo · 39.6%)
ⓘ Screening estimate from a state-policy table — verify with the county assessor before closing.
Climate risk First Street
- Flood 6/10 Major FEMA zone X (unshaded) · 68% chance over 30 yrs
- Wildfire 1/10 Low
- Heat 8/10 Severe 7 d/yr ≥95°F today · 15 d/yr by 30 yrs out
- Wind 8/10 Severe 80% chance of damaging wind over 30 yrs
- Air quality 3/10 Moderate 2 unhealthy d/yr today · 3 by 30 yrs out
Nearby sold comps map
Loading sold comps map…
Walkable amenities ~0.75 mi
Loading nearby amenities…
Taxation est. · year 1
- Rental income
- $31,563
- − Mortgage interest
- −$15,679
- − Property taxes
- −$3,889
- − Insurance
- −$1,400
- − Repairs & maintenance
- −$2,525
- − Management
- −$2,525
- − Depreciation
- −$8,143
- Taxable loss
- −$2,597
- Est. tax savings @ 24.0%
- +$623
- After-tax cash flow
- $2,656/yr
For passive investors: Depreciation is non-cash, so a rental often shows a tax loss while cash-flowing — sheltering income. Rental losses are passive: they offset passive income freely, and up to $25,000/yr can offset ordinary (W-2) income if you actively participate and your MAGI is under $100k (phasing out to $0 by $150k); unused losses carry forward. On sale, claimed depreciation is recaptured at up to 25%, and gains may owe capital-gains tax (a 1031 exchange can defer both). Figures are a year-1 estimate at your 24.0% rate — not tax advice; consult a CPA.
Schools (NCES district)
- District
- Asbury Park School District
- NCES district ID
- 3400930
- Math proficiency
- 3% ▼ -5.00%
- Reading proficiency
- 18% ▲ 1.00%
- Median HH income
- $34,895
- Composite
- 8.54/100
- National rank
- #9903
- State rank
- #470 of 472 in NJ
Livability — Asbury Park
- Score
- 74/100
- State rank
- #171
- US rank
- #4521
Category grades
Schools grade is shown separately in the Schools card above.
Census & demographics
- Census place
- Asbury Park, NJ
- County
- Monmouth County · 505,557 people
- Metro
- New York-Newark-Jersey City, NY-NJ-PA
- Population (ZIP)
- 40,194
- Household income
- $96,725
- Rent vs Own
- Severe rent burden
- 2655.0
Population outlook (Monmouth County) Hauer SSP2
- Today (2025)
- 620,308 people
- By 2030
- 612,309 · -1.3%
- By 2040
- 587,297 · -5.3%
- By 2050
- 551,342 · -11.1%
- By 2075
- 472,934 · -23.8%
- By 2100
- 381,534 · -38.5%
Race, ethnicity, and origin ACS 2023
- Neighborhood character
- Diverse neighborhood (Simpson 0.60)
- Race & ethnicity
- White 58% Hispanic / Latino 18% Black 17% Two or more races 8% Asian 3%
- Hispanic origin (detail)
- Mexican 8% Puerto Rican 3%
- Common ancestry
- Romanian 5% Hispanic 4% Scotch-Irish 2%
- Foreign-born
- 19% · Canada, Dominican Republic, China
- Languages at home
- 75% English-only · Spanish 14% French/Haitian/Cajun 5% Other Indo-European 3%
Political lean MEDSL · Monmouth
- 2024 margin
- R (+11.4) · D 43.4% · R 54.8% · Other 1.8%
- 2008→2024 swing
- -7.7pp toward R · 2008: -3.7pp · 2024: -11.4pp
- All cycles
- 2024: R+11.4 2020: R+2.8 2016: R+9.5 2012: R+5.5 2008: R+3.7
Not yet ingested
- Civics
- —
Market trends
- HPI YoY
- ▼ -451.85%
- Current HPI
- 345.7119
- Rent YoY
- ▲ 2.29%
- Metro
- New York-Newark-Jersey City, NY-NJ-PA
- State GDP YoY
- ▲ 2.05%
- F500 in state
- 34
Industry mix (Fortune 500 HQ in NJ)
| Industry | F500 HQs | Revenue |
|---|---|---|
| Consumer Goods | 3 | $31B |
|
||
| Pharmaceuticals | 2 | $153B |
|
||
| Technology | 2 | $21B |
|
||
| Insurance | 2 | $20B |
|
||
| Healthcare | 2 | $19B |
|
||
| Financial Services | 1 | $70B |
|
||
Price history
-5.1% since first listed3 events — show timeline
- 2026-03-30 Pending — MOMLS
- 2026-02-27 Price Changed $279,900 MOMLS
- 2025-12-18 Listed $295,000 MOMLS
Property tax history
+3.1%/yrLatest (2025): $3,889 · +15.3% YoY. Source: county tax records.
Cash-flow waterfall
monthlySold comps — $/sqft
last 12 mo · ≤1 miLoading sold comps…