626 N Emerson Ave · Indianapolis city (balance), IN
Flood risk 1/10 · Minimal
- FEMA flood zone
- X (unshaded)
- Chance of flooding over 30 yrs
- 0.0%
- Est. flood insurance / yr
- $473 – $860
Fire risk 1/10 · Minimal
- Est. fire insurance / yr
- $717 – $1,331
Heat risk 4/10 · Minor
- Hot days now (above 101°F)
- 7 days/yr
- Hot days in 30 yrs
- 18 days/yr
Wind risk 2/10 · Minimal
- Chance of severe wind over 30 yrs
- 0.0%
Air-quality risk 4/10 · Minor
- Unhealthy air days now
- 5 days/yr
- Unhealthy air days in 30 yrs
- 7 days/yr
Risk factors via First Street. Map © Google.
Why this score? — see what drove the C+ grade
The composite is a weighted blend of 9 inputs, each scored 0–100. Each bar is that input's sub-score; the figure is the points it added to the 100-point composite (weight × sub-score).
- Cash flow +24.8/30.0
- ARV discount +15.0/15.0
- DSCR +8.0/10.0
- 1% rule +6.4/10.0
- Rent growth +3.2/5.0
- Livability +2.5/5.0
- Condition / age +2.5/5.0
- Schools +1.4/10.0
- Appreciation +0.0/10.0
$114,900
🖨 Deal sheet (PDF) 📄 Offer letter ✓ Due diligence
Listing remarks MLS
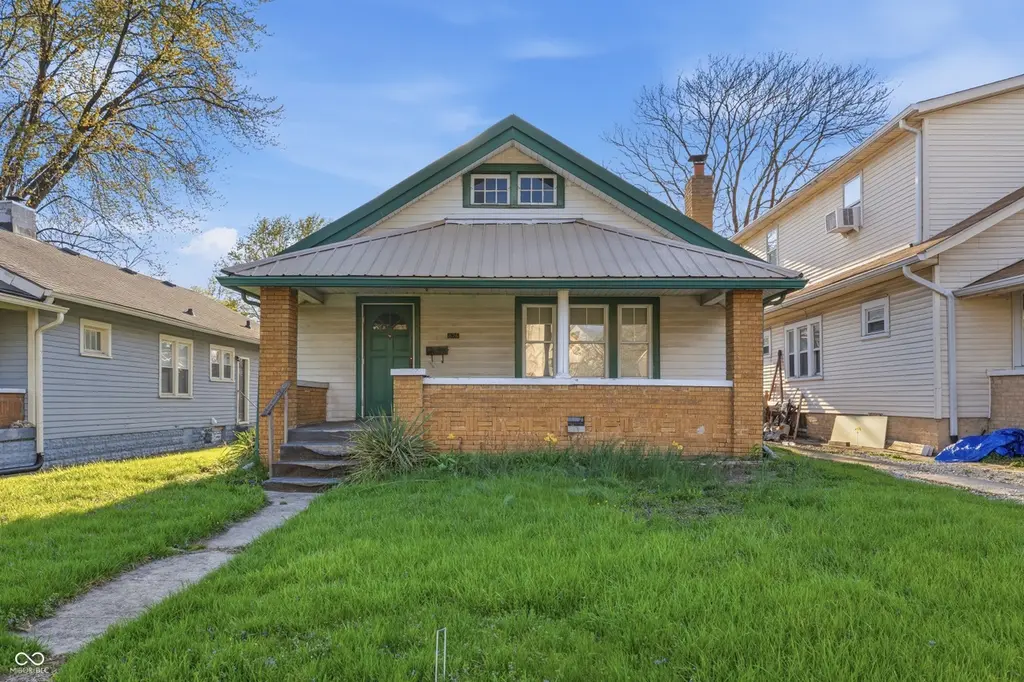
Step inside and feel the character this classic bungalow has to offer. The layout is welcoming and functional, with spaces that feel comfortable and easy to live in. If you've been searching for a home with charm, history, and everyday convenience, this one is worth a closer look. Built in 1920, this single-level SFR offers 1,218 square feet with a vinyl exterior and a thoughtful floor plan. The home features 2 bedrooms and 2 full baths, providing flexibility that's hard to find in a bungalow of this era. While there is no garage, off-alley parking in the back adds convenience and easy access. With its timeless appeal and practical layout, this home offers a great opportunity to enjoy classic style with modern comfort.
Key facts
- 6,708 sq ft lot
- Built 1920
- Listed 132 days
Neighborhood map
What this means for you Summary
Snapshot
- This is a 2-bed/2.0-bath single-family listed at $115k.
Deal economics
- At list price, monthly cash flow is $242 ($3k/yr) — positive.
- The deal already cash-flows at list — no discount required.
- Meets the 1% rule at list price ($1k rent vs $115k).
- Recommended offer: $101k (12.0% below list) — sets the bar for market timing.
- Cap rate 8.8% vs local median 4.4% in Indianapolis city (balance) — top-decile yield for the area; either an underpriced asset or a hidden risk that comps aren't pricing in. Stress-test before assuming the spread holds.
Location & tenants
- Location reads: area grade C — affects rentability + tenant quality, not the cash-flow math above.
- Indianapolis Public Schools (urban): math 14% / reading 20% proficiency, ranked #286 of 301 in IN (top 95%) — low school quality limits family demand, transient renter base, plan for 1-2y turnover; 77% free/reduced lunch — lower-income household profile, screen leases tightly.
- Zoned schools: Frederick Douglass School 19 (math 9% / reading 13%, grade F, #909 of 994 statewide, top 92%, 444 students, 81% FRL); H L Harshman Middle School (math 3% / reading 16%, grade F, #316 of 330 statewide, top 96%, 549 students, 84% FRL).
- Market conditions: Rents rising (+2.6%/yr); 143 active listings in the ZIP; 40 comparable units currently listed for rent nearby; rentals at typical pace (median 25d on market — plan ~3-4 weeks tenant-placement turnaround); 1,906 units permitted in Marion County in 2024 (621 in 5+ unit buildings).
Forward outlook
- Local home prices are declining (-3.0%/yr); year-one equity from $794 of loan paydown is wiped out by about $3k of value loss. Plan a longer hold.
- Marion County population projected at +18% by 2050 — long-run rental-demand tailwind backs the buy-and-hold thesis.
Negotiation context
- It's been on market 132 days — a 12% lower offer ($101k) is reasonable based on typical stale-listing flexibility.
- 6 sale attempts since 18y ago; this cycle's ask has dropped $17k (13%) from the opening price — seller is motivated, your offer sets the floor, not the list.
- Current owner paid $42k; list at $115k implies a 171% gain — meaningful room to come down on a strong offer.
Risks & watch-outs
- Watch-outs: built in 1920 — expect roof / HVAC / electrical / plumbing capex.
Questions for the listing agent
- It's been on market 132 days. Have you received any prior offers? Is the seller open to a 12% concession, seller financing, or rate buy-down credit?
- Built in 1920 — when were the roof, HVAC, electrical panel, plumbing, and water heater last replaced?
- Why hasn't it sold? Are there any deal-killer items the seller is aware of (foundation, flood, title, zoning, code violations)?
- Is there a deadline driving the sale (1031 exchange, divorce, estate, relocation)? That informs how much negotiation room exists.
- What's the average days-on-market for RENTAL listings here right now (not sales)? A rising rental-DOM trend means longer vacancies and softer asking-rent achievability than the comps imply.
- What's the recent tenant-quality profile in this submarket — average credit score on applications, eviction rate, late-payment / NSF rate, and stable-employment percentage? A property-management company in the area should have these aggregated.
- How much new for-sale + rental construction is in the pipeline within 1–3 miles? Heavy new supply typically softens prices + rents 12–24 months out; constrained supply supports both.
Investment metrics
- 1% rule
- 1.14% ✓
- Cap rate
- 8.83%
- Cash-on-cash
- 9.04%
- DSCR
- 1.40
- GRM
- 7.3
CMA / ARV
- ARV (median comp)
- $216,007
- List price
- $114,900
- Delta
- -46.81%
- Verdict
- UNDERPRICED
- Comps
- 20 within 1.0 mi
Show comp detail 12 sales within ~0.75 mi
| Address | Dist | Beds/Ba | Sqft | Sold | Price | $/sf | Match |
|---|---|---|---|---|---|---|---|
| 831 Wallace Ave | 0.36mi | 2/1.0 | 1,320 (+8%) | 1mo | $174,900 | $133 | 64 |
| 5225 E St Clair St | 0.19mi | 3/1.5 (+1) | 1,314 (+8%) | 12mo | $270,000 | $205 | 61 |
| 958 N Hawthorne Ln | 0.38mi | 2/1.0 | 1,255 (+3%) | 16mo | $225,000 | $179 | 60 |
| 817 N Linwood Ave | 0.49mi | 2/1.0 | 1,193 (-2%) | 13mo | $62,000 | $52 | 59 |
| 5017 E 14th St | 0.62mi | 3/1.0 (+1) | 1,290 (+6%) | 4mo | $140,000 | $109 | 49 |
| 729 N Euclid Ave | 0.55mi | 2/1.0 | 1,067 (-12%) | 2mo | $152,000 | $142 | 48 |
| 712 N Linwood Ave | 0.51mi | 3/1.0 (+1) | 1,068 (-12%) | 2mo | $115,000 | $108 | 45 |
| 710 N Drexel Ave | 0.44mi | 2/1.0 | 1,377 (+13%) | 12mo | $77,500 | $56 | 44 |
| 613 N Linwood Ave | 0.48mi | 2/1.0 | 1,378 (+13%) | 18mo | $60,000 | $44 | 37 |
| 4818 E 14th St | 0.67mi | 3/1.0 (+1) | 1,104 (-9%) | 10mo | $168,000 | $152 | 36 |
| 4717 E 11th St | 0.53mi | 2/1.0 | 1,037 (-15%) | 14mo | $186,500 | $180 | 35 |
| 4134 E Saint Clair St E | 0.73mi | 2/1.0 | 1,050 (-14%) | 16mo | $112,000 | $107 | 25 |
Match score weights: distance 35% · size 25% · config 20% · recency 20%. Top-matched comps best support the ARV.
Projected returns pro-forma
-3.0% appreciation · 2.63% rent growth · sell at horizon
- IRR
- -3.0%
- Equity multiple
- 0.89×
- Total profit
- $-3,644
- Equity at exit
- $17,132
- IRR
- 6.3%
- Equity multiple
- 1.46×
- Total profit
- $14,806
- Equity at exit
- $9,934
Cash invested: $32,172 (down + closing). Projections, not guarantees.
Landlord ↔ Tenant lean methodology
- Overall (STATE)
- 90 Strongly Landlord-Friendly
- State Indiana
- 90 Strongly Landlord-Friendly · R+11
- County
- — inherits STATE
- City
- — inherits STATE
ZIP-level market 46219
- Rents YoY
- 2.6%
- Active inventory
- 143
- Price-to-rent
- 7.3×
Monthly cashflow live
- Estimated rent
- $1,307 high interval (Pro) →
- Mortgage (P&I)
- −$603
- Tax from tax record
- −$139 /mo · $1,672/yr
- Insurance
- −$48
- HOA
- −$0
- Vacancy / Maint / Mgmt
- −$274
- Net cashflow
- $242
Break-even live
Sensitivity live
| Price | -10% $307 | -5% $275 | +0% $242 | +5% $210 | +10% $177 |
|---|---|---|---|---|---|
| Rent | -10% $139 | -5% $191 | +0% $242 | +5% $294 | +10% $346 |
| Rate | -1.0pp $300 | -0.5pp $272 | base $242 | +0.5pp $213 | +1.0pp $182 |
UW: 25.0% down · 7.5% · 30yr · 1.5% tax · 5.0% vac · 8.0% maint · 8.0% mgmt
Financing live
Cash to close
- Down payment
- $28,725
- Closing costs
- $3,447
- Reserves months
- —
- Total cash needed
- —
Loan-product check · same deal, 3 products live
Conventional
25% down · 7.5% · 30yr
- Down + closing
- —
- Monthly P&I
- —
- Monthly cashflow
- —
- DSCR
- —
- Eligible?
- —
Personal DTI + credit; lowest rate.
DSCR
20% down · 8.5% · 30yr
- Down + closing
- —
- Monthly P&I
- —
- Monthly cashflow
- —
- DSCR
- —
- Eligible?
- —
No personal income docs; deal must DSCR.
Hard money
10% down · 12.0% · 12mo
- Down + closing
- —
- Monthly P&I
- —
- Monthly cashflow
- —
- DSCR
- —
- Eligible?
- —
Short-term bridge; refi at stabilization.
Rent comps 40 comps
| Address | Beds | Baths | Sqft | Rent | $/sqft | DOM | Units | Dist |
|---|---|---|---|---|---|---|---|---|
| 5105 E North St Indianapolis, IN | 2.0 | 2.0 | 1180 | $2,250 | $1.91 | 45d | 1 | 0.02mi |
| 606 N Emerson Ave Indianapolis, IN | 2.0 | 1.5 | 1372 | $2,450 | $1.79 | 25d | 1 | 0.03mi |
| 508 N Emerson Ave Unit 506 Indianapolis, IN | 2.0 | 1.0 | 950 | $950 | $1.00 | 16d | 1 | 0.06mi |
| 508 Emerson Ave Indianapolis, IN | 3.0 | 1.5 | 1094 | $1,150 | $1.05 | 15d | 1 | 0.06mi |
| 628 N Riley Ave Indianapolis, IN | 2.0 | 1.5 | 948 | $1,295 | $1.37 | 25d | 1 | 0.18mi |
| 822 N Emerson Ave Indianapolis, IN | 2.0 | 1.0 | 928 | $1,050 | $1.13 | 45d | 1 | 0.25mi |
| 415 N Dequincy St Indianapolis, IN | 3.0 | 2.0 | 1250 | $1,900 | $1.52 | 16d | 1 | 0.26mi |
| 306 N Riley Ave Indianapolis, IN | 3.0 | 1.0 | 1320 | $1,095 | $0.83 | 19d | 1 | 0.29mi |
| 775 Dequincy St Indianapolis, IN | 1.0 | 1.0 | 784 | $875 | $1.12 | 25d | 1 | 0.31mi |
| 776 N Dequincy St Indianapolis, IN | 1.0 | 1.0 | 1447 | $975 | $0.67 | 0d | 1 | 0.32mi |
| 5250 E Market St Unit 5252 Indianapolis, IN | 2.0 | 1.0 | 1000 | $1,350 | $1.35 | 16d | 1 | 0.38mi |
| 729 N Bosart Ave Indianapolis, IN | 2.0 | 1.0 | 888 | $1,195 | $1.35 | 25d | 1 | 0.39mi |
| 4 N Butler Ave Unit 8 Indianapolis, IN | 2.0 | 1.0 | 850 | $800 | $0.94 | 45d | 1 | 0.40mi |
| 4 N Butler Ave Unit 11 Indianapolis, IN | 2.0 | 1.0 | 850 | $750 | $0.88 | 6d | 1 | 0.40mi |
| 706 N Bosart Ave Indianapolis, IN | 2.0 | 1.0 | 1000 | $1,070 | $1.07 | 25d | 1 | 0.41mi |
| 4926 E Washington St Apt 5 Indianapolis, IN | 1.0 | 1.0 | 700 | $895 | $1.28 | 45d | 1 | 0.43mi |
| 25 S Emerson Ave Indianapolis, IN | 1.0 | 1.0 | 710 | $649 | $0.91 | 45d | 1 | 0.45mi |
| 861 N Drexel Ave Indianapolis, IN | 3.0 | 1.0 | 1000 | $1,200 | $1.20 | 9d | 1 | 0.49mi |
| 861 N Drexel Ave Unit 863 Indianapolis, IN | 3.0 | 1.0 | 1000 | $1,200 | $1.20 | 45d | 1 | 0.49mi |
| 4831 E Washington St Unit 4 Indianapolis, IN | 2.0 | 2.0 | 1000 | $995 | $0.99 | 25d | 1 | 0.50mi |
| 4815 E Washington St Unit 4815-12 Indianapolis, IN | 1.0 | 1.0 | 700 | $950 | $1.36 | 45d | 1 | 0.51mi |
| 622 N Linwood Ave Indianapolis, IN | 3.0 | 2.0 | 985 | $1,299 | $1.32 | 45d | 1 | 0.53mi |
| 4741 E Washington St Indianapolis, IN | 1.0 | 1.0 | 700 | $950 | $1.36 | 23d | 1 | 0.57mi |
| 25 N Drexel Ave Unit A Indianapolis, IN | 3.0 | 2.0 | 1250 | $1,325 | $1.06 | 45d | 1 | 0.58mi |
| 4417 Linwood Ct Indianapolis, IN | 2.0 | 1.0 | 780 | $929 | $1.19 | 5d | 15 | 0.59mi |
| 953 N Linwood Ave Indianapolis, IN | 2.0 | 1.0 | 960 | $1,325 | $1.38 | 45d | 1 | 0.60mi |
| 521 N Gladstone Ave Indianapolis, IN | 1.0 | 1.0 | 816 | $1,100 | $1.35 | 21d | 1 | 0.69mi |
| 521 N Gladstone Ave Unit B Indianapolis, IN | 1.0 | 1.0 | 816 | $900 | $1.10 | 0d | 1 | 0.69mi |
| 521 N Gladstone Ave Unit B Indianapolis, IN | 1.0 | 1.0 | 816 | $900 | $1.10 | 9d | 1 | 0.69mi |
| 4214 E Washington St Indianapolis, IN | 3.0 | 2.0 | 961 | $1,145 | $1.19 | 0d | 1 | 0.80mi |
| 4214 E Washington St Indianapolis, IN | 3.0 | 2.0 | 961 | $1,195 | $1.24 | 9d | 1 | 0.80mi |
| 119 N Grant Ave Indianapolis, IN | 3.0 | 1.0 | 1408 | $1,195 | $0.85 | 45d | 1 | 0.82mi |
| 4919 Orion Ave Indianapolis, IN | 2.0 | 1.0 | 766 | $875 | $1.14 | 45d | 1 | 0.83mi |
| 4931 Orion Ave Indianapolis, IN | 2.0 | 1.0 | 1200 | $1,450 | $1.21 | 25d | 1 | 0.83mi |
| 29 S Audubon Rd Indianapolis, IN | 1.0–2.0 | 1.0 | 670 | $989 | $1.48 | 15d | 5 | 0.84mi |
| 5750 E Washington St Indianapolis, IN | 2.0 | 1.0 | 1186 | $1,100 | $0.93 | 4d | 2 | 0.85mi |
| 4114 E Washington St Indianapolis, IN | 2.0 | 1.0 | 909 | $1,100 | $1.21 | 46d | 1 | 0.85mi |
| 5131 E Burgess Ave Indianapolis, IN | 2.0 | 1.0 | 816 | $1,100 | $1.35 | 45d | 1 | 0.90mi |
| 5131 E Burgess Ave Indianapolis, IN | 2.0 | 1.0 | 816 | $1,100 | $1.35 | 0d | 1 | 0.90mi |
| 5819 E Washington St #13 Indianapolis, IN | 1.0 | 1.0 | 700 | $795 | $1.14 | 45d | 1 | 0.90mi |
Listing history 14 events
-
2026-05-18status Pending 731-char remark
Show marketing remark (731 chars)
Step inside and feel the character this classic bungalow has to offer. The layout is welcoming and functional, with spaces that feel comfortable and easy to live in. If you've been searching for a home with charm, history, and everyday convenience, this one is worth a closer look. Built in 1920, this single-level SFR offers 1,218 square feet with a vinyl exterior and a thoughtful floor plan. The home features 2 bedrooms and 2 full baths, providing flexibility that's hard to find in a bungalow of this era. While there is no garage, off-alley parking in the back adds convenience and easy access. With its timeless appeal and practical layout, this home offers a great opportunity to enjoy classic style with modern comfort.
-
2026-03-27price $114,900 731-char remark
Show marketing remark (731 chars)
Step inside and feel the character this classic bungalow has to offer. The layout is welcoming and functional, with spaces that feel comfortable and easy to live in. If you've been searching for a home with charm, history, and everyday convenience, this one is worth a closer look. Built in 1920, this single-level SFR offers 1,218 square feet with a vinyl exterior and a thoughtful floor plan. The home features 2 bedrooms and 2 full baths, providing flexibility that's hard to find in a bungalow of this era. While there is no garage, off-alley parking in the back adds convenience and easy access. With its timeless appeal and practical layout, this home offers a great opportunity to enjoy classic style with modern comfort.
-
2026-03-17price $124,900 731-char remark
Show marketing remark (731 chars)
Step inside and feel the character this classic bungalow has to offer. The layout is welcoming and functional, with spaces that feel comfortable and easy to live in. If you've been searching for a home with charm, history, and everyday convenience, this one is worth a closer look. Built in 1920, this single-level SFR offers 1,218 square feet with a vinyl exterior and a thoughtful floor plan. The home features 2 bedrooms and 2 full baths, providing flexibility that's hard to find in a bungalow of this era. While there is no garage, off-alley parking in the back adds convenience and easy access. With its timeless appeal and practical layout, this home offers a great opportunity to enjoy classic style with modern comfort.
-
2026-02-27status Active 731-char remark
Show marketing remark (731 chars)
Step inside and feel the character this classic bungalow has to offer. The layout is welcoming and functional, with spaces that feel comfortable and easy to live in. If you've been searching for a home with charm, history, and everyday convenience, this one is worth a closer look. Built in 1920, this single-level SFR offers 1,218 square feet with a vinyl exterior and a thoughtful floor plan. The home features 2 bedrooms and 2 full baths, providing flexibility that's hard to find in a bungalow of this era. While there is no garage, off-alley parking in the back adds convenience and easy access. With its timeless appeal and practical layout, this home offers a great opportunity to enjoy classic style with modern comfort.
-
2026-02-06status Pending 731-char remark
Show marketing remark (731 chars)
Step inside and feel the character this classic bungalow has to offer. The layout is welcoming and functional, with spaces that feel comfortable and easy to live in. If you've been searching for a home with charm, history, and everyday convenience, this one is worth a closer look. Built in 1920, this single-level SFR offers 1,218 square feet with a vinyl exterior and a thoughtful floor plan. The home features 2 bedrooms and 2 full baths, providing flexibility that's hard to find in a bungalow of this era. While there is no garage, off-alley parking in the back adds convenience and easy access. With its timeless appeal and practical layout, this home offers a great opportunity to enjoy classic style with modern comfort.
-
2025-12-16$132,000 Active 731-char remark
Show marketing remark (731 chars)
Step inside and feel the character this classic bungalow has to offer. The layout is welcoming and functional, with spaces that feel comfortable and easy to live in. If you've been searching for a home with charm, history, and everyday convenience, this one is worth a closer look. Built in 1920, this single-level SFR offers 1,218 square feet with a vinyl exterior and a thoughtful floor plan. The home features 2 bedrooms and 2 full baths, providing flexibility that's hard to find in a bungalow of this era. While there is no garage, off-alley parking in the back adds convenience and easy access. With its timeless appeal and practical layout, this home offers a great opportunity to enjoy classic style with modern comfort.
-
2025-11-08$73,000
-
2011-11-07historical
-
2011-11-04soldstatus $42,400
-
2011-04-25$42,400
-
2011-02-26historical
-
2010-08-27$46,800
-
2008-11-24soldstatus $29,500
-
2008-09-16$34,500
ⓘ Source: listings_history table (triggers on properties + properties_extension) + one-shot
backfill from property_details.listing_events for pre-trigger history.
Tax reassessment forecast IN · Partial reset (capped growth)
- Current annual tax
- $1,672 · $139/mo
- Projected year-2 tax
- $1,672 · $139/mo
- Expected delta
- $0/yr ($0/mo · 0.0%)
ⓘ Screening estimate from a state-policy table — verify with the county assessor before closing.
Climate risk First Street
- Flood 1/10 Low FEMA zone X (unshaded) · 0% chance over 30 yrs
- Wildfire 1/10 Low
- Heat 4/10 Moderate 7 d/yr ≥101°F today · 18 d/yr by 30 yrs out
- Wind 2/10 Low 0% chance of damaging wind over 30 yrs
- Air quality 4/10 Moderate 5 unhealthy d/yr today · 7 by 30 yrs out
Nearby sold comps map
Loading sold comps map…
Walkable amenities ~0.75 mi
Loading nearby amenities…
Taxation est. · year 1
- Rental income
- $15,680
- − Mortgage interest
- −$6,436
- − Property taxes
- −$1,672
- − Insurance
- −$574
- − Repairs & maintenance
- −$1,254
- − Management
- −$1,254
- − Depreciation
- −$3,343
- Taxable income
- $1,145
- Est. tax owed @ 24.0%
- −$275
- After-tax cash flow
- $2,635/yr
For passive investors: Depreciation is non-cash, so a rental often shows a tax loss while cash-flowing — sheltering income. Rental losses are passive: they offset passive income freely, and up to $25,000/yr can offset ordinary (W-2) income if you actively participate and your MAGI is under $100k (phasing out to $0 by $150k); unused losses carry forward. On sale, claimed depreciation is recaptured at up to 25%, and gains may owe capital-gains tax (a 1031 exchange can defer both). Figures are a year-1 estimate at your 24.0% rate — not tax advice; consult a CPA.
Schools (NCES district)
- District
- Indianapolis Public Schools
- NCES district ID
- 1804770
- Math proficiency
- 14% ▼ -7.00%
- Reading proficiency
- 20% ▼ -3.00%
- Median HH income
- $32,034
- Composite
- 13.69/100
- National rank
- #9499
- State rank
- #286 of 301 in IN
Livability — Indianapolis city (balance)
No livability data for this city. (Only ~50 U.S. cities are tracked.)
Census & demographics
- Census place
- Indianapolis city (balance), IN
- County
- Marion County · 998,460 people
- City population
- 881,119
- Metro
- Indianapolis-Carmel-Anderson, IN
- Population (ZIP)
- 38,855
- Household income
- $60,803
- Rent vs Own
- Severe rent burden
- 2191.0
Population outlook (Marion County) Hauer SSP2
- Today (2025)
- 1,025,572 people
- By 2030
- 1,065,727 · +3.9%
- By 2040
- 1,141,577 · +11.3%
- By 2050
- 1,208,920 · +17.9%
- By 2075
- 1,367,288 · +33.3%
- By 2100
- 1,438,201 · +40.2%
Race, ethnicity, and origin ACS 2023
- Neighborhood character
- Diverse neighborhood (Simpson 0.63)
- Race & ethnicity
- White 54% Black 22% Hispanic / Latino 18% Two or more races 9%
- Hispanic origin (detail)
- Mexican 10% Puerto Rican 1%
- Common ancestry
- Slovak 2% Romanian 2% Lithuanian 2%
- Foreign-born
- 10% · Canada
- Languages at home
- 85% English-only · Spanish 14%
Political lean MEDSL · Marion
- 2024 margin
- Strong D (+27.7) · D 63.0% · R 35.3% · Other 1.7%
- 2008→2024 swing
- -0.7pp no change · 2008: 28.4pp · 2024: 27.7pp
- All cycles
- 2024: D+27.7 2020: D+29.1 2016: D+22.8 2012: D+22.2 2008: D+28.4
Not yet ingested
- Civics
- —
Market trends
- HPI YoY
- ▼ -199.69%
- Current HPI
- 289.8788
- Rent YoY
- ▲ 2.63%
- Metro
- Indianapolis-Carmel-Anderson, IN
- State GDP YoY
- ▲ 2.90%
- F500 in state
- 18
Industry mix (Fortune 500 HQ in IN)
| Industry | F500 HQs | Revenue |
|---|---|---|
| Industrial Machinery | 2 | $37B |
|
||
| Healthcare | 1 | $177B |
|
||
| Pharmaceuticals | 1 | $45B |
|
||
| Metals / Steel | 1 | $18B |
|
||
| Agriculture | 1 | $17B |
|
||
| Packaging | 1 | $12B |
|
||
Price history
+233.0% since first listed14 events — show timeline
- 2026-05-18 Pending — MIBOR as Distributed by MLS Grid
- 2026-03-27 Price Changed $114,900 MIBOR as Distributed by MLS Grid
- 2026-03-17 Price Changed $124,900 MIBOR as Distributed by MLS Grid
- 2026-02-27 Relisted — MIBOR as Distributed by MLS Grid
- 2026-02-06 Pending — MIBOR as Distributed by MLS Grid
- 2025-12-16 Listed $132,000 MIBOR as Distributed by MLS Grid
- 2025-11-08 Listed $73,000 MIBOR as Distributed by MLS Grid
- 2011-11-07 Listing Removed — MIBOR as Distributed by MLS Grid
- 2011-11-04 Sold (MLS) $42,400 MIBOR as Distributed by MLS Grid
- 2011-04-25 Listed $42,400 MIBOR as Distributed by MLS Grid
- 2011-02-26 Listing Removed — MIBOR as Distributed by MLS Grid
- 2010-08-27 Listed $46,800 MIBOR as Distributed by MLS Grid
- 2008-11-24 Sold (MLS) $29,500 MIBOR as Distributed by MLS Grid
- 2008-09-16 Listed $34,500 MIBOR as Distributed by MLS Grid
Property tax history
+12.1%/yrLatest (2025): $1,672 · -0.3% YoY. Source: county tax records.
Cash-flow waterfall
monthlySold comps — $/sqft
last 12 mo · ≤1 miLoading sold comps…