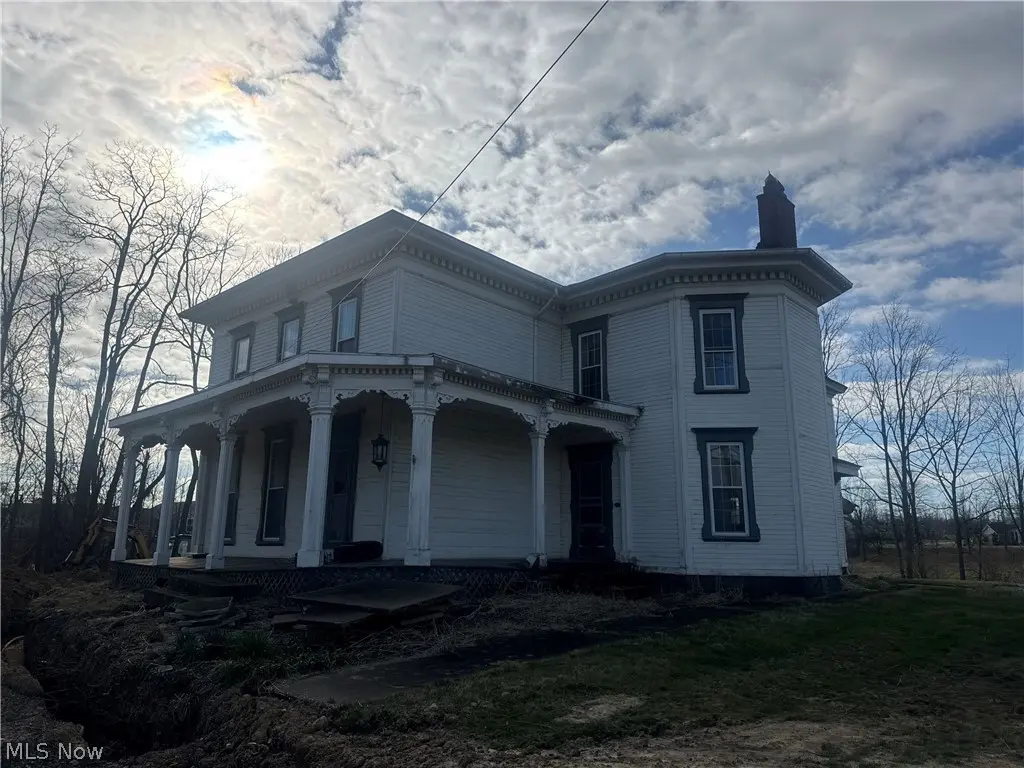
3495 Center Rd · Poland, OH
Flood risk 1/10 · Minimal
- FEMA flood zone
- X (unshaded)
- Chance of flooding over 30 yrs
- 0.0%
- Est. flood insurance / yr
- $473 – $860
Fire risk 1/10 · Minimal
- Est. fire insurance / yr
- $713 – $1,323
Heat risk 2/10 · Minimal
- Hot days now (above 95°F)
- 7 days/yr
- Hot days in 30 yrs
- 16 days/yr
Wind risk 1/10 · Minimal
- Chance of severe wind over 30 yrs
- —
Air-quality risk 2/10 · Minimal
- Unhealthy air days now
- 1 days/yr
- Unhealthy air days in 30 yrs
- 3 days/yr
Risk factors via First Street. Map © Google.
Why this score? — see what drove the D grade
The composite is a weighted blend of 9 inputs, each scored 0–100. Each bar is that input's sub-score; the figure is the points it added to the 100-point composite (weight × sub-score).
- Cash flow +11.9/30.0
- ARV discount +7.5/15.0
- Schools +6.4/10.0
- Livability +4.1/5.0
- 1% rule +3.8/10.0
- DSCR +3.5/10.0
- Rent growth +2.5/5.0
- Condition / age +2.5/5.0
- Appreciation +0.0/10.0
$200,000
🖨 Deal sheet 📄 Offer letter ✓ Due diligence
Listing remarks
Home is in the Process of a Re-Plat. Selling as in present condition.
Key facts
- 1 acre lot
- Built 1830
Neighborhood map
What this means for you Summary
Snapshot
- This is a 4-bed/2.5-bath single-family listed at $200k.
Deal economics
- At list price, monthly cash flow is $-51 ($-617/yr) — negative.
- To cash-flow at today's rent, offer at most $191k (4.5% below list).
- To meet the 1% rule (rent ≥ 1% of price), the offer needs to be $176k (11.9% below list).
- Recommended offer: $176k (11.9% below list) — sets the bar for 1% rule.
- Cap rate 6.0% vs local median 3.4% in Poland — top-decile yield for the area; either an underpriced asset or a hidden risk that comps aren't pricing in. Stress-test before assuming the spread holds.
Location & tenants
- Location reads 82/100 on livability (#72 in OH, #1,108 nationally) — a professional / high-income tenant draw. Strengths: schools A+, crime A+, cost of living A+; Watch: amenities F, commute F.
- Poland Local (suburban): math 70% / reading 78% proficiency, ranked #94 of 656 in OH (top 14%) — strong family-tenant draw, lease renewals of 3-5y typical; only 12% free/reduced lunch — higher-income household profile.
- Market conditions: 155 active listings in the ZIP; solid renter incomes; 147 units permitted in Mahoning County in 2024 (0 in 5+ unit buildings).
Forward outlook
- Local home prices are declining (-3.0%/yr); year-one equity from $1k of loan paydown is wiped out by about $6k of value loss. Plan a longer hold.
- Mahoning County population projected at -14% by 2050 — secular population decline; favor cash flow + early exit over multi-decade hold.
Negotiation context
- Only 1 days on market — expect competitive offers; lowballing is unlikely to land.
- 2 sale attempts since 4y ago with the ask held roughly flat each time — persistent listings suggest the price (not the market) is what's stuck; bring a comps-based counter.
Risks & watch-outs
- Watch-outs: built in 1830 — expect roof / HVAC / electrical / plumbing capex.
Questions for the listing agent
- What do current leases actually rent for vs. the listed asking? Can we see a recent rent roll and the last 12 months of T-12 income?
- Built in 1830 — when were the roof, HVAC, electrical panel, plumbing, and water heater last replaced?
- Is there a deadline driving the sale (1031 exchange, divorce, estate, relocation)? That informs how much negotiation room exists.
- Schools are A-rated — typically a magnet for longer-tenancy family renters. What's the average tenant stay here, and is there a school-zone premium baked into asking?
- The area grade is low — what's the realistic commute time and amenity access for the typical tenant pool here? Any planned neighborhood developments (good or bad) we should know about?
- What's the average days-on-market for RENTAL listings here right now (not sales)? A rising rental-DOM trend means longer vacancies and softer asking-rent achievability than the comps imply.
- What's the recent tenant-quality profile in this submarket — average credit score on applications, eviction rate, late-payment / NSF rate, and stable-employment percentage? A property-management company in the area should have these aggregated.
- How much new for-sale + rental construction is in the pipeline within 1–3 miles? Heavy new supply typically softens prices + rents 12–24 months out; constrained supply supports both.
Investment metrics
- 1% rule
- 0.88% ✗
- Cap rate
- 5.98%
- Cash-on-cash
- -1.10%
- DSCR
- 0.95
- GRM
- 9.5
CMA / ARV
- ARV (on-the-fly)
- $484,120
- Comps found
- 12
Show comp detail 12 sales within ~0.75 mi
| Address | Dist | Beds/Ba | Sqft | Sold | Price | $/sf | Match |
|---|---|---|---|---|---|---|---|
| 6873 Luteran Ln | 0.54mi | 3/3.5 (-1) | 2,666 (+0%) | 2mo | $465,000 | $174 | 64 |
| 3690 St James Way | 0.61mi | 4/2.5 | 2,697 (+1%) | 8mo | $580,000 | $215 | 62 |
| 3081 Heatherbrae Dr | 0.48mi | 5/2.5 (+1) | 2,500 (-6%) | 1mo | $390,000 | $156 | 61 |
| 6303 Clingan Rd | 0.34mi | 5/2.0 (+1) | 2,799 (+5%) | 10mo | $260,000 | $93 | 60 |
| 3327 Hampton Hall | 0.23mi | 4/3.0 | 3,000 (+13%) | 8mo | $699,999 | $233 | 60 |
| 6675 Luteran Ln | 0.41mi | 4/4.0 | 2,654 (-0%) | 20mo | $539,000 | $203 | 58 |
| 7110 Garden Pl Dr | 0.63mi | 4/3.5 | 2,800 (+5%) | 0mo | $885,000 | $316 | 57 |
| 6829 Katahdin Dr | 0.54mi | 5/3.5 (+1) | 2,772 (+4%) | 3mo | $385,000 | $139 | 56 |
| 3655 Saint James Way | 0.62mi | 3/2.5 (-1) | 2,864 (+8%) | 3mo | $520,000 | $182 | 51 |
| 6869 Boardwalk Dr | 0.52mi | 4/3.0 | 3,043 (+14%) | 6mo | $600,000 | $197 | 44 |
| 3022 Heatherbrae Dr | 0.58mi | 4/3.0 | 2,320 (-13%) | 10mo | $307,000 | $132 | 41 |
| 237 Evergreen Dr | 0.65mi | 4/2.0 | 2,465 (-7%) | 18mo | $319,900 | $130 | 40 |
Match score weights: distance 35% · size 25% · config 20% · recency 20%. Top-matched comps best support the ARV.
Projected returns pro-forma
-3.0% appreciation · 3.0% rent growth · sell at horizon
- IRR
- -18.1%
- Equity multiple
- 0.36×
- Total profit
- $-35,620
- Equity at exit
- $29,821
- IRR
- -10.2%
- Equity multiple
- 0.38×
- Total profit
- $-34,976
- Equity at exit
- $17,292
Cash invested: $56,000 (down + closing). Projections, not guarantees.
Landlord ↔ Tenant lean methodology
- Overall (STATE)
- 73 Landlord-Friendly
- State Ohio
- 73 Landlord-Friendly · R+6
- County
- — inherits STATE
- City
- — inherits STATE
ZIP-level market 44514
- Home prices YoY
- -23.8%
- Active inventory
- 155
- Price-to-rent
- 9.5×
Monthly cashflow live
- Estimated rent
- $1,761 medium interval (Pro) →
- Mortgage (P&I)
- −$1,049
- Tax from tax record
- −$310 /mo · $3,726/yr
- Insurance
- −$83
- HOA
- −$0
- Vacancy / Maint / Mgmt
- −$370
- Net cashflow
- $-51
Break-even live
UW: 25.0% down · 7.5% · 30yr · 1.5% tax · 5.0% vac · 8.0% maint · 8.0% mgmt
Financing live
Cash to close
- Down payment
- $50,000
- Closing costs
- $6,000
- Reserves months
- —
- Total cash needed
- —
Loan-product check · same deal, 3 products live
Conventional
25% down · 7.5% · 30yr
- Down + closing
- —
- Monthly P&I
- —
- Monthly cashflow
- —
- DSCR
- —
- Eligible?
- —
Personal DTI + credit; lowest rate.
DSCR
20% down · 8.5% · 30yr
- Down + closing
- —
- Monthly P&I
- —
- Monthly cashflow
- —
- DSCR
- —
- Eligible?
- —
No personal income docs; deal must DSCR.
Hard money
10% down · 12.0% · 12mo
- Down + closing
- —
- Monthly P&I
- —
- Monthly cashflow
- —
- DSCR
- —
- Eligible?
- —
Short-term bridge; refi at stabilization.
Listing history 5 events
-
2026-03-30status Pending
-
2026-03-27$200,000 Active
-
2023-08-08historical
-
2022-11-13price $295,000
-
2022-09-26$395,000 Active
ⓘ Source: listings_history table (triggers on properties + properties_extension) + one-shot
backfill from property_details.listing_events for pre-trigger history.
Tax reassessment forecast OH · Partial reset (capped growth)
- Current annual tax
- $3,726 · $310/mo
- Projected year-2 tax
- $3,726 · $310/mo
- Expected delta
- $0/yr ($0/mo · 0.0%)
ⓘ Screening estimate from a state-policy table — verify with the county assessor before closing.
Climate risk First Street
- Flood 1/10 Low FEMA zone X (unshaded) · 0% chance over 30 yrs
- Wildfire 1/10 Low
- Heat 2/10 Low 7 d/yr ≥95°F today · 16 d/yr by 30 yrs out
- Wind 1/10 Low
- Air quality 2/10 Low 1 unhealthy d/yr today · 3 by 30 yrs out
Nearby sold comps map
Loading sold comps map…
Walkable amenities ~0.75 mi
Loading nearby amenities…
Taxation est. · year 1
- Rental income
- $21,132
- − Mortgage interest
- −$11,203
- − Property taxes
- −$3,726
- − Insurance
- −$1,000
- − Repairs & maintenance
- −$1,691
- − Management
- −$1,691
- − Depreciation
- −$5,818
- Taxable loss
- −$3,996
- Est. tax savings @ 24.0%
- +$959
- After-tax cash flow
- $342/yr
For passive investors: Depreciation is non-cash, so a rental often shows a tax loss while cash-flowing — sheltering income. Rental losses are passive: they offset passive income freely, and up to $25,000/yr can offset ordinary (W-2) income if you actively participate and your MAGI is under $100k (phasing out to $0 by $150k); unused losses carry forward. On sale, claimed depreciation is recaptured at up to 25%, and gains may owe capital-gains tax (a 1031 exchange can defer both). Figures are a year-1 estimate at your 24.0% rate — not tax advice; consult a CPA.
Schools (NCES district)
- District
- Poland Local
- NCES district ID
- 3904834
- Math proficiency
- 70% ▼ -14.00%
- Reading proficiency
- 78% ▼ -4.00%
- Median HH income
- $66,236
- Composite
- 64.21/100
- National rank
- #564
- State rank
- #94 of 656 in OH
Livability — Poland
- Score
- 82/100
- State rank
- #72
- US rank
- #1108
Category grades
Schools grade is shown separately in the Schools card above.
Census & demographics
- County
- Mahoning County · 84,956 people
- City population
- 23,917
- Metro
- Youngstown-Warren-Boardman, OH-PA
- Population (ZIP)
- 23,917
- Household income
- $79,808
- Rent vs Own
- Severe rent burden
- 411.0
Population outlook (Mahoning County) Hauer SSP2
- Today (2025)
- 223,932 people
- By 2030
- 218,387 · -2.5%
- By 2040
- 205,367 · -8.3%
- By 2050
- 193,606 · -13.5%
- By 2075
- 173,694 · -22.4%
- By 2100
- 151,147 · -32.5%
Race, ethnicity, and origin ACS 2023
- Neighborhood character
- Predominantly White (91%)
- Race & ethnicity
- White 91% Two or more races 4% Hispanic / Latino 3% Black 2%
- Common ancestry
- Romanian 6% Slovak 2% Lithuanian 2%
- Foreign-born
- 2% · Canada
- Languages at home
- 95% English-only · Other Indo-European 2% Spanish 2%
Political lean MEDSL · Mahoning
- 2024 margin
- Lean R (+9.4) · D 44.9% · R 54.4%
- 2008→2024 swing
- -36.1pp toward R · 2008: 26.6pp · 2024: -9.4pp
- All cycles
- 2024: R+9.4 2020: R+1.9 2016: D+3.0 2012: D+27.7 2008: D+26.6
Not yet ingested
- Civics
- —
Market trends
- HPI YoY
- ▼ -65.78%
- Current HPI
- 210.5511
- Rent YoY
- —
- Metro
- Youngstown-Warren-Boardman, OH-PA
- State GDP YoY
- ▲ 1.98%
- F500 in state
- 48
Industry mix (Fortune 500 HQ in OH)
| Industry | F500 HQs | Revenue |
|---|---|---|
| Insurance | 3 | $145B |
|
||
| Industrial Machinery | 3 | $49B |
|
||
| Financial Services | 3 | $24B |
|
||
| Consumer Goods | 2 | $93B |
|
||
| Aerospace / Defense | 2 | $47B |
|
||
| Utilities | 2 | $33B |
|
||
Price history
-49.4% since first listed5 events — show timeline
- 2026-03-30 Pending — MLSNOW
- 2026-03-27 Listed $200,000 MLSNOW
- 2023-08-08 Listing Removed — MLSNOW
- 2022-11-13 Price Changed $295,000 MLSNOW
- 2022-09-26 Listed $395,000 MLSNOW
Property tax history
+3.5%/yrLatest (2025): $3,726 · -2.8% YoY. Source: county tax records.
Cash-flow waterfall
monthlySold comps — $/sqft
last 12 mo · ≤1 miLoading sold comps…