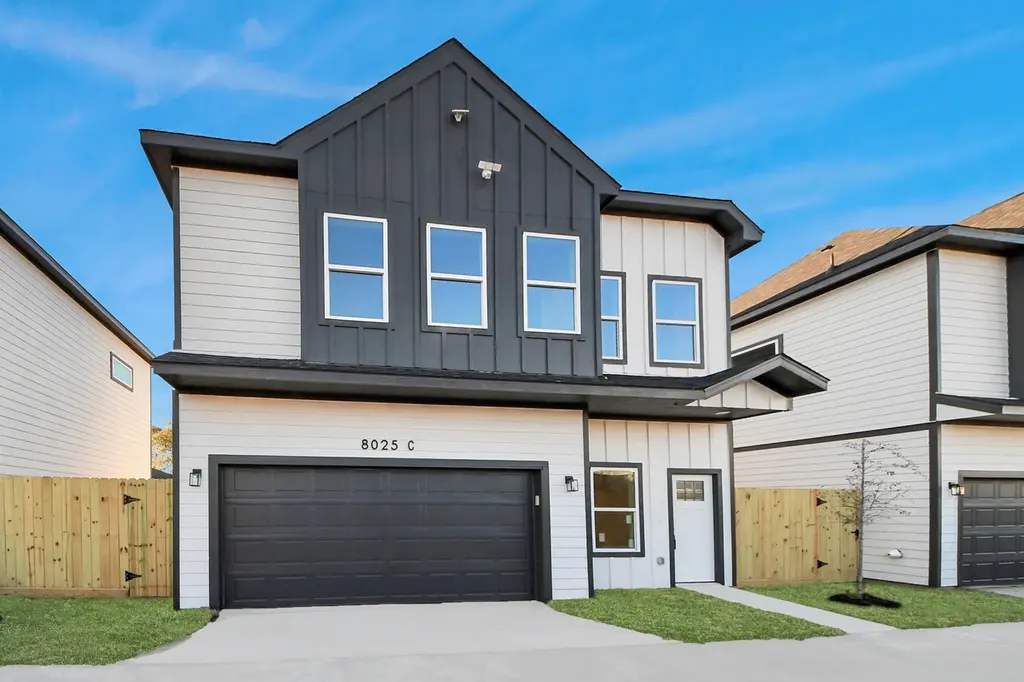
8025 Peachtree St Unit C · Houston, TX
Flood risk No data
- FEMA flood zone
- —
- Chance of flooding over 30 yrs
- —
- Est. flood insurance / yr
- —
Fire risk No data
- Est. fire insurance / yr
- —
Heat risk No data
- Hot days now (above threshold)
- —
- Hot days in 30 yrs
- —
Wind risk No data
- Chance of severe wind over 30 yrs
- —
Air-quality risk No data
- Unhealthy air days now
- —
- Unhealthy air days in 30 yrs
- —
Risk factors via First Street. Map © Google.
Why this score? — see what drove the D grade
The composite is a weighted blend of 9 inputs, each scored 0–100. Each bar is that input's sub-score; the figure is the points it added to the 100-point composite (weight × sub-score).
- Cash flow +10.8/30.0
- Appreciation +9.3/10.0
- Condition / age +4.0/5.0
- Livability +3.7/5.0
- 1% rule +3.2/10.0
- DSCR +3.1/10.0
- Schools +2.7/10.0
- Rent growth +2.6/5.0
- ARV discount +1.0/15.0
$249,999
🖨 Deal sheet 📄 Offer letter ✓ Due diligence
Listing remarks MLS
Freshly completed in Trinity/Houston Gardens, this brand-new 3-bedroom, 2-bath home brings a sharp, modern presence to one of Houston’s most storied neighborhoods. The main level centers around an open kitchen–living layout with clear sightlines, balanced light, and a pantry that keeps the space organized. All bedrooms are upstairs, each with a full-entry closet and straightforward functionality. An attached 2-car garage adds everyday convenience, and the location places you close to Downtown, the emerging East River district, UHD, and quick routes along I-610 and I-69—offering a direct link to some of the city’s most active corridors.
Key facts
- Pantry
- Attached garage
- Full entry closet
Tags
Neighborhood map
What this means for you Summary
Snapshot
- This is a 3-bed/2.0-bath single-family listed at $250k. Condition is rated good.
Deal economics
- At list price, monthly cash flow is $-116 ($-1k/yr) — negative.
- To cash-flow at today's rent, offer at most $233k (6.7% below list).
- To meet the 1% rule (rent ≥ 1% of price), the offer needs to be $204k (18.4% below list).
- Recommended offer: $204k (18.4% below list) — sets the bar for 1% rule.
- Cap rate 5.7% vs local median 3.2% in Houston — top-decile yield for the area; either an underpriced asset or a hidden risk that comps aren't pricing in. Stress-test before assuming the spread holds.
Location & tenants
- Location reads 74/100 on livability (#184 in TX, #4,771 nationally) — a middle-class / working-renter tenant base. Strengths: amenities A+, cost of living A+, housing A+; Watch: schools D, crime F.
- Houston ISD (urban): math 27% / reading 35% proficiency, ranked #593 of 826 in TX (top 72%) — families likely to look elsewhere, expect single-tenant / working-renter base with shorter leases; 71% free/reduced lunch — lower-income household profile, screen leases tightly.
- Market conditions: Rents flat; 372 active listings in the ZIP; 25 comparable units currently listed for rent nearby; rentals lingering (median 44d on market — plan ~5-8 weeks vacancy on turnover, expect pricing pressure); 52% of comp listings sitting > 30 days — soft ceiling on asking rent; 29,883 units permitted in Harris County in 2024 (8,621 in 5+ unit buildings).
- At $2,040/mo this rent would consume 51% of the median local household income ($48k/yr) (locally 1297% of renters already pay >50% of income on rent) — very limited rent-growth headroom before tenants either downsize or default.
Forward outlook
- In year one you build about $23k of equity ($2k loan paydown + $22k appreciation (8.7% local appreciation)).
- Harris County population projected at +47% by 2050 — long-run rental-demand tailwind backs the buy-and-hold thesis.
- By year 2, paydown + projected appreciation supports a ~$37k cash-out refi (75% LTV) — recoverable capital for the next deal without selling this one.
Negotiation context
- It's been on market 132 days — a 12% lower offer ($220k) is reasonable based on typical stale-listing flexibility.
- 3 sale attempts; this cycle's ask is 11805% above the opening price — seller raised mid-cycle; expect resistance to lowballs.
Questions for the listing agent
- What do current leases actually rent for vs. the listed asking? Can we see a recent rent roll and the last 12 months of T-12 income?
- It's been on market 132 days. Have you received any prior offers? Is the seller open to a 18% concession, seller financing, or rate buy-down credit?
- Why hasn't it sold? Are there any deal-killer items the seller is aware of (foundation, flood, title, zoning, code violations)?
- Is there a deadline driving the sale (1031 exchange, divorce, estate, relocation)? That informs how much negotiation room exists.
- Schools are D-rated, which usually means shorter tenancies and higher turnover. Who's the typical renter profile here, and what's been the actual vacancy rate?
- Crime grade is F in this area — have there been break-ins, vandalism, or insurance claims at this property in the last 3 years? What carrier currently insures it and at what premium?
- The area grade is low — what's the realistic commute time and amenity access for the typical tenant pool here? Any planned neighborhood developments (good or bad) we should know about?
- What's the average days-on-market for RENTAL listings here right now (not sales)? A rising rental-DOM trend means longer vacancies and softer asking-rent achievability than the comps imply.
- What's the recent tenant-quality profile in this submarket — average credit score on applications, eviction rate, late-payment / NSF rate, and stable-employment percentage? A property-management company in the area should have these aggregated.
- How much new for-sale + rental construction is in the pipeline within 1–3 miles? Heavy new supply typically softens prices + rents 12–24 months out; constrained supply supports both.
Investment metrics
- 1% rule
- 0.82% ✗
- Cap rate
- 5.74%
- Cash-on-cash
- -1.99%
- DSCR
- 0.91
- GRM
- 10.2
CMA / ARV
- ARV (median comp)
- $218,263
- List price
- $249,999
- Delta
- 14.54%
- Verdict
- OVERPRICED
- Comps
- 20 within 1.0 mi
Show comp detail 12 sales within ~0.75 mi
| Address | Dist | Beds/Ba | Sqft | Sold | Price | $/sf | Match |
|---|---|---|---|---|---|---|---|
| 8722 Clarington St | 0.46mi | 3/2.0 | 1,600 (+1%) | 7mo | $289,000 | $181 | 70 |
| 4819 Keeland St | 0.34mi | 3/2.5 | 1,627 (+3%) | 8mo | $252,000 | $155 | 70 |
| 7609 Shotwell St | 0.31mi | 3/2.0 | 1,660 (+5%) | 8mo | $180,000 | $108 | 70 |
| 4813 Keeland St | 0.35mi | 3/2.5 | 1,627 (+3%) | 9mo | $252,000 | $155 | 69 |
| 4815 Keeland St | 0.35mi | 3/2.5 | 1,627 (+3%) | 10mo | $252,000 | $155 | 68 |
| 4817 Keeland St | 0.35mi | 3/2.5 | 1,627 (+3%) | 10mo | $252,000 | $155 | 68 |
| 7406 Hoffman St | 0.54mi | 3/2.0 | 1,600 (+1%) | 7mo | $295,000 | $184 | 67 |
| 7831 Wileyvale Rd | 0.14mi | 4/2.0 (+1) | 1,781 (+13%) | 10mo | $275,000 | $154 | 59 |
| 7302 Sandra St | 0.55mi | 3/1.0 | 1,460 (-8%) | 1mo | $239,900 | $164 | 57 |
| 6845 Larkstone St | 0.65mi | 4/2.0 (+1) | 1,567 (-1%) | 10mo | $167,000 | $107 | 55 |
| 8203 Westcott St | 0.71mi | 3/2.5 | 1,380 (-13%) | 8mo | $204,999 | $149 | 37 |
| 9002 Allwood St | 0.71mi | 3/1.5 | 1,373 (-13%) | 10mo | $194,900 | $142 | 35 |
Match score weights: distance 35% · size 25% · config 20% · recency 20%. Top-matched comps best support the ARV.
Projected returns pro-forma
8.65% appreciation · 0.44% rent growth · sell at horizon
- IRR
- 19.1%
- Equity multiple
- 2.44×
- Total profit
- $100,978
- Equity at exit
- $201,068
- IRR
- 17.2%
- Equity multiple
- 5.14×
- Total profit
- $289,805
- Equity at exit
- $410,235
Cash invested: $70,000 (down + closing). Projections, not guarantees.
Landlord ↔ Tenant lean methodology
- Overall (STATE)
- 87 Strongly Landlord-Friendly
- State Texas
- 87 Strongly Landlord-Friendly · R+5
- County
- — inherits STATE
- City
- — inherits STATE
ZIP-level market 77016
- Home prices YoY
- 2.8%
- Rents YoY
- 0.4%
- Active inventory
- 372
- Price-to-rent
- 10.2×
Monthly cashflow live
- Estimated rent
- $2,040 high interval (Pro) →
- Mortgage (P&I)
- −$1,311
- Tax est. 1.5%
- −$312 /mo · $3,750/yr
- Insurance
- −$104
- HOA
- −$0
- Vacancy / Maint / Mgmt
- −$428
- Net cashflow
- $-116
Break-even live
UW: 25.0% down · 7.5% · 30yr · 1.5% tax · 5.0% vac · 8.0% maint · 8.0% mgmt
Financing live
Cash to close
- Down payment
- $62,500
- Closing costs
- $7,500
- Reserves months
- —
- Total cash needed
- —
Loan-product check · same deal, 3 products live
Conventional
25% down · 7.5% · 30yr
- Down + closing
- —
- Monthly P&I
- —
- Monthly cashflow
- —
- DSCR
- —
- Eligible?
- —
Personal DTI + credit; lowest rate.
DSCR
20% down · 8.5% · 30yr
- Down + closing
- —
- Monthly P&I
- —
- Monthly cashflow
- —
- DSCR
- —
- Eligible?
- —
No personal income docs; deal must DSCR.
Hard money
10% down · 12.0% · 12mo
- Down + closing
- —
- Monthly P&I
- —
- Monthly cashflow
- —
- DSCR
- —
- Eligible?
- —
Short-term bridge; refi at stabilization.
Rent comps 25 comps
| Address | Beds | Baths | Sqft | Rent | $/sqft | DOM | Units | Dist |
|---|---|---|---|---|---|---|---|---|
| 7740 Wileyvale Rd Unit B Houston, TX | 3.0 | 2.0 | 1500 | $3,000 | $2.00 | 43d | 1 | 0.24mi |
| 8508 Wileyvale Rd Houston, TX | 2.0 | 2.0 | 1504 | $1,650 | $1.10 | 43d | 1 | 0.27mi |
| 8639 Peachtree St Unit A Houston, TX | 3.0 | 2.5 | 1150 | $1,750 | $1.52 | 43d | 1 | 0.37mi |
| 5609 Denmark St Unit A Houston, TX | 3.0 | 2.0 | 1410 | $1,595 | $1.13 | 43d | 1 | 0.51mi |
| 4326 Plaag St Unit B Houston, TX | 3.0 | 2.5 | 1150 | $1,595 | $1.39 | 43d | 1 | 0.70mi |
| 7119 Bywood St Unit A Houston, TX | 3.0 | 2.5 | 1150 | $1,795 | $1.56 | 43d | 1 | 0.85mi |
| 9422 Sandra St Unit B Houston, TX | 3.0 | 2.5 | 1461 | $1,875 | $1.28 | 43d | 1 | 0.95mi |
| 4626 Shreveport Blvd Unit B Houston, TX | 3.0 | 2.0 | 1150 | $1,490 | $1.30 | 13d | 1 | 1.06mi |
| 6315 Sandra St Unit A Houston, TX | 3.0 | 2.0 | 1150 | $1,399 | $1.22 | 43d | 1 | 1.12mi |
| 7418 Bywood St Houston, TX | 3.0 | 2.0 | 1300 | $1,800 | $1.38 | 24d | 1 | 1.19mi |
| 9314 Sundown Dr Unit A Houston, TX | 3.0 | 2.5 | 1608 | $1,695 | $1.05 | 14d | 1 | 1.27mi |
| 3208 Bostic St Unit 1254540P Houston, TX | 3.0 | 2.0 | 1603 | $3,691 | $2.30 | 1d | 1 | 1.35mi |
| 8318 Curry Rd Houston, TX | 3.0 | 2.0 | 1558 | $2,299 | $1.48 | 43d | 1 | 1.36mi |
| 8322 Curry Rd Houston, TX | 3.0 | 2.5 | 1599 | $2,500 | $1.56 | 43d | 1 | 1.36mi |
| 8326 Curry Rd Unit 1228882P Houston, TX | 3.0 | 2.0 | 1614 | $2,878 | $1.78 | 7d | 1 | 1.36mi |
| 8320 Curry Rd Unit 1391267P Houston, TX | 3.0 | 2.5 | 1550 | $5,134 | $3.31 | 1d | 1 | 1.36mi |
| 8320 Curry Rd Houston, TX | 3.0 | 2.5 | 1558 | $8,950 | $5.74 | 21d | 1 | 1.36mi |
| 9320 Firnat St Unit A Houston, TX | 3.0 | 2.5 | 1900 | $1,850 | $0.97 | 7d | 1 | 1.38mi |
| 9324 Firnat St Unit B Houston, TX | 3.0 | 2.5 | 1600 | $1,900 | $1.19 | 21d | 1 | 1.38mi |
| 9328 Firnat St Unit B Houston, TX | 3.0 | 2.5 | 1902 | $1,900 | $1.00 | 43d | 1 | 1.38mi |
| 9326 Firnat St Unit B Houston, TX | 3.0 | 2.5 | 1902 | $1,900 | $1.00 | 43d | 1 | 1.38mi |
| 9410 Firnat St Unit B Houston, TX | 3.0 | 2.5 | 1500 | $1,900 | $1.27 | 43d | 1 | 1.42mi |
| 3812 Lynnfield St Houston, TX | 3.0 | 2.0 | 1298 | $1,545 | $1.19 | 5d | 1 | 1.44mi |
| 3810 Lynnfield St Houston, TX | 3.0 | 2.0 | 1298 | $1,599 | $1.23 | 14d | 1 | 1.45mi |
| 7601 Springdale St Houston, TX | 3.0 | 2.0 | 1224 | $1,200 | $0.98 | 15d | 1 | 1.48mi |
Listing history 16 events
-
2026-06-18days on market $249,999 Active 132 DOM
-
2026-06-17days on market $249,999 Active 131 DOM
-
2026-06-16days on market $249,999 Active 130 DOM
-
2026-06-15days on market $249,999 Active 129 DOM
-
2026-06-13days on market $249,999 Active 127 DOM
-
2026-06-10days on market $249,999 Active 123 DOM
-
2026-06-08days on market $249,999 Active 122 DOM
-
2026-06-07days on market $249,999 Active 121 DOM
-
2026-06-04days on market $249,999 Active 118 DOM
-
2026-06-01days on market $249,999 Active 115 DOM
-
2026-05-31days on market $249,999 Active 114 DOM
-
2026-05-07historical $2,100
-
2026-04-25$2,100
-
2026-02-06historical
Show marketing remark (667 chars)
Freshly completed in Trinity/Houston Gardens, this brand-new 3-bedroom, 2-bath home brings a sharp, modern presence to one of Houston’s most storied neighborhoods. The main level centers around an open kitchen–living layout with clear sightlines, balanced light, and a pantry that keeps the space organized. All bedrooms are upstairs, each with a full-entry closet and straightforward functionality. An attached 2-car garage adds everyday convenience, and the location places you close to Downtown, the emerging East River district, UHD, and quick routes along I-610 and I-69—offering a direct link to some of the city’s most active corridors.
-
2026-02-06$249,999 Active 667-char remark
Show marketing remark (667 chars)
Freshly completed in Trinity/Houston Gardens, this brand-new 3-bedroom, 2-bath home brings a sharp, modern presence to one of Houston’s most storied neighborhoods. The main level centers around an open kitchen–living layout with clear sightlines, balanced light, and a pantry that keeps the space organized. All bedrooms are upstairs, each with a full-entry closet and straightforward functionality. An attached 2-car garage adds everyday convenience, and the location places you close to Downtown, the emerging East River district, UHD, and quick routes along I-610 and I-69—offering a direct link to some of the city’s most active corridors.
-
2026-02-05$245,000 Active
ⓘ Source: listings_history table (triggers on properties + properties_extension) + one-shot
backfill from property_details.listing_events for pre-trigger history.
Nearby sold comps map
Loading sold comps map…
Walkable amenities ~0.75 mi
Loading nearby amenities…
Taxation est. · year 1
- Rental income
- $24,483
- − Mortgage interest
- −$14,004
- − Property taxes
- −$3,750
- − Insurance
- −$1,250
- − Repairs & maintenance
- −$1,959
- − Management
- −$1,959
- − Depreciation
- −$7,273
- Taxable loss
- −$5,711
- Est. tax savings @ 24.0%
- +$1,371
- After-tax cash flow
- $-20/yr
For passive investors: Depreciation is non-cash, so a rental often shows a tax loss while cash-flowing — sheltering income. Rental losses are passive: they offset passive income freely, and up to $25,000/yr can offset ordinary (W-2) income if you actively participate and your MAGI is under $100k (phasing out to $0 by $150k); unused losses carry forward. On sale, claimed depreciation is recaptured at up to 25%, and gains may owe capital-gains tax (a 1031 exchange can defer both). Figures are a year-1 estimate at your 24.0% rate — not tax advice; consult a CPA.
Condition & rehab AI · 12 photos
This freshly completed home in Trinity/Houston Gardens is in excellent condition with modern finishes and a prime location. It is move-in ready and would benefit from minor exterior updates to maximize its value.
Value-add opportunities
- Both Painting the exterior siding — Enhances curb appeal and can increase property value
- Both Landscaping improvements — Enhances curb appeal and can increase property value
- Both Add a smart home system — Improves convenience and can increase property value
Renovation cost estimate screening
Value-add ROI direction
- Both Painting the exterior siding — Enhances curb appeal and can increase property value ↑
- Both Landscaping improvements — Enhances curb appeal and can increase property value ↑
- Both Add a smart home system — Improves convenience and can increase property value ↑
ⓘ Cost ranges are severity-bucket heuristics (US national rule-of-thumb). Get contractor quotes + a written scope before underwriting a rehab budget.
Schools (NCES district)
- District
- Houston ISD
- NCES district ID
- 4823640
- Math proficiency
- 27% ▼ -18.00%
- Reading proficiency
- 35% ▼ -6.00%
- Median HH income
- $46,054
- Composite
- 26.63/100
- National rank
- #7173
- State rank
- #593 of 826 in TX
Livability — Houston
- Score
- 74/100
- State rank
- #184
- US rank
- #4771
Category grades
Schools grade is shown separately in the Schools card above.
Census & demographics
- Census place
- Houston, TX
- County
- Harris County · 4,702,590 people
- City population
- 3,226,434
- Metro
- Houston-The Woodlands-Sugar Land, TX
- Population (ZIP)
- 29,841
- Household income
- $47,677
- Rent vs Own
- Severe rent burden
- 1297.0
Population outlook (Harris County) Hauer SSP2
- Today (2025)
- 5,571,493 people
- By 2030
- 6,089,821 · +9.3%
- By 2040
- 7,142,806 · +28.2%
- By 2050
- 8,185,864 · +46.9%
- By 2075
- 10,574,329 · +89.8%
- By 2100
- 12,109,958 · +117.4%
Race, ethnicity, and origin ACS 2023
- Neighborhood character
- Majority Black (56%)
- Race & ethnicity
- Black 56% Hispanic / Latino 42% Two or more races 28%
- Hispanic origin (detail)
- Mexican 34%
- Foreign-born
- 18% · Canada
- Languages at home
- 61% English-only · Spanish 37%
Political lean MEDSL · Harris
- 2024 margin
- Lean D (+5.5) · D 52.0% · R 46.4% · Other 1.6%
- 2008→2024 swing
- +3.9pp toward D · 2008: 1.6pp · 2024: 5.5pp
- All cycles
- 2024: D+5.5 2020: D+13.3 2016: D+12.4 2012: D+0.1 2008: D+1.6
Not yet ingested
- Civics
- —
Market trends
- HPI YoY
- ▲ 8.65%
- Current HPI
- 315.6765
- Rent YoY
- ▲ 0.44%
- Metro
- Houston-The Woodlands-Sugar Land, TX
- State GDP YoY
- ▲ 3.95%
- F500 in state
- 110
Industry mix (Fortune 500 HQ in TX)
| Industry | F500 HQs | Revenue |
|---|---|---|
| Energy | 16 | $1,198B |
|
||
| Technology | 5 | $198B |
|
||
| Engineering / Construction | 4 | $72B |
|
||
| Energy Services | 3 | $60B |
|
||
| Utilities | 3 | $41B |
|
||
| Healthcare | 2 | $330B |
|
||
Price history
-99.1% since first listed5 events — show timeline
- 2026-05-07 Rental Removed $2,100 HARMLS
- 2026-04-25 Listed for Rent $2,100 HARMLS
- 2026-02-06 Listed $249,999 HARMLS
- 2026-02-06 Listing Removed — HARMLS
- 2026-02-05 Listed $245,000 HARMLS
Cash-flow waterfall
monthlySold comps — $/sqft
last 12 mo · ≤1 miLoading sold comps…