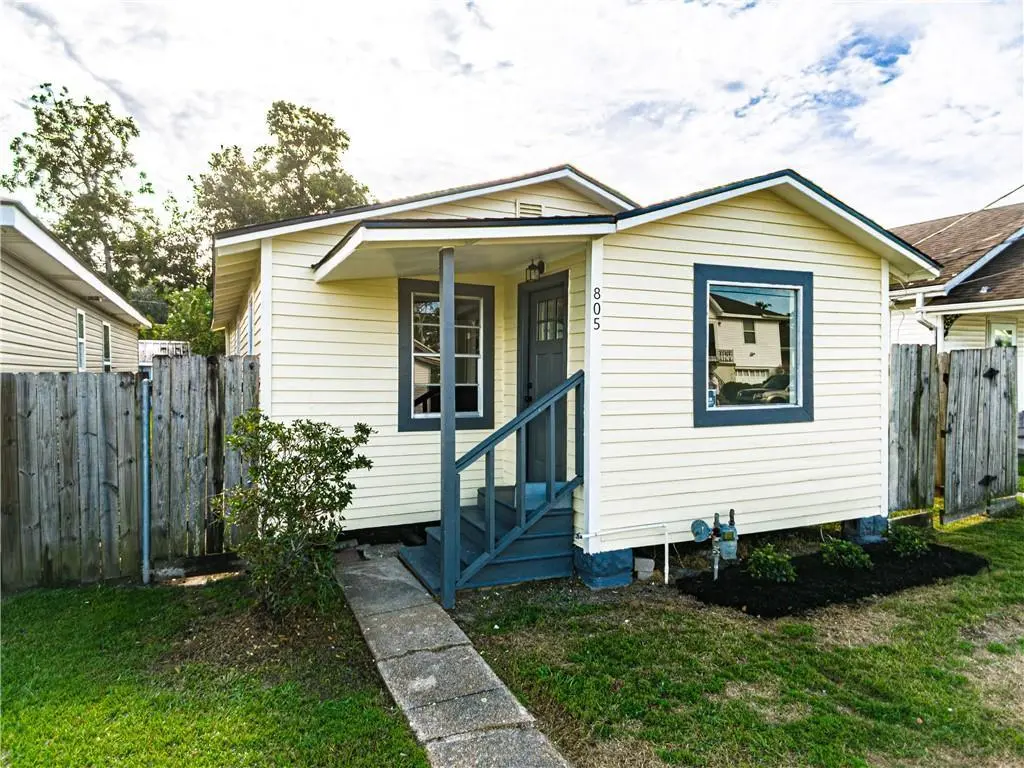
805 Avenue A Ave · Westwego, LA
Flood risk No data
- FEMA flood zone
- —
- Chance of flooding over 30 yrs
- —
- Est. flood insurance / yr
- —
Fire risk No data
- Est. fire insurance / yr
- —
Heat risk No data
- Hot days now (above threshold)
- —
- Hot days in 30 yrs
- —
Wind risk No data
- Chance of severe wind over 30 yrs
- —
Air-quality risk No data
- Unhealthy air days now
- —
- Unhealthy air days in 30 yrs
- —
Risk factors via First Street. Map © Google.
Why this score? — see what drove the C+ grade
The composite is a weighted blend of 9 inputs, each scored 0–100. Each bar is that input's sub-score; the figure is the points it added to the 100-point composite (weight × sub-score).
- Cash flow +25.2/30.0
- ARV discount +14.2/15.0
- DSCR +8.3/10.0
- 1% rule +5.6/10.0
- Livability +3.4/5.0
- Schools +2.5/10.0
- Condition / age +2.5/5.0
- Rent growth +2.3/5.0
- Appreciation +0.0/10.0
$125,000
🖨 Deal sheet 📄 Offer letter ✓ Due diligence
Listing remarks MLS
Welcome to this beautifully renovated raised home located in a well-established neighborhood! This turnkey property has been thoughtfully updated from top to bottom and is ready for new owners to move in and enjoy. Entire foundation rebuilt and reinforced, brand-new HVAC mini-split system for efficient cooling & heating, All new roof, flooring, appliances, and plumbing, underground PVC plumbing from home to city connection, gorgeous Brazilian granite countertops and new kitchen cabinets and kitchen island. Covered patio and whole yard installed fencing. Oversized shed with electric and plumbing connections, great for a workshop or studio. This is not just a renovation, it’s a transformation. With all major systems updated and beautiful design finishes throughout. Flood X Zone.
Key facts
- Built 1951
- Listed 78 days
Neighborhood map
What this means for you Summary
Snapshot
- This is a 2-bed/1.0-bath single-family listed at $125k.
Deal economics
- At list price, monthly cash flow is $279 ($3k/yr) — positive.
- The deal already cash-flows at list — no discount required.
- Meets the 1% rule at list price ($1k rent vs $125k).
- Recommended offer: $118k (6.0% below list) — sets the bar for market timing.
- Cap rate 9.0% vs local median 6.5% in Westwego — top-decile yield for the area; either an underpriced asset or a hidden risk that comps aren't pricing in. Stress-test before assuming the spread holds.
Location & tenants
- Location reads 68/100 on livability (#97 in LA) — a middle-class / working-renter tenant base. Strengths: cost of living A+, health & safety A+; Watch: schools C-, crime D, amenities D-.
- Jefferson Parish (suburban): math 24% / reading 34% proficiency, ranked #44 of 98 in LA (top 45%) — low school quality limits family demand, transient renter base, plan for 1-2y turnover; 70% free/reduced lunch — lower-income household profile, screen leases tightly.
- Market conditions: Rents soft (-0.8%/yr); 186 active listings in the ZIP; 17 comparable units currently listed for rent nearby; rentals at typical pace (median 24d on market — plan ~3-4 weeks tenant-placement turnaround); 518 units permitted in Jefferson Parish in 2024 (43 in 5+ unit buildings).
Forward outlook
- Local home prices are declining (-3.0%/yr); year-one equity from $864 of loan paydown is wiped out by about $4k of value loss. Plan a longer hold.
Negotiation context
- It's been on market 78 days — a 6% lower offer ($118k) is reasonable based on typical stale-listing flexibility.
- 7 sale attempts since 30y ago; this cycle's ask is 9159% above the opening price — seller raised mid-cycle; expect resistance to lowballs.
- Current owner paid $50k; list at $125k implies a 150% gain — meaningful room to come down on a strong offer.
Risks & watch-outs
- Watch-outs: built in 1951 — expect roof / HVAC / electrical / plumbing capex.
Questions for the listing agent
- It's been on market 78 days. Have you received any prior offers? Is the seller open to a 6% concession, seller financing, or rate buy-down credit?
- Built in 1951 — when were the roof, HVAC, electrical panel, plumbing, and water heater last replaced?
- Why hasn't it sold? Are there any deal-killer items the seller is aware of (foundation, flood, title, zoning, code violations)?
- Is there a deadline driving the sale (1031 exchange, divorce, estate, relocation)? That informs how much negotiation room exists.
- Crime grade is D in this area — have there been break-ins, vandalism, or insurance claims at this property in the last 3 years? What carrier currently insures it and at what premium?
- What's the average days-on-market for RENTAL listings here right now (not sales)? A rising rental-DOM trend means longer vacancies and softer asking-rent achievability than the comps imply.
- What's the recent tenant-quality profile in this submarket — average credit score on applications, eviction rate, late-payment / NSF rate, and stable-employment percentage? A property-management company in the area should have these aggregated.
- How much new for-sale + rental construction is in the pipeline within 1–3 miles? Heavy new supply typically softens prices + rents 12–24 months out; constrained supply supports both.
Investment metrics
- 1% rule
- 1.06% ✓
- Cap rate
- 8.97%
- Cash-on-cash
- 9.57%
- DSCR
- 1.43
- GRM
- 7.9
CMA / ARV
- ARV (median comp)
- $146,755
- List price
- $125,000
- Delta
- -14.82%
- Verdict
- UNDERPRICED
- Comps
- 20 within 1.0 mi
Show comp detail 12 sales within ~0.75 mi
| Address | Dist | Beds/Ba | Sqft | Sold | Price | $/sf | Match |
|---|---|---|---|---|---|---|---|
| 653 Avenue Ave E | 0.16mi | 2/1.0 | 875 (-3%) | 5mo | $114,000 | $130 | 84 |
| 945 Avenue B | 0.24mi | 3/1.0 (+1) | 900 (0%) | 3mo | $122,500 | $136 | 81 |
| 836 Avenue E | 0.05mi | 2/1.0 | 855 (-5%) | 12mo | $153,000 | $179 | 79 |
| 651 Avenue E | 0.17mi | 2/1.0 | 829 (-8%) | 10mo | $80,000 | $97 | 70 |
| 820 Avenue B Ave | 0.19mi | 3/2.0 (+1) | 930 (+3%) | 7mo | $215,300 | $232 | 70 |
| 815 West Dr | 0.39mi | 2/1.0 | 840 (-7%) | 4mo | $145,900 | $174 | 67 |
| 774 Avenue B Ave | 0.20mi | 2/2.5 | 971 (+8%) | 10mo | $123,500 | $127 | 63 |
| 631 Eighth St | 0.11mi | 3/2.0 (+1) | 1,022 (+14%) | 5mo | $190,000 | $186 | 59 |
| 319 5th St | 0.31mi | 3/2.0 (+1) | 850 (-6%) | 12mo | $60,000 | $71 | 57 |
| 607 Central Ave | 0.50mi | 2/1.0 | 970 (+8%) | 10mo | $109,900 | $113 | 55 |
| 1206 Avenue A Ave | 0.54mi | 3/2.0 (+1) | 991 (+10%) | 5mo | $170,000 | $172 | 44 |
| 713 Chipley St | 0.59mi | 2/1.0 | 1,000 (+11%) | 12mo | $172,000 | $172 | 44 |
Match score weights: distance 35% · size 25% · config 20% · recency 20%. Top-matched comps best support the ARV.
Projected returns pro-forma
-3.0% appreciation · 0.0% rent growth · sell at horizon
- IRR
- -5.0%
- Equity multiple
- 0.82×
- Total profit
- $-6,392
- Equity at exit
- $18,638
- IRR
- 1.0%
- Equity multiple
- 1.06×
- Total profit
- $2,199
- Equity at exit
- $10,808
Cash invested: $35,000 (down + closing). Projections, not guarantees.
Landlord ↔ Tenant lean methodology
- Overall (STATE)
- 90 Strongly Landlord-Friendly
- State Louisiana
- 90 Strongly Landlord-Friendly · R+12
- County
- — inherits STATE
- City
- — inherits STATE
ZIP-level market 70094
- Rents YoY
- -0.8%
- Active inventory
- 186
- Price-to-rent
- 7.9×
Monthly cashflow live
- Estimated rent
- $1,320 high interval (Pro) →
- Mortgage (P&I)
- −$656
- Tax from tax record
- −$56 /mo · $675/yr
- Insurance
- −$52
- HOA
- −$0
- Vacancy / Maint / Mgmt
- −$277
- Net cashflow
- $279
Break-even live
UW: 25.0% down · 7.5% · 30yr · 1.5% tax · 5.0% vac · 8.0% maint · 8.0% mgmt
Financing live
Cash to close
- Down payment
- $31,250
- Closing costs
- $3,750
- Reserves months
- —
- Total cash needed
- —
Loan-product check · same deal, 3 products live
Conventional
25% down · 7.5% · 30yr
- Down + closing
- —
- Monthly P&I
- —
- Monthly cashflow
- —
- DSCR
- —
- Eligible?
- —
Personal DTI + credit; lowest rate.
DSCR
20% down · 8.5% · 30yr
- Down + closing
- —
- Monthly P&I
- —
- Monthly cashflow
- —
- DSCR
- —
- Eligible?
- —
No personal income docs; deal must DSCR.
Hard money
10% down · 12.0% · 12mo
- Down + closing
- —
- Monthly P&I
- —
- Monthly cashflow
- —
- DSCR
- —
- Eligible?
- —
Short-term bridge; refi at stabilization.
Rent comps 17 comps
| Address | Beds | Baths | Sqft | Rent | $/sqft | DOM | Units | Dist |
|---|---|---|---|---|---|---|---|---|
| 900 Avenue H Unit D Westwego, LA | 2.0 | 1.5 | 992 | $1,300 | $1.31 | 20d | 1 | 0.12mi |
| 958 Avenue B Westwego, LA | 2.0 | 1.0 | 1018 | $1,500 | $1.47 | 43d | 1 | 0.18mi |
| 710 West Dr Westwego, LA | 2.0 | 1.0 | 941 | $1,500 | $1.59 | 4d | 1 | 0.36mi |
| 1060 Avenue B Unit A Westwego, LA | 3.0 | 2.0 | 1124 | $1,550 | $1.38 | 23d | 1 | 0.39mi |
| 1015 West Dr Westwego, LA | 2.0 | 1.0 | 750 | $1,200 | $1.60 | 43d | 1 | 0.43mi |
| 196 Louisiana St Westwego, LA | 1.0 | 1.0 | 600 | $850 | $1.42 | 21d | 1 | 0.46mi |
| 196 Louisiana St Unit A Westwego, LA | 1.0 | 1.0 | 1000 | $850 | $0.85 | 23d | 1 | 0.46mi |
| 1300 Tanglewood Dr Westwego, LA | 1.0–3.0 | 1.0–1.5 | 781 | $1,180 | $1.51 | 2d | 14 | 0.49mi |
| 1105 Magnolia Dr Unit H Westwego, LA | 1.0 | 1.0 | 750 | $950 | $1.27 | 3d | 1 | 0.59mi |
| 1105 Magnolia Dr Apt E Westwego, LA | 1.0 | 1.0 | 750 | $950 | $1.27 | 21d | 1 | 0.59mi |
| 1234 Central Ave Westwego, LA | 3.0 | 1.5 | 800 | $1,200 | $1.50 | 23d | 1 | 0.64mi |
| 412 Avenue A Westwego, LA | 2.0 | 1.0 | 1103 | $1,500 | $1.36 | 43d | 1 | 0.68mi |
| 1413 Central Ave Unit C Westwego, LA | 2.0 | 1.5 | 1000 | $1,200 | $1.20 | 43d | 1 | 0.83mi |
| 7429 Pritchard St Marrero, LA | 2.0 | 1.0 | 925 | $1,150 | $1.24 | 14d | 1 | 0.95mi |
| 7409 4th St Unit B Marrero, LA | 1.0 | 1.0 | 665 | $900 | $1.35 | 23d | 1 | 1.02mi |
| 524 Bertucci St Marrero, LA | 2.0 | 1.0 | 960 | $1,300 | $1.35 | 14d | 1 | 1.31mi |
| 942 Francis St Marrero, LA | 1.0 | 1.0 | 625 | $1,125 | $1.80 | 23d | 1 | 1.50mi |
Listing history 30 events
-
2026-06-18days on market $125,000 Active 78 DOM
-
2026-06-17days on market $125,000 Active 77 DOM
-
2026-06-16days on market $125,000 Active 76 DOM
-
2026-06-15days on market $125,000 Active 75 DOM
-
2026-06-13days on market $125,000 Active 73 DOM
-
2026-06-10days on market $125,000 Active 70 DOM
-
2026-06-09days on market $125,000 Active 69 DOM
-
2026-06-08days on market $125,000 Active 68 DOM
-
2026-06-07days on market $125,000 Active 67 DOM
-
2026-06-03days on market $125,000 Active 63 DOM
-
2026-06-02days on market $125,000 Active 62 DOM
-
2026-06-01days on market $125,000 Active 61 DOM
-
2026-05-31days on market $125,000 Active 60 DOM
-
2026-04-17$1,350
-
2026-04-17historical $1,350
-
2026-04-16$1,350
-
2026-04-01$125,000 Active 799-char remark
Show marketing remark (791 chars)
Welcome to this beautifully renovated raised home located in a well-established neighborhood! This turnkey property has been thoughtfully updated from top to bottom and is ready for new owners to move in and enjoy. Entire foundation rebuilt and reinforced, brand-new HVAC mini-split system for efficient cooling & heating, All new roof, flooring, appliances, and plumbing, underground PVC plumbing from home to city connection, gorgeous Brazilian granite countertops and new kitchen cabinets and kitchen island. Covered patio and whole yard installed fencing. Oversized shed with electric and plumbing connections, great for a workshop or studio. This is not just a renovation, it's a transformation. With all major systems updated and beautiful design finishes throughout. Flood X Zone.
-
2026-04-01$125,000 Active 791-char remark
Show marketing remark (791 chars)
Welcome to this beautifully renovated raised home located in a well-established neighborhood! This turnkey property has been thoughtfully updated from top to bottom and is ready for new owners to move in and enjoy. Entire foundation rebuilt and reinforced, brand-new HVAC mini-split system for efficient cooling & heating, All new roof, flooring, appliances, and plumbing, underground PVC plumbing from home to city connection, gorgeous Brazilian granite countertops and new kitchen cabinets and kitchen island. Covered patio and whole yard installed fencing. Oversized shed with electric and plumbing connections, great for a workshop or studio. This is not just a renovation, it's a transformation. With all major systems updated and beautiful design finishes throughout. Flood X Zone.
-
2026-02-11price $125,000
-
2026-02-11price $125,000
-
2025-12-08price $140,000
-
2025-12-08price $140,000
-
2025-11-29price $150,000
-
2025-11-05price $150,000
-
2025-10-04$169,000 Active
-
2025-07-28soldstatus $50,000
-
1996-08-13soldstatus $39,000
-
1996-08-01soldstatus $39,000
-
1996-04-19$42,000
-
1996-04-19$42,000
ⓘ Source: listings_history table (triggers on properties + properties_extension) + one-shot
backfill from property_details.listing_events for pre-trigger history.
Tax reassessment forecast LA · Resets to sale price
- Current annual tax
- $675 · $56/mo
- Projected year-2 tax
- $688 · $57/mo
- Expected delta
- +$12/yr (+$1/mo · 1.8%)
ⓘ Screening estimate from a state-policy table — verify with the county assessor before closing.
Nearby sold comps map
Loading sold comps map…
Walkable amenities ~0.75 mi
Loading nearby amenities…
Taxation est. · year 1
- Rental income
- $15,842
- − Mortgage interest
- −$7,002
- − Property taxes
- −$675
- − Insurance
- −$625
- − Repairs & maintenance
- −$1,267
- − Management
- −$1,267
- − Depreciation
- −$3,636
- Taxable income
- $1,369
- Est. tax owed @ 24.0%
- −$328
- After-tax cash flow
- $3,020/yr
For passive investors: Depreciation is non-cash, so a rental often shows a tax loss while cash-flowing — sheltering income. Rental losses are passive: they offset passive income freely, and up to $25,000/yr can offset ordinary (W-2) income if you actively participate and your MAGI is under $100k (phasing out to $0 by $150k); unused losses carry forward. On sale, claimed depreciation is recaptured at up to 25%, and gains may owe capital-gains tax (a 1031 exchange can defer both). Figures are a year-1 estimate at your 24.0% rate — not tax advice; consult a CPA.
Schools (NCES district)
- District
- Jefferson Parish
- NCES district ID
- 2200840
- Math proficiency
- 24% ▼ -36.00%
- Reading proficiency
- 34% ▼ -30.00%
- Median HH income
- $48,421
- Composite
- 25.19/100
- National rank
- #7511
- State rank
- #44 of 98 in LA
Livability — Westwego
- Score
- 68/100
- State rank
- #97
- US rank
- #9851
Category grades
Schools grade is shown separately in the Schools card above.
Census & demographics
- Census place
- Westwego, LA
- County
- Jefferson Parish · 426,999 people
- Metro
- New Orleans-Metairie, LA
- Population (ZIP)
- 32,130
- Household income
- $53,597
- Rent vs Own
- Severe rent burden
- 1457.0
Population outlook (Jefferson County) Hauer SSP2
- Today (2025)
- 451,696 people
- By 2030
- 455,451 · +0.8%
- By 2040
- 458,308 · +1.5%
- By 2050
- 461,031 · +2.1%
- By 2075
- 476,351 · +5.5%
- By 2100
- 499,377 · +10.6%
Race, ethnicity, and origin ACS 2023
- Neighborhood character
- Diverse neighborhood (Simpson 0.65)
- Race & ethnicity
- Black 46% White 36% Hispanic / Latino 13% Two or more races 6% Asian 2%
- Hispanic origin (detail)
- Mexican 2% Dominican 2%
- Common ancestry
- Lithuanian 9% Scottish 1%
- Foreign-born
- 8% · Canada, Vietnam
- Languages at home
- 86% English-only · Spanish 11% Vietnamese 2% French/Haitian/Cajun 1%
Political lean MEDSL · Jefferson
- 2024 margin
- R (+12.9) · D 42.5% · R 55.5% · Other 2.1%
- 2008→2024 swing
- +13.6pp toward D · 2008: -26.6pp · 2024: -12.9pp
- All cycles
- 2024: R+12.9 2020: R+11.1 2016: R+14.8 2012: R+18.4 2008: R+26.6
Not yet ingested
- Civics
- —
Market trends
- HPI YoY
- ▼ -111.56%
- Current HPI
- 102.9992
- Rent YoY
- ▼ -0.80%
- Metro
- New Orleans-Metairie, LA
- State GDP YoY
- ▲ 3.29%
- F500 in state
- 10
Industry mix (Fortune 500 HQ in LA)
| Industry | F500 HQs | Revenue |
|---|---|---|
| Telecommunications | 2 | $23B |
|
||
| Utilities | 1 | $12B |
|
||
| Wholesale / Distribution | 1 | $5B |
|
||
| Advertising | 1 | $2B |
|
||
Price history
-96.8% since first listed17 events — show timeline
- 2026-04-17 Listed for Rent $1,350 GSREIN
- 2026-04-17 Rental Removed $1,350 RAAMLS
- 2026-04-16 Listed for Rent $1,350 RAAMLS
- 2026-04-01 Listed $125,000 AcadianaMLS
- 2026-04-01 Listed $125,000 GSREIN
- 2026-02-11 Price Changed $125,000 AcadianaMLS
- 2026-02-11 Price Changed $125,000 GSREIN
- 2025-12-08 Price Changed $140,000 AcadianaMLS
- 2025-12-08 Price Changed $140,000 GSREIN
- 2025-11-29 Price Changed $150,000 AcadianaMLS
- 2025-11-05 Price Changed $150,000 GSREIN
- 2025-10-04 Listed $169,000 AcadianaMLS
- 2025-07-28 Sold (Public Records) $50,000 Public Records
- 1996-08-13 Sold (MLS) $39,000 GSREIN
- 1996-08-01 Sold (Public Records) $39,000 Public Records
- 1996-04-19 Listed $42,000 AcadianaMLS
- 1996-04-19 Listed $42,000 GSREIN
Property tax history
+2.3%/yrLatest (2025): $675 · -0.2% YoY. Source: county tax records.
Cash-flow waterfall
monthlySold comps — $/sqft
last 12 mo · ≤1 miLoading sold comps…