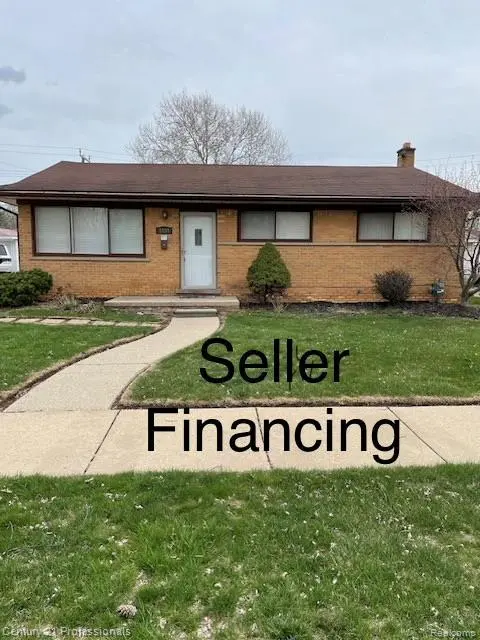
8834 Winston · Dearborn Heights, MI
Flood risk 3/10 · Minor
- FEMA flood zone
- X (unshaded)
- Chance of flooding over 30 yrs
- 0.2%
- Est. flood insurance / yr
- $473 – $860
Fire risk 1/10 · Minimal
- Est. fire insurance / yr
- $784 – $1,456
Heat risk 3/10 · Minor
- Hot days now (above 98°F)
- 7 days/yr
- Hot days in 30 yrs
- 15 days/yr
Wind risk 2/10 · Minimal
- Chance of severe wind over 30 yrs
- —
Air-quality risk 3/10 · Minor
- Unhealthy air days now
- 2 days/yr
- Unhealthy air days in 30 yrs
- 3 days/yr
Risk factors via First Street. Map © Google.
Why this score? — see what drove the D- grade
The composite is a weighted blend of 9 inputs, each scored 0–100. Each bar is that input's sub-score; the figure is the points it added to the 100-point composite (weight × sub-score).
- Cash flow +11.2/30.0
- ARV discount +7.9/15.0
- Livability +4.0/5.0
- DSCR +3.3/10.0
- Rent growth +3.3/5.0
- 1% rule +2.8/10.0
- Condition / age +2.5/5.0
- Schools +1.8/10.0
- Appreciation +0.0/10.0
$224,900
🖨 Deal sheet (PDF) 📄 Offer letter ✓ Due diligence
Listing remarks MLS
SUPER LAND CONTRACT TERMS, SELLER FINACING, 15K DOWN, 72 MONTHS, 11% PI PYMT 1950.00 BEAUTIFULLY DECORATED, FRESHLY PAINTED, NEW CARPET, DINING ELL, FENCED YARD, 2 CAR DETACHED GARAGE, FENCED LOT, OCCUPANCY AT C LOSING. THE SELLER IS REPLACING THE DRIVEWAY. ADAMA.
Key facts
- Fenced yard
- Fenced lot
- Dining ell
Tags
Property features AI
Exterior
- Parking: Detached 2-car garage
- Utilities: Public water; Public sewer
- Home design: Single-family residence; One level; Ground-level entry with steps
- Construction: Aluminum siding and brick exterior
- Exterior features: Front porch; Fenced yard; Paved road access; Lot approximately 0.13 acres (55 x 100)
Interior
- Kitchen: Garbage disposal
- Bedrooms: 6 total rooms (includes bedrooms and living spaces)
- Bathrooms: 1 full bathroom; 1 half bathroom
- Heating & cooling: Forced air heating (natural gas); No central cooling
- Interior features: Finished basement; Disposal
Neighborhood map
What this means for you Summary
Snapshot
- This is a 3-bed/2.0-bath single-family listed at $225k.
Deal economics
- At list price, monthly cash flow is $-85 ($-1k/yr) — negative.
- To cash-flow at today's rent, offer at most $210k (6.6% below list).
- To meet the 1% rule (rent ≥ 1% of price), the offer needs to be $175k (22.0% below list).
- Recommended offer: $175k (22.0% below list) — sets the bar for 1% rule.
Location & tenants
- Location reads 79/100 on livability (#82 in MI, #1,885 nationally) — a middle-class / working-renter tenant base. Strengths: commute A+, cost of living A+, housing A+; Watch: crime D+, employment D+, health & safety D+.
- South Redford School District (suburban): math 11% / reading 29% proficiency, ranked #455 of 540 in MI (top 84%) — low school quality limits family demand, transient renter base, plan for 1-2y turnover.
- Zoned schools: Vandenberg Elementary School (math 5% / reading 15%, grade F, #1,230 of 1,397 statewide, top 91%, 279 students, 82% FRL); John D Pierce Middle School (math 8% / reading 29%, grade F, #432 of 493 statewide, top 88%, 602 students, 68% FRL); Lee M Thurston High School (math 12% / reading 32%, grade F, #582 of 713 statewide, top 83%, 883 students, 62% FRL) — zoned schools average 71% FRL vs 52% district-wide (19 pts higher); higher-poverty schools than district average — tighter screening recommended.
- Market conditions: Rents rising (+3.2%/yr); 193 active listings in the ZIP; 13 comparable units currently listed for rent nearby; rentals at typical pace (median 19d on market — plan ~3-4 weeks tenant-placement turnaround); 2,639 units permitted in Wayne County in 2024 (1,216 in 5+ unit buildings).
Forward outlook
- Local home prices are declining (-3.0%/yr); year-one equity from $2k of loan paydown is wiped out by about $7k of value loss. Plan a longer hold.
- Wayne County population projected at -17% by 2050 — secular population decline; favor cash flow + early exit over multi-decade hold.
Negotiation context
- It's been on market 43 days — a 3% lower offer ($218k) is reasonable based on typical stale-listing flexibility.
- 4 sale attempts since 19y ago with the ask held roughly flat each time — persistent listings suggest the price (not the market) is what's stuck; bring a comps-based counter.
Risks & watch-outs
- Watch-outs: built in 1957 — expect roof / HVAC / electrical / plumbing capex.
Questions for the listing agent
- What do current leases actually rent for vs. the listed asking? Can we see a recent rent roll and the last 12 months of T-12 income?
- It's been on market 43 days. Have you received any prior offers? Is the seller open to a 22% concession, seller financing, or rate buy-down credit?
- Built in 1957 — when were the roof, HVAC, electrical panel, plumbing, and water heater last replaced?
- Is there a deadline driving the sale (1031 exchange, divorce, estate, relocation)? That informs how much negotiation room exists.
- Crime grade is D in this area — have there been break-ins, vandalism, or insurance claims at this property in the last 3 years? What carrier currently insures it and at what premium?
- The area grade is low — what's the realistic commute time and amenity access for the typical tenant pool here? Any planned neighborhood developments (good or bad) we should know about?
- What's the average days-on-market for RENTAL listings here right now (not sales)? A rising rental-DOM trend means longer vacancies and softer asking-rent achievability than the comps imply.
- What's the recent tenant-quality profile in this submarket — average credit score on applications, eviction rate, late-payment / NSF rate, and stable-employment percentage? A property-management company in the area should have these aggregated.
- How much new for-sale + rental construction is in the pipeline within 1–3 miles? Heavy new supply typically softens prices + rents 12–24 months out; constrained supply supports both.
Investment metrics
- 1% rule
- 0.78% ✗
- Cap rate
- 5.84%
- Cash-on-cash
- -1.61%
- DSCR
- 0.93
- GRM
- 10.7
CMA / ARV
- ARV (median comp)
- $226,723
- List price
- $224,900
- Delta
- -0.80%
- Verdict
- FAIR
- Comps
- 20 within 1.0 mi
Show comp detail 12 sales within ~0.75 mi
| Address | Dist | Beds/Ba | Sqft | Sold | Price | $/sf | Match |
|---|---|---|---|---|---|---|---|
| 9022 Winston | 0.13mi | 3/1.0 | 1,020 (0%) | 8mo | $215,000 | $211 | 83 |
| 8915 Wormer Ave | 0.16mi | 3/1.0 | 981 (-4%) | 1mo | $183,500 | $187 | 82 |
| 8627 Robindale Ave | 0.30mi | 3/1.0 | 980 (-4%) | 5mo | $169,000 | $172 | 72 |
| 8841 Virgil | 0.52mi | 3/1.0 | 1,013 (-1%) | 3mo | $185,000 | $183 | 68 |
| 8074 Nightingale St | 0.62mi | 3/1.0 | 1,020 (0%) | 6mo | $200,000 | $196 | 62 |
| 9025 Appleton | 0.47mi | 3/1.0 | 1,092 (+7%) | 6mo | $205,000 | $188 | 57 |
| 9375 Riverview | 0.57mi | 3/1.5 | 1,108 (+9%) | 6mo | $210,000 | $190 | 52 |
| 8656 Nightingale Ave. St | 0.32mi | 2/1.0 (-1) | 900 (-12%) | 6mo | $128,000 | $142 | 51 |
| 8356 Glengary St | 0.56mi | 3/1.0 | 1,100 (+8%) | 7mo | $253,000 | $230 | 51 |
| 25115 Joy Rd | 0.29mi | 2/1.0 (-1) | 870 (-15%) | 2mo | $80,000 | $92 | 51 |
| 8152 Virgil St | 0.75mi | 3/1.0 | 1,061 (+4%) | 5mo | $156,000 | $147 | 50 |
| 24428 W Chicago | 0.49mi | 2/1.0 (-1) | 912 (-11%) | 4mo | $95,000 | $104 | 48 |
Match score weights: distance 35% · size 25% · config 20% · recency 20%. Top-matched comps best support the ARV.
Projected returns pro-forma
-3.0% appreciation · 3.25% rent growth · sell at horizon
- IRR
- -18.7%
- Equity multiple
- 0.34×
- Total profit
- $-41,413
- Equity at exit
- $33,533
- IRR
- -10.7%
- Equity multiple
- 0.34×
- Total profit
- $-41,275
- Equity at exit
- $19,445
Cash invested: $62,972 (down + closing). Projections, not guarantees.
Landlord ↔ Tenant lean methodology
- Overall (STATE)
- 62 Landlord-Friendly
- State Michigan
- 62 Landlord-Friendly · EVEN
- County
- — inherits STATE
- City
- — inherits STATE
ZIP-level market 48239
- Rents YoY
- 3.2%
- Active inventory
- 193
- Price-to-rent
- 10.7×
Monthly cashflow live
- Estimated rent
- $1,755 high interval (Pro) →
- Mortgage (P&I)
- −$1,179
- Tax from tax record
- −$198 /mo · $2,373/yr
- Insurance
- −$94
- HOA
- −$0
- Vacancy / Maint / Mgmt
- −$368
- Net cashflow
- $-85
Break-even live
Sensitivity live
| Price | -10% $43 | -5% $-21 | +0% $-85 | +5% $-148 | +10% $-212 |
|---|---|---|---|---|---|
| Rent | -10% $-223 | -5% $-154 | +0% $-85 | +5% $-15 | +10% $54 |
| Rate | -1.0pp $29 | -0.5pp $-27 | base $-85 | +0.5pp $-143 | +1.0pp $-202 |
UW: 25.0% down · 7.5% · 30yr · 1.5% tax · 5.0% vac · 8.0% maint · 8.0% mgmt
Financing live
Cash to close
- Down payment
- $56,225
- Closing costs
- $6,747
- Reserves months
- —
- Total cash needed
- —
Loan-product check · same deal, 3 products live
Conventional
25% down · 7.5% · 30yr
- Down + closing
- —
- Monthly P&I
- —
- Monthly cashflow
- —
- DSCR
- —
- Eligible?
- —
Personal DTI + credit; lowest rate.
DSCR
20% down · 8.5% · 30yr
- Down + closing
- —
- Monthly P&I
- —
- Monthly cashflow
- —
- DSCR
- —
- Eligible?
- —
No personal income docs; deal must DSCR.
Hard money
10% down · 12.0% · 12mo
- Down + closing
- —
- Monthly P&I
- —
- Monthly cashflow
- —
- DSCR
- —
- Eligible?
- —
Short-term bridge; refi at stabilization.
Rent comps 13 comps
| Address | Beds | Baths | Sqft | Rent | $/sqft | DOM | Units | Dist |
|---|---|---|---|---|---|---|---|---|
| 8402 Robindale Ave Dearborn Heights, MI | 3.0 | 1.0 | 1190 | $1,600 | $1.34 | 16d | 1 | 0.36mi |
| 8455 Robindale Ave Dearborn Heights, MI | 3.0 | 1.0 | 1100 | $1,750 | $1.59 | 6d | 1 | 0.37mi |
| 8187 Lenore St Dearborn Heights, MI | 2.0 | 1.0 | 768 | $1,550 | $2.02 | 45d | 1 | 0.41mi |
| 8254 W Parkway St Redford, MI | 3.0 | 1.0 | 1220 | $1,350 | $1.11 | 14d | 1 | 0.87mi |
| 7462 N Vernon St Dearborn Heights, MI | 4.0 | 1.0 | 1113 | $1,900 | $1.71 | 0d | 1 | 0.89mi |
| 7420 Drexel St Dearborn Heights, MI | 2.0 | 1.0 | 1080 | $1,700 | $1.57 | 45d | 1 | 0.94mi |
| 7420 Drexel St Dearborn Heights, MI | 2.0 | 1.0 | 1080 | $1,700 | $1.57 | 19d | 1 | 0.94mi |
| 7420 Drexel St Dearborn Heights, MI | 2.0 | 1.0 | 1080 | $1,600 | $1.48 | 6d | 1 | 0.94mi |
| 7618 Hazelton St Dearborn Heights, MI | 3.0 | 1.0 | 1310 | $1,700 | $1.30 | 19d | 1 | 1.06mi |
| 6978 Mayburn St Dearborn Heights, MI | 3.0 | 2.0 | 1250 | $1,800 | $1.44 | 45d | 1 | 1.19mi |
| 7080 Highview St Dearborn Heights, MI | 3.0 | 2.5 | 1105 | $2,000 | $1.81 | 19d | 1 | 1.22mi |
| 7014 Kinmore St Dearborn Heights, MI | 3.0 | 1.0 | 960 | $1,900 | $1.98 | 23d | 1 | 1.29mi |
| 12107 Centralia Redford, MI | 3.0 | 1.0 | 912 | $1,800 | $1.97 | 45d | 1 | 1.49mi |
Listing history 16 events
-
2026-06-13statusdays on market $224,900 Pending 43 DOM
-
2026-06-09days on market $224,900 Active 42 DOM
-
2026-06-08days on market $224,900 Active 41 DOM
-
2026-06-07days on market $224,900 Active 40 DOM
-
2026-06-04days on market $224,900 Active 37 DOM
-
2026-06-03days on market $224,900 Active 36 DOM
-
2026-06-02days on market $224,900 Active 35 DOM
-
2026-06-01days on market $224,900 Active 34 DOM
-
2026-05-31days on market $224,900 Active 33 DOM
-
2026-04-27$224,900 Active 264-char remark
Show marketing remark (264 chars)
SUPER LAND CONTRACT TERMS, SELLER FINACING, 15K DOWN, 72 MONTHS, 11% PI PYMT 1950.00 BEAUTIFULLY DECORATED, FRESHLY PAINTED, NEW CARPET, DINING ELL, FENCED YARD, 2 CAR DETACHED GARAGE, FENCED LOT, OCCUPANCY AT C LOSING. THE SELLER IS REPLACING THE DRIVEWAY. ADAMA.
-
2007-08-06soldstatus $95,000
-
2007-06-12soldstatus $95,000
Show marketing remark (196 chars)
SUPER HOME-NEWER FURNACE-NEWER A/C-NEWER ROOF ON HOME-NEWER LIVING ROOM CARPETING -LARGE DINING ROOM OFF LIVING ROOM AND KITCHEN-SUPER PRICE -SOUTH REDFORD SCHOOLS- 2.5 CAR GARAGE-APPLIANCES STAY-
-
2007-04-09$104,900
Show marketing remark (196 chars)
SUPER HOME-NEWER FURNACE-NEWER A/C-NEWER ROOF ON HOME-NEWER LIVING ROOM CARPETING -LARGE DINING ROOM OFF LIVING ROOM AND KITCHEN-SUPER PRICE -SOUTH REDFORD SCHOOLS- 2.5 CAR GARAGE-APPLIANCES STAY-
-
2007-04-09historical
Show marketing remark (196 chars)
SUPER HOME-NEWER FURNACE-NEWER A/C-NEWER ROOF ON HOME-NEWER LIVING ROOM CARPETING -LARGE DINING ROOM OFF LIVING ROOM AND KITCHEN-SUPER PRICE -SOUTH REDFORD SCHOOLS- 2.5 CAR GARAGE-APPLIANCES STAY-
-
2007-01-10$104,900
ⓘ Source: listings_history table (triggers on properties + properties_extension) + one-shot
backfill from property_details.listing_events for pre-trigger history.
Tax reassessment forecast MI · Partial reset (capped growth)
- Current annual tax
- $2,373 · $198/mo
- Projected year-2 tax
- $2,918 · $243/mo
- Expected delta
- +$545/yr (+$45/mo · 23.0%)
ⓘ Screening estimate from a state-policy table — verify with the county assessor before closing.
Climate risk First Street
- Flood 3/10 Moderate FEMA zone X (unshaded) · 20% chance over 30 yrs
- Wildfire 1/10 Low
- Heat 3/10 Moderate 7 d/yr ≥98°F today · 15 d/yr by 30 yrs out
- Wind 2/10 Low
- Air quality 3/10 Moderate 2 unhealthy d/yr today · 3 by 30 yrs out
Nearby sold comps map
Loading sold comps map…
Walkable amenities ~0.75 mi
Loading nearby amenities…
Taxation est. · year 1
- Rental income
- $21,057
- − Mortgage interest
- −$12,598
- − Property taxes
- −$2,373
- − Insurance
- −$1,124
- − Repairs & maintenance
- −$1,685
- − Management
- −$1,685
- − Depreciation
- −$6,543
- Taxable loss
- −$4,950
- Est. tax savings @ 24.0%
- +$1,188
- After-tax cash flow
- $173/yr
For passive investors: Depreciation is non-cash, so a rental often shows a tax loss while cash-flowing — sheltering income. Rental losses are passive: they offset passive income freely, and up to $25,000/yr can offset ordinary (W-2) income if you actively participate and your MAGI is under $100k (phasing out to $0 by $150k); unused losses carry forward. On sale, claimed depreciation is recaptured at up to 25%, and gains may owe capital-gains tax (a 1031 exchange can defer both). Figures are a year-1 estimate at your 24.0% rate — not tax advice; consult a CPA.
Schools (NCES district)
- District
- South Redford School District
- NCES district ID
- 2632280
- Math proficiency
- 11% ▼ -9.00%
- Reading proficiency
- 29% ▼ -7.00%
- Median HH income
- $52,775
- Composite
- 18.1/100
- National rank
- #8972
- State rank
- #455 of 540 in MI
Livability — Dearborn Heights
- Score
- 79/100
- State rank
- #82
- US rank
- #1885
Category grades
Schools grade is shown separately in the Schools card above.
Census & demographics
- County
- Wayne County · 1,562,939 people
- City population
- 61,771
- Metro
- Detroit-Warren-Dearborn, MI
- Population (ZIP)
- 36,976
- Household income
- $71,151
- Rent vs Own
- Severe rent burden
- 1052.0
Population outlook (Wayne County) Hauer SSP2
- Today (2025)
- 1,675,273 people
- By 2030
- 1,620,300 · -3.3%
- By 2040
- 1,502,341 · -10.3%
- By 2050
- 1,384,039 · -17.4%
- By 2075
- 1,124,592 · -32.9%
- By 2100
- 881,193 · -47.4%
Race, ethnicity, and origin ACS 2023
- Neighborhood character
- Majority Black (58%)
- Race & ethnicity
- Black 58% White 34% Hispanic / Latino 4% Two or more races 4%
- Common ancestry
- Romanian 7% Slovak 2% Lithuanian 2%
- Foreign-born
- 2% · Canada
- Languages at home
- 96% English-only · Spanish 1% Other Indo-European 1% Arabic 1%
Political lean MEDSL · Wayne
- 2024 margin
- Strong D (+29.0) · D 62.7% · R 33.7% · Other 3.6%
- 2008→2024 swing
- -20.5pp toward R · 2008: 49.5pp · 2024: 29.0pp
- All cycles
- 2024: D+29.0 2020: D+38.1 2016: D+37.3 2012: D+46.9 2008: D+49.5
Not yet ingested
- Civics
- —
Market trends
- HPI YoY
- ▼ -202.97%
- Current HPI
- 236.1136
- Rent YoY
- ▲ 3.25%
- Metro
- Detroit-Warren-Dearborn, MI
- State GDP YoY
- ▲ 1.37%
- F500 in state
- 28
Industry mix (Fortune 500 HQ in MI)
| Industry | F500 HQs | Revenue |
|---|---|---|
| Automotive Parts | 3 | $48B |
|
||
| Automotive | 2 | $372B |
|
||
| Chemicals | 1 | $45B |
|
||
| Automotive Retail | 1 | $29B |
|
||
| Healthcare / Medical Devices | 1 | $23B |
|
||
| Automotive Technology | 1 | $20B |
|
||
Price history
+109.7% since first listed11 events — show timeline
- 2026-06-16 Sold (MLS) $220,000 MiRealSource-MiMLS
- 2026-06-16 Sold (MLS) $220,000 REALCOMP
- 2026-06-10 Pending — REALCOMP
- 2026-06-10 Pending — MiRealSource-MiMLS
- 2026-04-27 Listed $224,900 MiRealSource-MiMLS
- 2026-04-27 Listed $224,900 REALCOMP
- 2007-08-06 Sold (Public Records) $95,000 Public Records
- 2007-06-12 Sold (MLS) $95,000 REALCOMP
- 2007-04-09 Listing Removed — REALCOMP
- 2007-04-09 Listed $104,900 REALCOMP
- 2007-01-10 Listed $104,900 REALCOMP
Property tax history
+3.4%/yrLatest (2025): $2,373 · +2.7% YoY. Source: county tax records.
Cash-flow waterfall
monthlySold comps — $/sqft
last 12 mo · ≤1 miLoading sold comps…