 Multi-family
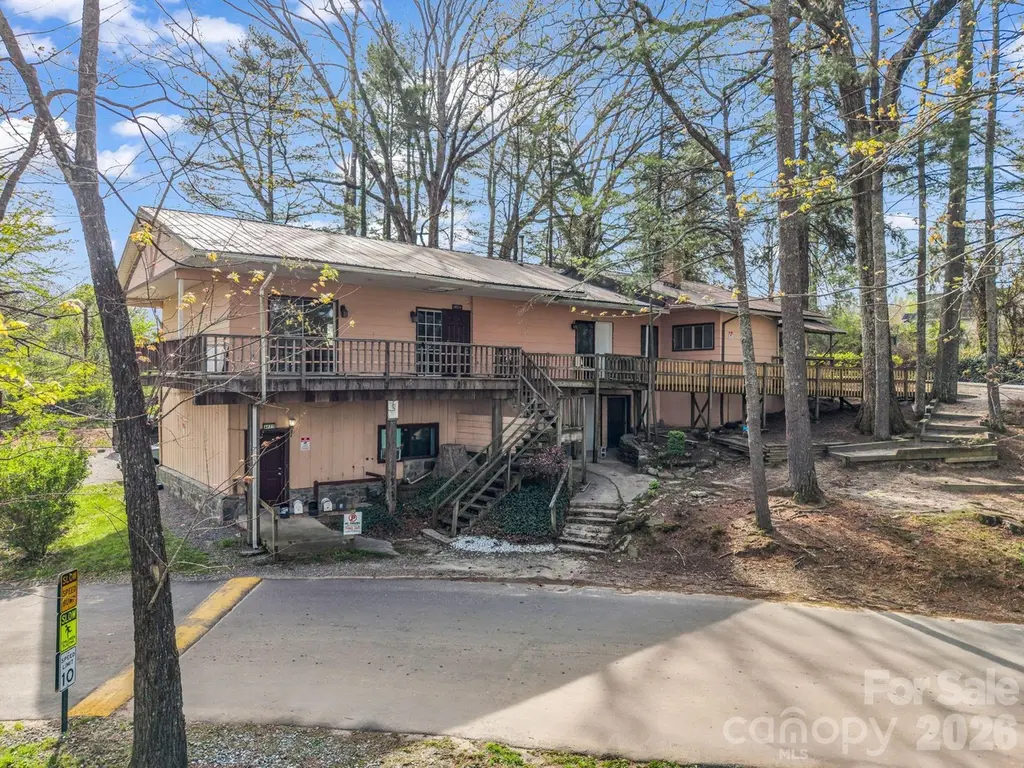
76 Adeles Way · Hendersonville, NC
Flood risk 9/10 · Severe
- FEMA flood zone
- X (unshaded)
- Chance of flooding over 30 yrs
- 0.99%
- Est. flood insurance / yr
- $473 – $860
Fire risk 4/10 · Minor
- Est. fire insurance / yr
- $906 – $1,684
Heat risk 4/10 · Minor
- Hot days now (above 98°F)
- 7 days/yr
- Hot days in 30 yrs
- 18 days/yr
Wind risk 2/10 · Minimal
- Chance of severe wind over 30 yrs
- —
Air-quality risk 3/10 · Minor
- Unhealthy air days now
- 2 days/yr
- Unhealthy air days in 30 yrs
- 3 days/yr
Risk factors via First Street. Map © Google.
Why this score? — see what drove the F grade
The composite is a weighted blend of 9 inputs, each scored 0–100. Each bar is that input's sub-score; the figure is the points it added to the 100-point composite (weight × sub-score).
- ARV discount +7.5/15.0
- Cash flow +7.1/30.0
- Schools +4.2/10.0
- Livability +3.9/5.0
- Rent growth +3.4/5.0
- Condition / age +2.5/5.0
- DSCR +1.3/10.0
- 1% rule +0.7/10.0
- Appreciation +0.0/10.0
$475,000
🖨 Deal sheet 📄 Offer letter ✓ Due diligence
Multi-family units
County records classify this as Multi-Family (5+ Unit). Listing-text estimate: 1 unit. estimate disagrees with records
5+ unit building — per-unit beds/baths from public records are typically unavailable; the breakdown below (if shown) is an estimate from the listing text.
Listing remarks
Welcome to 76 Adeles Way — a rare opportunity to own a multi-plex property now offered for sale. There are FIVE units. Opportunities like this don’t come around often in Henderson County: a single building featuring five rental units, ready for the right investor to bring it to life. With projected gross rental income just under $100,000 annually, this property offers strong income potential. Its convenient location near Walmart, Ingles, major shopping, and the I-26 corridor makes it highly attractive to tenants. Under Hendersonville’s updated zoning regulations, there may also be potential to add an additional single-family home on the property (buyer to verify; survey re
Key facts
- Multi-plex property
- Five rental units
- Convenient location
Tags
Property features AI
Finance
- Financial info: Five total units (all completed); Owner is responsible for electricity, water and sewer; tenants pay all utilities
- HOA & community: No HOA; Pets allowed
Exterior
- Parking: Parking lot available
- Utilities: City water; Public sewer; Owner pays electricity, sewer, and water; tenants pay all utilities
- Home design: Residential income property (apartment); Completed development
- Construction: Site-built construction; Wood construction materials; Basement foundation
- Exterior features: Private-maintained road access; Road surface is gravel and paved
Interior
- Kitchen: Kitchen appliances include oven and refrigerator
- Bedrooms: Seven total bedrooms across the property; Five completed residential units (mix of 1- and 2-bedroom units)
- Bathrooms: Five full bathrooms
- Heating & cooling: Baseboard heating; No central cooling listed
- Interior features: Oven and refrigerator included; Exterior-entry basement; Primary bedroom, living room, dining area, kitchen, and bonus room present
- Laundry & utility: No dedicated laundry features listed
Neighborhood map
What this means for you Summary
Snapshot
- This is a 7-bed/5.0-bath multifamily listed at $475k.
Deal economics
- At list price, monthly cash flow is $-730 ($-9k/yr) — negative.
- To cash-flow at today's rent, offer at most $346k (27.2% below list).
- To meet the 1% rule (rent ≥ 1% of price), the offer needs to be $271k (43.0% below list).
- Recommended offer: $271k (43.0% below list) — sets the bar for 1% rule.
- Cap rate 4.6% vs local median 3.5% in Hendersonville — top-decile yield for the area; either an underpriced asset or a hidden risk that comps aren't pricing in. Stress-test before assuming the spread holds.
Location & tenants
- Location reads 77/100 on livability (#29 in NC, #2,939 nationally) — a middle-class / working-renter tenant base. Strengths: amenities A+, cost of living A+, health & safety A+; Watch: crime D+, employment D+, commute F.
- Henderson County Schools (suburban): math 48% / reading 52% proficiency, ranked #64 of 178 in NC (top 36%) — acceptable for families but not a draw, mixed tenant base, ~2y average lease.
- Zoned schools: Sugarloaf Elementary (math 47% / reading 40%, grade F, #618 of 1,410 statewide, top 44%, 416 students, 81% FRL); North Henderson High (math 72% / reading 58%, grade B, #161 of 535 statewide, top 30%, 1,146 students, 61% FRL) — zoned schools average 71% FRL vs 46% district-wide (25 pts higher); higher-poverty schools than district average — tighter screening recommended.
- Market conditions: Rents rising (+3.6%/yr); 364 active listings in the ZIP; 1,534 units permitted in Henderson County in 2024 (558 in 5+ unit buildings).
- At $2,708/mo this rent would consume 59% of the median local household income ($56k/yr) (locally 1420% of renters already pay >50% of income on rent) — very limited rent-growth headroom before tenants either downsize or default.
Forward outlook
- Local home prices are declining (-3.0%/yr); year-one equity from $3k of loan paydown is wiped out by about $14k of value loss. Plan a longer hold.
- Henderson County population projected at +20% by 2050 — long-run rental-demand tailwind backs the buy-and-hold thesis.
Negotiation context
- It's been on market 68 days — a 6% lower offer ($446k) is reasonable based on typical stale-listing flexibility.
- Current owner paid $150k; list at $475k implies a 217% gain — meaningful room to come down on a strong offer.
Risks & watch-outs
- Watch-outs: flood insurance adds $56/mo.
- Climate carrying-cost: severe flood risk — expect insurance premiums to compound above CPI over the hold.
Questions for the listing agent
- What do current leases actually rent for vs. the listed asking? Can we see a recent rent roll and the last 12 months of T-12 income?
- It's been on market 68 days. Have you received any prior offers? Is the seller open to a 43% concession, seller financing, or rate buy-down credit?
- Built in 1973 — when were the roof, HVAC, electrical panel, plumbing, and water heater last replaced?
- What's the actual annual flood-insurance premium (NFIP or private), and is the property in a SFHA with mandatory coverage?
- Why hasn't it sold? Are there any deal-killer items the seller is aware of (foundation, flood, title, zoning, code violations)?
- Is there a deadline driving the sale (1031 exchange, divorce, estate, relocation)? That informs how much negotiation room exists.
- Crime grade is D in this area — have there been break-ins, vandalism, or insurance claims at this property in the last 3 years? What carrier currently insures it and at what premium?
- The area grade is low — what's the realistic commute time and amenity access for the typical tenant pool here? Any planned neighborhood developments (good or bad) we should know about?
- What's the average days-on-market for RENTAL listings here right now (not sales)? A rising rental-DOM trend means longer vacancies and softer asking-rent achievability than the comps imply.
- What's the recent tenant-quality profile in this submarket — average credit score on applications, eviction rate, late-payment / NSF rate, and stable-employment percentage? A property-management company in the area should have these aggregated.
- How much new apartment / multifamily construction is in the pipeline within 1–3 miles? Heavy new supply (>2% of stock underway) typically softens rents 12–24 months out; light construction supports rent growth.
Investment metrics
- 1% rule
- 0.57% ✗
- Cap rate
- 4.59%
- Cash-on-cash
- -6.09%
- DSCR
- 0.73
- GRM
- 14.6
CMA / ARV
No comps found within radius.
Projected returns pro-forma
-3.0% appreciation · 3.63% rent growth · sell at horizon
- IRR
- -27.2%
- Equity multiple
- 0.08×
- Total profit
- $-121,974
- Equity at exit
- $70,824
- IRR
- -23.5%
- Equity multiple
- -0.20×
- Total profit
- $-159,798
- Equity at exit
- $41,069
Cash invested: $133,000 (down + closing). Projections, not guarantees.
Landlord ↔ Tenant lean methodology
- Overall (STATE)
- 85 Strongly Landlord-Friendly
- State North Carolina
- 85 Strongly Landlord-Friendly · R+3
- County
- — inherits STATE
- City
- — inherits STATE
ZIP-level market 28792
- Rents YoY
- 3.6%
- Active inventory
- 364
- Price-to-rent
- 14.6×
Monthly cashflow live
- Estimated rent
- $2,708 medium interval (Pro) →
- Mortgage (P&I)
- −$2,491
- Tax from tax record
- −$125 /mo · $1,504/yr
- Insurance
- −$198
- Flood insurance flood zone
- −$56 /mo · $666/yr
- HOA
- −$0
- Vacancy / Maint / Mgmt
- −$569
- Net cashflow
- $-730
Break-even live
UW: 25.0% down · 7.5% · 30yr · 1.5% tax · 5.0% vac · 8.0% maint · 8.0% mgmt
Financing live
Cash to close
- Down payment
- $118,750
- Closing costs
- $14,250
- Reserves months
- —
- Total cash needed
- —
Loan-product check · same deal, 3 products live
Conventional
25% down · 7.5% · 30yr
- Down + closing
- —
- Monthly P&I
- —
- Monthly cashflow
- —
- DSCR
- —
- Eligible?
- —
Personal DTI + credit; lowest rate.
DSCR
20% down · 8.5% · 30yr
- Down + closing
- —
- Monthly P&I
- —
- Monthly cashflow
- —
- DSCR
- —
- Eligible?
- —
No personal income docs; deal must DSCR.
Hard money
10% down · 12.0% · 12mo
- Down + closing
- —
- Monthly P&I
- —
- Monthly cashflow
- —
- DSCR
- —
- Eligible?
- —
Short-term bridge; refi at stabilization.
Listing history 19 events
-
2026-06-18days on market $475,000 Active 68 DOM
-
2026-06-17days on market $475,000 Active 67 DOM
-
2026-06-16days on market $475,000 Active 66 DOM
-
2026-06-15days on market $475,000 Active 65 DOM
-
2026-06-14days on market $475,000 Active 63 DOM
-
2026-06-13days on market $475,000 Active 62 DOM
-
2026-06-10days on market $475,000 Active 60 DOM
-
2026-06-09days on market $475,000 Active 59 DOM
-
2026-06-08days on market $475,000 Active 58 DOM
-
2026-06-07days on market $475,000 Active 57 DOM
-
2026-06-05days on market $475,000 Active 54 DOM
-
2026-06-03days on market $475,000 Active 53 DOM
-
2026-06-02days on market $475,000 Active 52 DOM
-
2026-06-01days on market $475,000 Active 51 DOM
-
2026-05-31days on market $475,000 Active 50 DOM
-
2026-05-30days on market $475,000 Active 49 DOM
-
2026-05-18price $475,000
-
2026-04-11$500,000 Active
-
2003-11-04soldstatus $150,000
ⓘ Source: listings_history table (triggers on properties + properties_extension) + one-shot
backfill from property_details.listing_events for pre-trigger history.
Tax reassessment forecast NC · Resets to sale price
- Current annual tax
- $1,504 · $125/mo
- Projected year-2 tax
- $3,895 · $325/mo
- Expected delta
- +$2,391/yr (+$199/mo · 159.0%)
ⓘ Screening estimate from a state-policy table — verify with the county assessor before closing.
Climate risk First Street
- Flood 9/10 Extreme FEMA zone X (unshaded) · 99% chance over 30 yrs
- Wildfire 4/10 Moderate
- Heat 4/10 Moderate 7 d/yr ≥98°F today · 18 d/yr by 30 yrs out
- Wind 2/10 Low
- Air quality 3/10 Moderate 2 unhealthy d/yr today · 3 by 30 yrs out
Nearby sold comps map
Loading sold comps map…
Walkable amenities ~0.75 mi
Loading nearby amenities…
Taxation est. · year 1
- Rental income
- $32,497
- − Mortgage interest
- −$26,607
- − Property taxes
- −$1,504
- − Insurance
- −$3,042
- − Repairs & maintenance
- −$2,600
- − Management
- −$2,600
- − Depreciation
- −$13,818
- Taxable loss
- −$17,674
- Est. tax savings @ 24.0%
- +$4,242
- After-tax cash flow
- $-4,523/yr
For passive investors: Depreciation is non-cash, so a rental often shows a tax loss while cash-flowing — sheltering income. Rental losses are passive: they offset passive income freely, and up to $25,000/yr can offset ordinary (W-2) income if you actively participate and your MAGI is under $100k (phasing out to $0 by $150k); unused losses carry forward. On sale, claimed depreciation is recaptured at up to 25%, and gains may owe capital-gains tax (a 1031 exchange can defer both). Figures are a year-1 estimate at your 24.0% rate — not tax advice; consult a CPA.
Schools (NCES district)
- District
- Henderson County Schools
- NCES district ID
- 3702100
- Math proficiency
- 48% ▼ -2.00%
- Reading proficiency
- 52% ▼ -2.00%
- Median HH income
- $47,101
- Composite
- 42.5/100
- National rank
- #3206
- State rank
- #64 of 178 in NC
Livability — Hendersonville
- Score
- 77/100
- State rank
- #29
- US rank
- #2939
Category grades
Schools grade is shown separately in the Schools card above.
Census & demographics
- County
- Henderson County · 78,587 people
- City population
- 51,753
- Metro
- Asheville, NC
- Population (ZIP)
- 36,645
- Household income
- $55,522
- Rent vs Own
- Severe rent burden
- 1420.0
Population outlook (Henderson County) Hauer SSP2
- Today (2025)
- 124,075 people
- By 2030
- 129,690 · +4.5%
- By 2040
- 139,898 · +12.8%
- By 2050
- 148,298 · +19.5%
- By 2075
- 163,980 · +32.2%
- By 2100
- 166,962 · +34.6%
Race, ethnicity, and origin ACS 2023
- Neighborhood character
- Predominantly White (72%)
- Race & ethnicity
- White 72% Hispanic / Latino 20% Two or more races 8% Black 4% Native American 1%
- Hispanic origin (detail)
- Mexican 15% Puerto Rican 1%
- Common ancestry
- Slovak 3% Serbian 2% Lithuanian 2%
- Foreign-born
- 10% · Canada, Jamaica
- Languages at home
- 82% English-only · Spanish 16%
Political lean MEDSL · Henderson
- 2024 margin
- R (+14.6) · D 42.1% · R 56.7% · Other 1.1%
- 2008→2024 swing
- +6.5pp toward D · 2008: -21.0pp · 2024: -14.6pp
- All cycles
- 2024: R+14.6 2020: R+18.8 2016: R+27.9 2012: R+27.6 2008: R+21.0
Not yet ingested
- Civics
- —
Market trends
- HPI YoY
- ▼ -174.29%
- Current HPI
- 214.0215
- Rent YoY
- ▲ 3.63%
- Metro
- Asheville, NC
- State GDP YoY
- ▲ 3.28%
- F500 in state
- 26
Industry mix (Fortune 500 HQ in NC)
| Industry | F500 HQs | Revenue |
|---|---|---|
| Financial Services | 2 | $213B |
|
||
| Retail | 2 | $95B |
|
||
| Industrial Conglomerate | 1 | $38B |
|
||
| Metals / Steel | 1 | $35B |
|
||
| Utilities | 1 | $30B |
|
||
| Industrial Machinery | 1 | $19B |
|
||
Price history
+216.7% since first listed3 events — show timeline
- 2026-05-18 Price Changed $475,000 CANOPYMLS as Distributed by MLS Grid
- 2026-04-11 Listed $500,000 CANOPYMLS as Distributed by MLS Grid
- 2003-11-04 Sold (Public Records) $150,000 Public Records
Property tax history
+4.7%/yrLatest (2025): $1,504 · +0.0% YoY. Source: county tax records.
Cash-flow waterfall
monthlySold comps — $/sqft
last 12 mo · ≤1 miLoading sold comps…