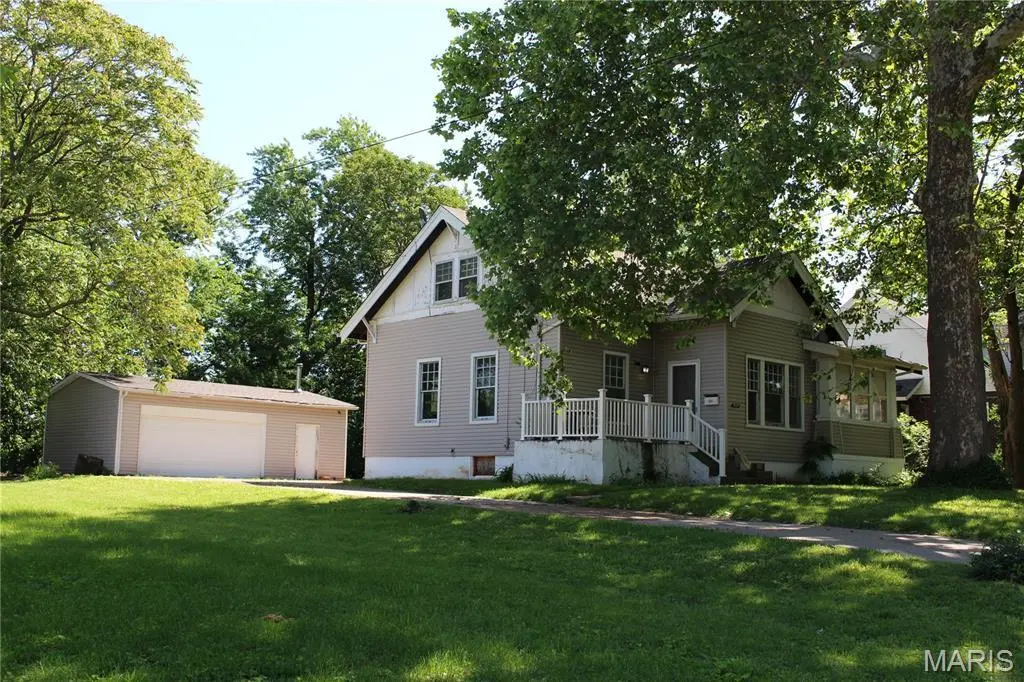
9119 Shelley Ave · Overland, MO
Flood risk 1/10 · Minimal
- FEMA flood zone
- X (unshaded)
- Chance of flooding over 30 yrs
- 0.0%
- Est. flood insurance / yr
- $473 – $860
Fire risk 1/10 · Minimal
- Est. fire insurance / yr
- $1,054 – $1,958
Heat risk 4/10 · Minor
- Hot days now (above 106°F)
- 7 days/yr
- Hot days in 30 yrs
- 21 days/yr
Wind risk 2/10 · Minimal
- Chance of severe wind over 30 yrs
- 1.0%
Air-quality risk 2/10 · Minimal
- Unhealthy air days now
- 1 days/yr
- Unhealthy air days in 30 yrs
- 3 days/yr
Risk factors via First Street. Map © Google.
Why this score? — see what drove the C+ grade
The composite is a weighted blend of 9 inputs, each scored 0–100. Each bar is that input's sub-score; the figure is the points it added to the 100-point composite (weight × sub-score).
- Cash flow +22.5/30.0
- ARV discount +15.0/15.0
- DSCR +7.2/10.0
- 1% rule +5.7/10.0
- Livability +3.1/5.0
- Rent growth +3.0/5.0
- Condition / age +2.5/5.0
- Schools +1.7/10.0
- Appreciation +0.0/10.0
$150,000
🖨 Deal sheet 📄 Offer letter ✓ Due diligence
Listing remarks
This 3 bedroom, 2 bath home with a full basement is ready for a new chapter. A little TLC, fresh paint and fixtures will make this a warm and comfortable home for generations to come. This historic home has the original custom millwork, including 10' baseboards and hardwood floors throughout. The beautiful radiators still work to deliver soft, even heating throughout 2 floors and the basement, and there's a gas connection for a gas heater in the fireplace mantel to boot! What will you do with the bright and cheery sunroom? Outdoors you'll find a 2-car garage with a bonus workshop with heat and air, a fire pit, small greenhouse and partial fencing. This property is listed As-Is. Call for y
Key facts
- 0.38 acre lot
- 2 garage spots
- Built 1916
Property features AI
Finance
- Other: Living area reported as 1,502 (assessor); Lot dimensions approximately 96' x 175' (about 0.38 acres); Asphalt road access; Seller will not consider lease; No home warranty
Exterior
- Parking: Detached, heated and lighted garage with garage door opener and workshop area (2 garage spaces); Concrete driveway; Oversized garage; Garage faces front
- Security: Lighted garage/parking area
- Utilities: Public water; Public sewer; Single-phase electric; Natural gas connected; Cable available; Phone available; Water, sewer and electricity connected
- Home design: Private, attached single-family residence; One-and-a-half level house; Concrete perimeter foundation; Shingle roof; Concrete, frame and vinyl siding construction; Garage size approximately 30' x 22'
- Construction: Built with concrete, frame and vinyl siding; Shingle roof; Concrete perimeter foundation; Basement: full, unfinished, 8'+ pour with walk-up access
- Exterior features: Front porch; Side porch; Fire pit; Back yard; Level lot; Chain link and partial wood fencing; Greenhouse; Workshop; Garage(s)
Interior
- Kitchen: Kitchen with walk-in pantry and historic millwork; Electric cooktop; Electric oven; Microwave; Dishwasher; Disposal; Refrigerator
- Bedrooms: 3 bedrooms total (1 on the main level, 2 upper-level)
- Flooring: Hardwood flooring; Vinyl flooring
- Bathrooms: 2 full bathrooms (1 on main level, 1 upper level); Main bathroom with tub/shower combo, single sink, toilet; Upper-level bathroom with shower, single sink, toilet (ensuite)
- Heating & cooling: Hot water heating; Ceiling fans; Window air conditioning units
- Interior features: Bookcases; Built-in features; Ceiling fans; High ceilings; Kitchen island; Main-level primary bedroom; Storage; Walk-in closet(s); Walk-in pantry; Wood-framed windows
- Laundry & utility: Washer hookup; Gas dryer hookup; Laundry in basement
Neighborhood map
What this means for you Summary
Snapshot
- This is a 3-bed/1.5-bath single-family listed at $150k.
Deal economics
- At list price, monthly cash flow is $253 ($3k/yr) — positive.
- The deal already cash-flows at list — no discount required.
- Meets the 1% rule at list price ($2k rent vs $150k).
- Recommended offer: $148k (1.5% below list) — sets the bar for market timing.
- Cap rate 8.3% vs local median 6.2% in Overland — top-decile yield for the area; either an underpriced asset or a hidden risk that comps aren't pricing in. Stress-test before assuming the spread holds.
Location & tenants
- Location reads 61/100 on livability (#436 in MO) — a middle-class / working-renter tenant base. Strengths: cost of living A+, housing A+; Watch: health & safety C-, crime F, amenities F.
- Ritenour (suburban): math 13% / reading 27% proficiency, ranked #304 of 324 in MO (top 94%) — low school quality limits family demand, transient renter base, plan for 1-2y turnover; 66% free/reduced lunch — lower-income household profile, screen leases tightly.
- Zoned schools: Wyland Elem. (math 13% / reading 25%, grade F, #958 of 1,115 statewide, top 86%, 490 students, 99% FRL); Ritenour Sr. High (math 9% / reading 36%, grade F, #455 of 521 statewide, top 88%, 1,873 students, 100% FRL) — zoned schools average 100% FRL vs 66% district-wide (34 pts higher); higher-poverty schools than district average — tighter screening recommended.
- Market conditions: Rents rising (+2.0%/yr); 118 active listings in the ZIP; 4 comparable units currently listed for rent nearby; rentals lingering (median 44d on market — plan ~5-8 weeks vacancy on turnover, expect pricing pressure); 75% of comp listings sitting > 30 days — soft ceiling on asking rent; 920 units permitted in St. Louis County in 2024 (250 in 5+ unit buildings).
- This rent runs 35% of the median local income ($56k/yr) — at the standard rent-burdened threshold; future hikes will face affordability resistance.
Forward outlook
- Local home prices are declining (-3.0%/yr); year-one equity from $1k of loan paydown is wiped out by about $4k of value loss. Plan a longer hold.
Negotiation context
- It's been on market 30 days — a 2% lower offer ($148k) is reasonable based on typical stale-listing flexibility.
- 3 sale attempts with the ask held roughly flat each time — persistent listings suggest the price (not the market) is what's stuck; bring a comps-based counter.
- Current owner paid $77k; list at $150k implies a 95% gain — meaningful room to come down on a strong offer.
Risks & watch-outs
- Watch-outs: built in 1916 — expect roof / HVAC / electrical / plumbing capex.
Questions for the listing agent
- Built in 1916 — when were the roof, HVAC, electrical panel, plumbing, and water heater last replaced?
- Is there a deadline driving the sale (1031 exchange, divorce, estate, relocation)? That informs how much negotiation room exists.
- Schools are F-rated, which usually means shorter tenancies and higher turnover. Who's the typical renter profile here, and what's been the actual vacancy rate?
- Crime grade is F in this area — have there been break-ins, vandalism, or insurance claims at this property in the last 3 years? What carrier currently insures it and at what premium?
- What's the average days-on-market for RENTAL listings here right now (not sales)? A rising rental-DOM trend means longer vacancies and softer asking-rent achievability than the comps imply.
- What's the recent tenant-quality profile in this submarket — average credit score on applications, eviction rate, late-payment / NSF rate, and stable-employment percentage? A property-management company in the area should have these aggregated.
- How much new for-sale + rental construction is in the pipeline within 1–3 miles? Heavy new supply typically softens prices + rents 12–24 months out; constrained supply supports both.
Investment metrics
- 1% rule
- 1.07% ✓
- Cap rate
- 8.32%
- Cash-on-cash
- 7.23%
- DSCR
- 1.32
- GRM
- 7.8
CMA / ARV
- ARV (median comp)
- $180,948
- List price
- $150,000
- Delta
- -17.10%
- Verdict
- UNDERPRICED
- Comps
- 20 within 1.0 mi
Show comp detail 12 sales within ~0.75 mi
| Address | Dist | Beds/Ba | Sqft | Sold | Price | $/sf | Match |
|---|---|---|---|---|---|---|---|
| 8822 Olden Ave | 0.44mi | 2/1.0 (-1) | 1,456 (-3%) | 3mo | $134,900 | $93 | 65 |
| 9512 Tennyson Ave | 0.40mi | 3/2.0 | 1,365 (-9%) | 2mo | $151,000 | $111 | 62 |
| 9531 Tennyson Ave | 0.45mi | 4/2.0 (+1) | 1,568 (+4%) | 4mo | $224,997 | $143 | 61 |
| 8804 Forest Ave | 0.48mi | 4/1.0 (+1) | 1,568 (+4%) | 8mo | $199,900 | $127 | 57 |
| 8910 Shawnee Ln | 0.48mi | 3/2.0 | 1,350 (-10%) | 4mo | $179,000 | $133 | 56 |
| 2307 S Milton Ave | 0.54mi | 3/2.5 | 1,587 (+6%) | 9mo | $239,990 | $151 | 54 |
| 9527 W Milton Ave | 0.49mi | 3/2.0 | 1,321 (-12%) | 2mo | $264,900 | $201 | 53 |
| 2412 Wallis Ave | 0.72mi | 3/1.5 | 1,411 (-6%) | 8mo | $85,500 | $61 | 50 |
| 2360 Goodale Ave | 0.40mi | 4/2.0 (+1) | 1,682 (+12%) | 6mo | $219,900 | $131 | 49 |
| 8916 Windom Ave | 0.44mi | 4/1.0 (+1) | 1,336 (-11%) | 6mo | $224,900 | $168 | 49 |
| 2331 Hood Ave | 0.67mi | 2/2.0 (-1) | 1,606 (+7%) | 5mo | $125,000 | $78 | 46 |
| 2326 Hood Ave | 0.65mi | 4/2.0 (+1) | 1,302 (-13%) | 5mo | $175,000 | $134 | 36 |
Match score weights: distance 35% · size 25% · config 20% · recency 20%. Top-matched comps best support the ARV.
Projected returns pro-forma
-3.0% appreciation · 2.04% rent growth · sell at horizon
- IRR
- -6.3%
- Equity multiple
- 0.77×
- Total profit
- $-9,724
- Equity at exit
- $22,365
- IRR
- 2.1%
- Equity multiple
- 1.15×
- Total profit
- $6,133
- Equity at exit
- $12,969
Cash invested: $42,000 (down + closing). Projections, not guarantees.
Landlord ↔ Tenant lean methodology
- Overall (STATE)
- 81 Strongly Landlord-Friendly
- State Missouri
- 81 Strongly Landlord-Friendly · R+10
- County
- — inherits STATE
- City
- — inherits STATE
ZIP-level market 63114
- Rents YoY
- 2.0%
- Active inventory
- 118
- Price-to-rent
- 7.8×
Monthly cashflow live
- Estimated rent
- $1,608 medium interval (Pro) →
- Mortgage (P&I)
- −$787
- Tax from tax record
- −$168 /mo · $2,021/yr
- Insurance
- −$62
- HOA
- −$0
- Vacancy / Maint / Mgmt
- −$338
- Net cashflow
- $253
Break-even live
UW: 25.0% down · 7.5% · 30yr · 1.5% tax · 5.0% vac · 8.0% maint · 8.0% mgmt
Financing live
Cash to close
- Down payment
- $37,500
- Closing costs
- $4,500
- Reserves months
- —
- Total cash needed
- —
Loan-product check · same deal, 3 products live
Conventional
25% down · 7.5% · 30yr
- Down + closing
- —
- Monthly P&I
- —
- Monthly cashflow
- —
- DSCR
- —
- Eligible?
- —
Personal DTI + credit; lowest rate.
DSCR
20% down · 8.5% · 30yr
- Down + closing
- —
- Monthly P&I
- —
- Monthly cashflow
- —
- DSCR
- —
- Eligible?
- —
No personal income docs; deal must DSCR.
Hard money
10% down · 12.0% · 12mo
- Down + closing
- —
- Monthly P&I
- —
- Monthly cashflow
- —
- DSCR
- —
- Eligible?
- —
Short-term bridge; refi at stabilization.
Rent comps 4 comps
| Address | Beds | Baths | Sqft | Rent | $/sqft | DOM | Units | Dist |
|---|---|---|---|---|---|---|---|---|
| 3209 Dix Ave Saint Louis, MO | 3.0 | 1.0 | 1122 | $1,550 | $1.38 | 23d | 1 | 0.74mi |
| 3213 Airway Ave Saint Louis, MO | 3.0 | 1.0 | 1215 | $1,550 | $1.28 | 43d | 1 | 0.92mi |
| 8601 Belhaven Dr Saint Louis, MO | 4.0 | 1.5 | 1507 | $1,850 | $1.23 | 43d | 1 | 1.15mi |
| 8821 McNulty Dr St. Louis, MO | 2.0 | 1.0 | 1504 | $1,225 | $0.81 | 43d | 1 | 1.31mi |
Listing history 14 events
-
2026-06-18days on market $150,000 Active 30 DOM
-
2026-06-17days on market $150,000 Active 29 DOM
-
2026-06-16days on market $150,000 Active 28 DOM
-
2026-06-15days on market $150,000 Active 27 DOM
-
2026-06-13days on market $150,000 Active 25 DOM
-
2026-06-09days on market $150,000 Active 21 DOM
-
2026-06-08days on market $150,000 Active 20 DOM
-
2026-06-07days on market $150,000 Active 19 DOM
-
2026-06-03statusdays on market $150,000 Active 15 DOM
-
2026-05-11$155,000 Active 730-char remark
-
2026-05-11historical $155,000 730-char remark
-
2022-06-28soldstatus
-
2014-04-01soldstatus $77,000
-
2003-07-10soldstatus $100,000
ⓘ Source: listings_history table (triggers on properties + properties_extension) + one-shot
backfill from property_details.listing_events for pre-trigger history.
Tax reassessment forecast MO · Resets to sale price
- Current annual tax
- $2,021 · $168/mo
- Projected year-2 tax
- $2,021 · $168/mo
- Expected delta
- $0/yr ($0/mo · 0.0%)
ⓘ Screening estimate from a state-policy table — verify with the county assessor before closing.
Climate risk First Street
- Flood 1/10 Low FEMA zone X (unshaded) · 0% chance over 30 yrs
- Wildfire 1/10 Low
- Heat 4/10 Moderate 7 d/yr ≥106°F today · 21 d/yr by 30 yrs out
- Wind 2/10 Low 100% chance of damaging wind over 30 yrs
- Air quality 2/10 Low 1 unhealthy d/yr today · 3 by 30 yrs out
Nearby sold comps map
Loading sold comps map…
Walkable amenities ~0.75 mi
Loading nearby amenities…
Taxation est. · year 1
- Rental income
- $19,298
- − Mortgage interest
- −$8,402
- − Property taxes
- −$2,021
- − Insurance
- −$750
- − Repairs & maintenance
- −$1,544
- − Management
- −$1,544
- − Depreciation
- −$4,364
- Taxable income
- $673
- Est. tax owed @ 24.0%
- −$162
- After-tax cash flow
- $2,873/yr
For passive investors: Depreciation is non-cash, so a rental often shows a tax loss while cash-flowing — sheltering income. Rental losses are passive: they offset passive income freely, and up to $25,000/yr can offset ordinary (W-2) income if you actively participate and your MAGI is under $100k (phasing out to $0 by $150k); unused losses carry forward. On sale, claimed depreciation is recaptured at up to 25%, and gains may owe capital-gains tax (a 1031 exchange can defer both). Figures are a year-1 estimate at your 24.0% rate — not tax advice; consult a CPA.
Schools (NCES district)
- District
- Ritenour
- NCES district ID
- 2926640
- Math proficiency
- 13% ▼ -14.00%
- Reading proficiency
- 27% ▼ -7.00%
- Median HH income
- $41,410
- Composite
- 17.04/100
- National rank
- #9125
- State rank
- #304 of 324 in MO
Livability — Overland
- Score
- 61/100
- State rank
- #436
- US rank
- #17870
Category grades
Schools grade is shown separately in the Schools card above.
Census & demographics
- Census place
- Overland, MO
- County
- Saint Louis County · 888,823 people
- City population
- 33,969
- Metro
- St. Louis, MO-IL
- Population (ZIP)
- 33,969
- Household income
- $55,870
- Rent vs Own
- Severe rent burden
- 1595.0
Population outlook (St. Louis County) Hauer SSP2
- Today (2025)
- 1,025,227 people
- By 2030
- 1,028,023 · +0.3%
- By 2040
- 1,020,940 · -0.4%
- By 2050
- 1,007,280 · -1.8%
- By 2075
- 987,277 · -3.7%
- By 2100
- 921,984 · -10.1%
Race, ethnicity, and origin ACS 2023
- Neighborhood character
- Diverse neighborhood (Simpson 0.64)
- Race & ethnicity
- White 50% Black 30% Hispanic / Latino 11% Two or more races 6% Asian 2%
- Hispanic origin (detail)
- Mexican 7%
- Common ancestry
- Lithuanian 3% Italian 2% Romanian 1%
- Foreign-born
- 9% · Canada, Vietnam
- Languages at home
- 84% English-only · Spanish 10% French/Haitian/Cajun 2% Tagalog/Filipino 1%
Political lean MEDSL · St. Louis
- 2024 margin
- Strong D (+23.4) · D 60.8% · R 37.4% · Other 1.7%
- 2008→2024 swing
- +3.5pp toward D · 2008: 19.9pp · 2024: 23.4pp
- All cycles
- 2024: D+23.4 2020: D+24.0 2016: D+16.2 2012: D+13.7 2008: D+19.9
Not yet ingested
- Civics
- —
Market trends
- HPI YoY
- ▼ -276.62%
- Current HPI
- 223.9305
- Rent YoY
- ▲ 2.04%
- Metro
- St. Louis, MO-IL
- State GDP YoY
- ▲ 1.84%
- F500 in state
- 20
Industry mix (Fortune 500 HQ in MO)
| Industry | F500 HQs | Revenue |
|---|---|---|
| Healthcare | 1 | $163B |
|
||
| Insurance | 1 | $21B |
|
||
| Industrial Technology | 1 | $17B |
|
||
| Retail | 1 | $16B |
|
||
| Industrial Distribution | 1 | $10B |
|
||
| Utilities | 1 | $9B |
|
||
Price history
+50.0% since first listed10 events — show timeline
- 2026-06-02 Relisted — MARIS as Distributed by MLS Grid
- 2026-05-27 Pending — MARIS as Distributed by MLS Grid
- 2026-05-22 Relisted — MARIS as Distributed by MLS Grid
- 2026-05-22 Price Changed $150,000 MARIS as Distributed by MLS Grid
- 2026-05-19 Pending — MARIS as Distributed by MLS Grid
- 2026-05-11 Listed $155,000 MARIS as Distributed by MLS Grid
- 2026-05-11 Coming Soon $155,000 MARIS as Distributed by MLS Grid
- 2022-06-28 Sold (Public Records) — Public Records
- 2014-04-01 Sold (Public Records) $77,000 Public Records
- 2003-07-10 Sold (Public Records) $100,000 Public Records
Property tax history
+3.2%/yrLatest (2022): $2,021 · +0.0% YoY. Source: county tax records.
Cash-flow waterfall
monthlySold comps — $/sqft
last 12 mo · ≤1 miLoading sold comps…