4849 Malvern Rd · Jones Mills, AR
Flood risk 1/10 · Minimal
- FEMA flood zone
- X (unshaded)
- Chance of flooding over 30 yrs
- 0.0%
- Est. flood insurance / yr
- $507 – $1,088
Fire risk 5/10 · Moderate
- Est. fire insurance / yr
- $1,499 – $2,785
Heat risk 6/10 · Moderate
- Hot days now (above 110°F)
- 7 days/yr
- Hot days in 30 yrs
- 22 days/yr
Wind risk 4/10 · Minor
- Chance of severe wind over 30 yrs
- 13.0%
Air-quality risk 2/10 · Minimal
- Unhealthy air days now
- 0 days/yr
- Unhealthy air days in 30 yrs
- 1 days/yr
Risk factors via First Street. Map © Google.
Why this score? — see what drove the B- grade
The composite is a weighted blend of 9 inputs, each scored 0–100. Each bar is that input's sub-score; the figure is the points it added to the 100-point composite (weight × sub-score).
- Cash flow +29.4/30.0
- DSCR +10.0/10.0
- ARV discount +7.5/15.0
- 1% rule +7.0/10.0
- Schools +4.0/10.0
- Rent growth +2.5/5.0
- Livability +2.5/5.0
- Condition / age +2.5/5.0
- Appreciation +0.0/10.0
$99,000
🖨 Deal sheet 📄 Offer letter ✓ Due diligence
Listing remarks
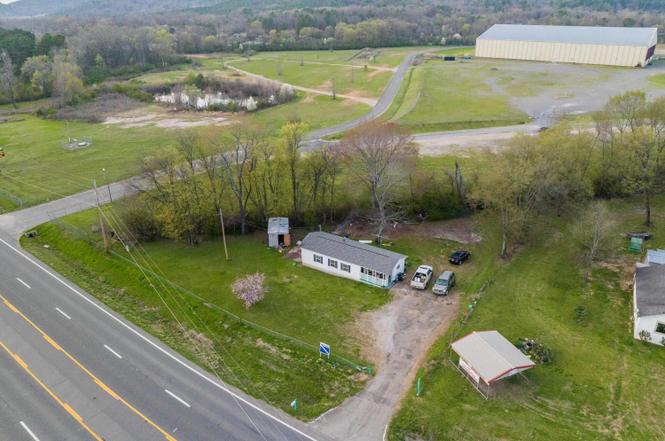
4849 Malvern Road. .. 123'+/- Frontage on Malvern Road. .. 14,000 Vehicles per day. .. Property is located adjacent to the entrance to the Garland County Fairgrounds. .. 3 Bedroom rental house on site. .. Value is in the land. .. High traffic location on Malvern Road. .. City water and sewer available at the road. .. Survey available upon request. .. See agent remarks.
Key facts
- 4 garage spots
- Built 1960
- Listed 160 days
Tags
Property features AI
Exterior
- Parking: 4 garage spaces
- Utilities: Public water; Public sewer
- Home design: Manufactured home (modular/manufactured); Single-story
- Construction: Composition roof
- Exterior features: Level lot; Storage structure
Interior
- Bathrooms: 1 full bathroom
- Interior features: Patio
Neighborhood map
What this means for you Summary
Snapshot
- This is a 3-bed/1.0-bath manufactured listed at $99k.
Deal economics
- At list price, monthly cash flow is $352 ($4k/yr) — positive.
- The deal already cash-flows at list — no discount required.
- Meets the 1% rule at list price ($1k rent vs $99k).
- Recommended offer: $87k (12.0% below list) — sets the bar for market timing.
Location & tenants
- Location reads: area grade B — affects rentability + tenant quality, not the cash-flow math above.
- Lakeside School District (urban): math 47% / reading 45% proficiency, ranked #28 of 238 in AR (top 12%) — families likely to look elsewhere, expect single-tenant / working-renter base with shorter leases.
- Market conditions: 363 active listings in the ZIP; 117 units permitted in Garland County in 2024 (24 in 5+ unit buildings).
Forward outlook
- Local home prices are declining (-3.0%/yr); year-one equity from $684 of loan paydown is wiped out by about $3k of value loss. Plan a longer hold.
- Garland County population projected at +7% by 2050 — modest demand growth; plan on rents tracking national, not racing it.
- At projected returns (-3.0% appreciation + 3.0% rent growth), your $28k cash investment doubles in ~8 years — after that, you're playing with house money.
Negotiation context
- It's been on market 161 days — a 12% lower offer ($87k) is reasonable based on typical stale-listing flexibility.
- 5 sale attempts since 3y ago with the ask held roughly flat each time — persistent listings suggest the price (not the market) is what's stuck; bring a comps-based counter.
- Current owner paid $30k; list at $99k implies a 230% gain — meaningful room to come down on a strong offer.
Risks & watch-outs
- Climate carrying-cost: moderate wildfire risk; extreme-heat days projected 7→22/yr by 2055 (HVAC capex compounding) — expect insurance premiums to compound above CPI over the hold.
Questions for the listing agent
- It's been on market 161 days. Have you received any prior offers? Is the seller open to a 12% concession, seller financing, or rate buy-down credit?
- Built in 1960 — when were the roof, HVAC, electrical panel, plumbing, and water heater last replaced?
- Why hasn't it sold? Are there any deal-killer items the seller is aware of (foundation, flood, title, zoning, code violations)?
- Is there a deadline driving the sale (1031 exchange, divorce, estate, relocation)? That informs how much negotiation room exists.
- What's the average days-on-market for RENTAL listings here right now (not sales)? A rising rental-DOM trend means longer vacancies and softer asking-rent achievability than the comps imply.
- What's the recent tenant-quality profile in this submarket — average credit score on applications, eviction rate, late-payment / NSF rate, and stable-employment percentage? A property-management company in the area should have these aggregated.
- How much new for-sale + rental construction is in the pipeline within 1–3 miles? Heavy new supply typically softens prices + rents 12–24 months out; constrained supply supports both.
Investment metrics
- 1% rule
- 1.20% ✓
- Cap rate
- 10.55%
- Cash-on-cash
- 15.22%
- DSCR
- 1.68
- GRM
- 6.9
CMA / ARV
No comps found within radius.
Projected returns pro-forma
-3.0% appreciation · 3.0% rent growth · sell at horizon
- IRR
- 5.9%
- Equity multiple
- 1.23×
- Total profit
- $6,309
- Equity at exit
- $14,761
- IRR
- 15.2%
- Equity multiple
- 2.23×
- Total profit
- $34,163
- Equity at exit
- $8,560
Cash invested: $27,720 (down + closing). Projections, not guarantees.
Landlord ↔ Tenant lean methodology
- Overall (STATE)
- 92 Strongly Landlord-Friendly
- State Arkansas
- 92 Strongly Landlord-Friendly · R+14
- County
- — inherits STATE
- City
- — inherits STATE
ZIP-level market 71901
- Home prices YoY
- -3.6%
- Active inventory
- 363
- Price-to-rent
- 6.9×
Monthly cashflow live
- Estimated rent
- $1,192 medium interval (Pro) →
- Mortgage (P&I)
- −$519
- Tax from tax record
- −$29 /mo · $352/yr
- Insurance
- −$41
- HOA
- −$0
- Vacancy / Maint / Mgmt
- −$250
- Net cashflow
- $352
Break-even live
UW: 25.0% down · 7.5% · 30yr · 1.5% tax · 5.0% vac · 8.0% maint · 8.0% mgmt
Financing live
Cash to close
- Down payment
- $24,750
- Closing costs
- $2,970
- Reserves months
- —
- Total cash needed
- —
Loan-product check · same deal, 3 products live
Conventional
25% down · 7.5% · 30yr
- Down + closing
- —
- Monthly P&I
- —
- Monthly cashflow
- —
- DSCR
- —
- Eligible?
- —
Personal DTI + credit; lowest rate.
DSCR
20% down · 8.5% · 30yr
- Down + closing
- —
- Monthly P&I
- —
- Monthly cashflow
- —
- DSCR
- —
- Eligible?
- —
No personal income docs; deal must DSCR.
Hard money
10% down · 12.0% · 12mo
- Down + closing
- —
- Monthly P&I
- —
- Monthly cashflow
- —
- DSCR
- —
- Eligible?
- —
Short-term bridge; refi at stabilization.
Listing history 27 events
-
2026-06-19days on market $99,000 Active 161 DOM
-
2026-06-18days on market $99,000 Active 160 DOM
-
2026-06-17days on market $99,000 Active 159 DOM
-
2026-06-16days on market $99,000 Active 158 DOM
-
2026-06-15days on market $99,000 Active 157 DOM
-
2026-06-14days on market $99,000 Active 155 DOM
-
2026-06-13days on market $99,000 Active 154 DOM
-
2026-06-10days on market $99,000 Active 152 DOM
-
2026-06-09days on market $99,000 Active 151 DOM
-
2026-06-08days on market $99,000 Active 150 DOM
-
2026-06-07days on market $99,000 Active 149 DOM
-
2026-06-05days on market $99,000 Active 146 DOM
-
2026-06-03days on market $99,000 Active 145 DOM
-
2026-06-02days on market $99,000 Active 144 DOM
-
2026-06-01days on market $99,000 Active 143 DOM
-
2026-05-31days on market $99,000 Active 142 DOM
-
2026-05-30days on market $99,000 Active 141 DOM
-
2026-01-09$99,000 Active
-
2024-07-29historical
-
2024-06-28$99,000 New Listing
-
2024-06-25historical
-
2024-05-26$99,000 New Listing
-
2024-05-22historical
-
2024-02-23$99,000 New Listing
-
2024-01-18historical
-
2023-01-17$99,000 New Listing
-
2004-07-26soldstatus $30,000
ⓘ Source: listings_history table (triggers on properties + properties_extension) + one-shot
backfill from property_details.listing_events for pre-trigger history.
Tax reassessment forecast AR · Resets to sale price
- Current annual tax
- $352 · $29/mo
- Projected year-2 tax
- $634 · $53/mo
- Expected delta
- +$281/yr (+$23/mo · 79.8%)
ⓘ Screening estimate from a state-policy table — verify with the county assessor before closing.
Climate risk First Street
- Flood 1/10 Low FEMA zone X (unshaded) · 0% chance over 30 yrs
- Wildfire 5/10 Major
- Heat 6/10 Major 7 d/yr ≥110°F today · 22 d/yr by 30 yrs out
- Wind 4/10 Moderate 13% chance of damaging wind over 30 yrs
- Air quality 2/10 Low 0 unhealthy d/yr today · 1 by 30 yrs out
Nearby sold comps map
Loading sold comps map…
Walkable amenities ~0.75 mi
Loading nearby amenities…
Taxation est. · year 1
- Rental income
- $14,299
- − Mortgage interest
- −$5,546
- − Property taxes
- −$352
- − Insurance
- −$495
- − Repairs & maintenance
- −$1,144
- − Management
- −$1,144
- − Depreciation
- −$2,880
- Taxable income
- $2,738
- Est. tax owed @ 24.0%
- −$657
- After-tax cash flow
- $3,562/yr
For passive investors: Depreciation is non-cash, so a rental often shows a tax loss while cash-flowing — sheltering income. Rental losses are passive: they offset passive income freely, and up to $25,000/yr can offset ordinary (W-2) income if you actively participate and your MAGI is under $100k (phasing out to $0 by $150k); unused losses carry forward. On sale, claimed depreciation is recaptured at up to 25%, and gains may owe capital-gains tax (a 1031 exchange can defer both). Figures are a year-1 estimate at your 24.0% rate — not tax advice; consult a CPA.
Schools (NCES district)
- District
- Lakeside School District
- NCES district ID
- 0508670
- Math proficiency
- 47% ▼ -16.00%
- Reading proficiency
- 45% ▼ -9.00%
- Median HH income
- $52,849
- Composite
- 39.76/100
- National rank
- #3884
- State rank
- #28 of 238 in AR
Livability — Jones Mills
No livability data for this city. (Only ~50 U.S. cities are tracked.)
Census & demographics
- County
- Garland County · 76,414 people
- Metro
- Hot Springs, AR
- Population (ZIP)
- 28,937
- Household income
- $53,514
- Rent vs Own
- Severe rent burden
- 961.0
Population outlook (Garland County) Hauer SSP2
- Today (2025)
- 100,343 people
- By 2030
- 101,880 · +1.5%
- By 2040
- 104,804 · +4.4%
- By 2050
- 107,292 · +6.9%
- By 2075
- 113,182 · +12.8%
- By 2100
- 112,247 · +11.9%
Race, ethnicity, and origin ACS 2023
- Neighborhood character
- Predominantly White (71%)
- Race & ethnicity
- White 71% Black 13% Hispanic / Latino 10% Two or more races 6%
- Hispanic origin (detail)
- Mexican 7%
- Common ancestry
- Italian 2% Slovak 2% Portuguese 1%
- Foreign-born
- 5% · Canada, Vietnam
- Languages at home
- 90% English-only · Spanish 7% Vietnamese 1%
Political lean MEDSL · Garland
- 2024 margin
- Solid R (+36.2) · D 30.8% · R 67.0% · Other 2.2%
- 2008→2024 swing
- -11.3pp toward R · 2008: -25.0pp · 2024: -36.2pp
- All cycles
- 2024: R+36.2 2020: R+34.0 2016: R+34.1 2012: R+29.9 2008: R+25.0
Not yet ingested
- Civics
- —
Market trends
- HPI YoY
- ▼ -11.75%
- Current HPI
- 317.2542
- Rent YoY
- —
- Metro
- Hot Springs, AR
- State GDP YoY
- ▲ 3.80%
- F500 in state
- 10
Industry mix (Fortune 500 HQ in AR)
| Industry | F500 HQs | Revenue |
|---|---|---|
| Retail | 1 | $681B |
|
||
| Food / Agriculture | 1 | $53B |
|
||
| Retail / Energy | 1 | $22B |
|
||
| Transportation / Logistics | 1 | $12B |
|
||
| Energy | 1 | $4B |
|
||
Price history
+230.0% since first listed10 events — show timeline
- 2026-01-09 Listed $99,000 HSBOR
- 2024-07-29 Listing Removed — CARMLS
- 2024-06-28 Listed $99,000 CARMLS
- 2024-06-25 Listing Removed — CARMLS
- 2024-05-26 Listed $99,000 CARMLS
- 2024-05-22 Listing Removed — CARMLS
- 2024-02-23 Listed $99,000 CARMLS
- 2024-01-18 Listing Removed — CARMLS
- 2023-01-17 Listed $99,000 CARMLS
- 2004-07-26 Sold (Public Records) $30,000 Public Records
Property tax history
+7.3%/yrLatest (2025): $352 · -0.6% YoY. Source: county tax records.
Cash-flow waterfall
monthlySold comps — $/sqft
last 12 mo · ≤1 miLoading sold comps…