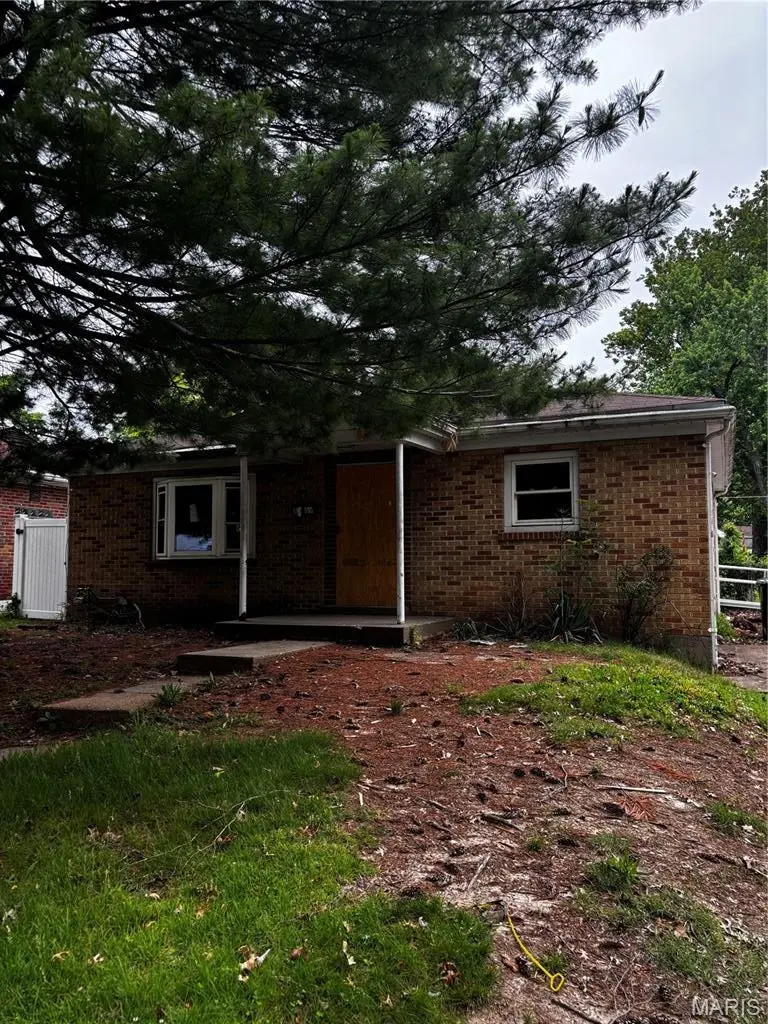
8409 Braddock Dr · University City, MO
Flood risk 1/10 · Minimal
- FEMA flood zone
- X (unshaded)
- Chance of flooding over 30 yrs
- 0.0%
- Est. flood insurance / yr
- $473 – $860
Fire risk 1/10 · Minimal
- Est. fire insurance / yr
- $1,054 – $1,958
Heat risk 5/10 · Moderate
- Hot days now (above 107°F)
- 7 days/yr
- Hot days in 30 yrs
- 21 days/yr
Wind risk 2/10 · Minimal
- Chance of severe wind over 30 yrs
- 1.0%
Air-quality risk 2/10 · Minimal
- Unhealthy air days now
- 1 days/yr
- Unhealthy air days in 30 yrs
- 3 days/yr
Risk factors via First Street. Map © Google.
Why this score? — see what drove the B+ grade
The composite is a weighted blend of 9 inputs, each scored 0–100. Each bar is that input's sub-score; the figure is the points it added to the 100-point composite (weight × sub-score).
- Cash flow +30.0/30.0
- ARV discount +15.0/15.0
- 1% rule +10.0/10.0
- DSCR +10.0/10.0
- Rent growth +4.2/5.0
- Livability +3.7/5.0
- Condition / age +2.5/5.0
- Schools +1.9/10.0
- Appreciation +0.0/10.0
$74,900
🖨 Deal sheet 📄 Offer letter ✓ Due diligence
Listing remarks
Opportunity awaits with this charming 2 bed, 2 bath bungalow offering just under 1,000 sqft on the main level plus a partially finished basement for additional living space or future expansion potential. Situated on a nice fenced backyard lot with a detached 1-car garage, this property has the solid bones investors and sweat-equity buyers are looking for. While the home does need updating throughout, much of the work is primarily aesthetic, making this a great value-add opportunity. Whether you're looking for your next flip, rental, or renovation project, this property is loaded with potential and ready for your vision. Convenient layout, functional space, and plenty of upside make this one
Key facts
- Fenced backyard
- Detached garage
- 6,534 sq ft lot
Tags
Property features AI
Finance
- Other: Living area reported as 952 (public records); Lot includes approximately 0.15 acre
- Financial info: No additional financial details provided
- HOA & community: No HOA information provided
Exterior
- Parking: 1-car garage
- Security: No security details provided
- Utilities: Public water; Public sewer; Electric service by Ameren; Electricity connected; Natural gas connected; Sewer connected; Water connected
- Home design: Single-family residence; One level
- Construction: Brick construction
- Exterior features: Back yard
Interior
- Kitchen: No specific appliances listed
- Bedrooms: 2 bedrooms (both on the main level)
- Flooring: No flooring details provided
- Bathrooms: 1 full bath; 1 half bath
- Heating & cooling: Forced air heating (natural gas); Central air conditioning (electric)
- Interior features: Full basement
- Laundry & utility: No specific laundry appliances listed
Neighborhood map
What this means for you Summary
Snapshot
- This is a 2-bed/2.0-bath single-family listed at $75k.
Deal economics
- At list price, monthly cash flow is $549 ($7k/yr) — positive.
- The deal already cash-flows at list — no discount required.
- Meets the 1% rule at list price ($1k rent vs $75k).
- Cap rate 15.1% vs local median 4.9% in University City — top-decile yield for the area; either an underpriced asset or a hidden risk that comps aren't pricing in. Stress-test before assuming the spread holds.
Location & tenants
- Location reads 73/100 on livability (#84 in MO) — a middle-class / working-renter tenant base. Strengths: employment A+, housing A+, cost of living B; Watch: amenities D-, commute D-, health & safety F.
- University City (suburban): math 15% / reading 26% proficiency, ranked #297 of 324 in MO (top 92%) — low school quality limits family demand, transient renter base, plan for 1-2y turnover; 67% free/reduced lunch — lower-income household profile, screen leases tightly.
- Zoned schools: Barbara Jordan Elem. (math 8% / reading 22%, grade F, #982 of 1,115 statewide, top 89%, 310 students, 100% FRL); University City Sr. High (math 5% / reading 52%, grade F, #409 of 521 statewide, top 79%, 726 students, 100% FRL) — zoned schools average 100% FRL vs 67% district-wide (32 pts higher); higher-poverty schools than district average — tighter screening recommended.
- Market conditions: Rents rising fast (+6.6%/yr); 52 active listings in the ZIP; 26 comparable units currently listed for rent nearby; rentals at typical pace (median 15d on market — plan ~3-4 weeks tenant-placement turnaround); solid renter incomes; 920 units permitted in St. Louis County in 2024 (250 in 5+ unit buildings).
Forward outlook
- Local home prices are declining (-3.0%/yr); year-one equity from $518 of loan paydown is wiped out by about $2k of value loss. Plan a longer hold.
- At projected returns (-3.0% appreciation + 6.6% rent growth), your $21k cash investment doubles in ~4 years — after that, you're playing with house money.
Negotiation context
- Only 5 days on market — expect competitive offers; lowballing is unlikely to land.
Risks & watch-outs
- Watch-outs: built in 1954 — expect roof / HVAC / electrical / plumbing capex.
- Climate carrying-cost: extreme-heat days projected 7→21/yr by 2055 (HVAC capex compounding) — expect insurance premiums to compound above CPI over the hold.
Questions for the listing agent
- Built in 1954 — when were the roof, HVAC, electrical panel, plumbing, and water heater last replaced?
- Is there a deadline driving the sale (1031 exchange, divorce, estate, relocation)? That informs how much negotiation room exists.
- Schools are B-rated — typically a magnet for longer-tenancy family renters. What's the average tenant stay here, and is there a school-zone premium baked into asking?
- What's the average days-on-market for RENTAL listings here right now (not sales)? A rising rental-DOM trend means longer vacancies and softer asking-rent achievability than the comps imply.
- What's the recent tenant-quality profile in this submarket — average credit score on applications, eviction rate, late-payment / NSF rate, and stable-employment percentage? A property-management company in the area should have these aggregated.
- How much new for-sale + rental construction is in the pipeline within 1–3 miles? Heavy new supply typically softens prices + rents 12–24 months out; constrained supply supports both.
Investment metrics
- 1% rule
- 1.86% ✓
- Cap rate
- 15.08%
- Cash-on-cash
- 31.39%
- DSCR
- 2.40
- GRM
- 4.5
CMA / ARV
- ARV (on-the-fly)
- $138,040
- Comps found
- 12
Show comp detail 12 sales within ~0.75 mi
| Address | Dist | Beds/Ba | Sqft | Sold | Price | $/sf | Match |
|---|---|---|---|---|---|---|---|
| 8409 Braddock Dr | 0.00mi | 2/1.5 | 952 (0%) | 0mo | $74,900 | $79 | 98 |
| 8249 Appleton Dr | 0.11mi | 2/1.0 | 936 (-2%) | 2mo | $85,000 | $91 | 87 |
| 8370 Orchard Ave | 0.21mi | 2/2.0 | 864 (-9%) | 6mo | $125,000 | $145 | 69 |
| 1437 Coolidge Dr | 0.12mi | 2/1.0 | 850 (-11%) | 6mo | $139,500 | $164 | 67 |
| 1459 Sheridan Dr | 0.20mi | 2/1.5 | 864 (-9%) | 7mo | $100,000 | $116 | 67 |
| 8124 Braddock Dr | 0.30mi | 2/1.5 | 850 (-11%) | 3mo | $90,000 | $106 | 63 |
| 8259 Paramount Dr | 0.26mi | 2/1.5 | 850 (-11%) | 7mo | $95,000 | $112 | 62 |
| 1319 Rushmore Dr | 0.50mi | 3/1.5 (+1) | 1,025 (+8%) | 6mo | $209,500 | $204 | 52 |
| 1243 Fairview Ave | 0.71mi | 3/2.0 (+1) | 1,008 (+6%) | 1mo | $185,000 | $184 | 51 |
| 1349 Rushmore Dr | 0.45mi | 3/2.0 (+1) | 1,068 (+12%) | 7mo | $349,900 | $328 | 48 |
| 1323 Fairview Ave | 0.68mi | 2/1.0 | 1,032 (+8%) | 7mo | $149,900 | $145 | 44 |
| 1170 Margaret Ln | 0.70mi | 3/1.0 (+1) | 1,040 (+9%) | 0mo | $250,000 | $240 | 43 |
Match score weights: distance 35% · size 25% · config 20% · recency 20%. Top-matched comps best support the ARV.
Projected returns pro-forma
-3.0% appreciation · 6.64% rent growth · sell at horizon
- IRR
- 30.5%
- Equity multiple
- 2.34×
- Total profit
- $28,122
- Equity at exit
- $11,168
- IRR
- 39.8%
- Equity multiple
- 5.43×
- Total profit
- $92,978
- Equity at exit
- $6,476
Cash invested: $20,972 (down + closing). Projections, not guarantees.
Landlord ↔ Tenant lean methodology
- Overall (STATE)
- 81 Strongly Landlord-Friendly
- State Missouri
- 81 Strongly Landlord-Friendly · R+10
- County
- — inherits STATE
- City
- — inherits STATE
ZIP-level market 63132
- Rents YoY
- 6.6%
- Active inventory
- 52
- Price-to-rent
- 4.5×
Monthly cashflow live
- Estimated rent
- $1,389 high interval (Pro) →
- Mortgage (P&I)
- −$393
- Tax from tax record
- −$125 /mo · $1,500/yr
- Insurance
- −$31
- HOA
- −$0
- Vacancy / Maint / Mgmt
- −$292
- Net cashflow
- $549
Break-even live
UW: 25.0% down · 7.5% · 30yr · 1.5% tax · 5.0% vac · 8.0% maint · 8.0% mgmt
Financing live
Cash to close
- Down payment
- $18,725
- Closing costs
- $2,247
- Reserves months
- —
- Total cash needed
- —
Loan-product check · same deal, 3 products live
Conventional
25% down · 7.5% · 30yr
- Down + closing
- —
- Monthly P&I
- —
- Monthly cashflow
- —
- DSCR
- —
- Eligible?
- —
Personal DTI + credit; lowest rate.
DSCR
20% down · 8.5% · 30yr
- Down + closing
- —
- Monthly P&I
- —
- Monthly cashflow
- —
- DSCR
- —
- Eligible?
- —
No personal income docs; deal must DSCR.
Hard money
10% down · 12.0% · 12mo
- Down + closing
- —
- Monthly P&I
- —
- Monthly cashflow
- —
- DSCR
- —
- Eligible?
- —
Short-term bridge; refi at stabilization.
Rent comps 26 comps
| Address | Beds | Baths | Sqft | Rent | $/sqft | DOM | Units | Dist |
|---|---|---|---|---|---|---|---|---|
| 8303 Braddock Dr Saint Louis, MO | 2.0 | 1.0 | 720 | $1,075 | $1.49 | 23d | 1 | 0.18mi |
| 8246 Montreal Dr Saint Louis, MO | 2.0 | 1.0 | 850 | $1,450 | $1.71 | 43d | 1 | 0.23mi |
| 1276 Vaughan Dr Saint Louis, MO | 2.0 | 1.0 | 825 | $1,100 | $1.33 | 16d | 1 | 0.41mi |
| 1150 N Price Rd St. Louis, MO | 1.0–3.0 | 1.0–2.0 | 999 | $2,758 | $2.76 | 1d | 151 | 0.74mi |
| 8449 Atherton Dr St. Louis, MO | 1.0–2.0 | 1.0 | 900 | $1,245 | $1.38 | 2d | 2 | 0.77mi |
| 8669 Old Towne Dr St. Louis, MO | 1.0–3.0 | 1.0–2.0 | 1335 | $1,602 | $1.20 | 1d | 9 | 0.78mi |
| 9150 Olive Xing St. Louis, MO | 1.0–2.0 | 1.0–2.0 | 1084 | $3,575 | $3.30 | 1d | 3 | 0.79mi |
| 1245 North and South Rd Saint Louis, MO | 2.0 | 1.0 | 860 | $1,200 | $1.40 | 14d | 1 | 0.93mi |
| 7720 Ahern Ave University City, MO | 2.0 | 1.0 | 1080 | $1,350 | $1.25 | 43d | 1 | 1.10mi |
| 8650 Kingsbridge Dr St. Louis, MO | 1.0–2.0 | 1.0 | 660 | $1,450 | $2.20 | 2d | 10 | 1.12mi |
| 1086 Wilshire Ave Saint Louis, MO | 2.0 | 1.0 | 1080 | $1,306 | $1.21 | 4d | 1 | 1.13mi |
| 978 Warder Ave University City, MO | 3.0 | 1.5 | 1100 | $1,145 | $1.04 | 23d | 1 | 1.14mi |
| 7737 Wild Plum Ln University City, MO | 3.0 | 1.5 | 900 | $1,200 | $1.33 | 12d | 1 | 1.16mi |
| 1351 N Hanley Rd Saint Louis, MO | 1.0–2.0 | 1.0–2.0 | 911 | $1,575 | $1.73 | 43d | 1 | 1.18mi |
| 1 Heartwoods Ct Unit A St. Louis, MO | 2.0 | 1.0 | 850 | $1,495 | $1.76 | 14d | 1 | 1.22mi |
| 2201 Gaebler Ave Unit A Overland, MO | 2.0 | 1.0 | 710 | $1,250 | $1.76 | 23d | 1 | 1.25mi |
| 7430 Canton Ave Saint Louis, MO | 3.0 | 1.0 | 1075 | $1,450 | $1.35 | 23d | 1 | 1.25mi |
| 8241 Delmar Blvd Apt 2E St. Louis, MO | 2.0 | 1.0 | 1100 | $1,175 | $1.07 | 14d | 1 | 1.25mi |
| 8400 Delmar Blvd St. Louis, MO | 3.0 | 1.0–2.0 | 1006 | $2,967 | $2.95 | 1d | 8 | 1.31mi |
| 7386 Milan Ave Saint Louis, MO | 2.0 | 1.0 | 960 | $1,400 | $1.46 | 4d | 1 | 1.33mi |
| 8680 Delmar Blvd Saint Louis, MO | 1.0–2.0 | 1.0–2.0 | 910 | $3,325 | $3.65 | 1d | 14 | 1.34mi |
| 8342 Delcrest Dr Saint Louis, MO | 1.0–3.0 | 1.0–2.0 | 1089 | $2,342 | $2.15 | 1d | 16 | 1.41mi |
| 2323 Woodson Rd Apt I Overland, MO | 1.0 | 1.0 | 650 | $875 | $1.35 | 7d | 1 | 1.44mi |
| 2323 Woodson Rd Apt J Overland, MO | 1.0 | 1.0 | 605 | $875 | $1.45 | 43d | 1 | 1.44mi |
| 1535 N Jackson Ave Saint Louis, MO | 2.0 | 1.0 | 988 | $1,450 | $1.47 | 43d | 1 | 1.48mi |
| 9472 Olive Blvd Olivette, MO | 1.0–2.0 | 1.0–2.0 | 701 | $1,210 | $1.73 | 3d | 3 | 1.50mi |
Listing history 3 events
-
2026-05-22$74,900 Active
-
2005-09-23soldstatus
-
1975-10-16soldstatus
ⓘ Source: listings_history table (triggers on properties + properties_extension) + one-shot
backfill from property_details.listing_events for pre-trigger history.
Tax reassessment forecast MO · Resets to sale price
- Current annual tax
- $1,500 · $125/mo
- Projected year-2 tax
- $1,500 · $125/mo
- Expected delta
- $0/yr ($0/mo · 0.0%)
ⓘ Screening estimate from a state-policy table — verify with the county assessor before closing.
Climate risk First Street
- Flood 1/10 Low FEMA zone X (unshaded) · 0% chance over 30 yrs
- Wildfire 1/10 Low
- Heat 5/10 Major 7 d/yr ≥107°F today · 21 d/yr by 30 yrs out
- Wind 2/10 Low 100% chance of damaging wind over 30 yrs
- Air quality 2/10 Low 1 unhealthy d/yr today · 3 by 30 yrs out
Nearby sold comps map
Loading sold comps map…
Walkable amenities ~0.75 mi
Loading nearby amenities…
Taxation est. · year 1
- Rental income
- $16,673
- − Mortgage interest
- −$4,196
- − Property taxes
- −$1,500
- − Insurance
- −$374
- − Repairs & maintenance
- −$1,334
- − Management
- −$1,334
- − Depreciation
- −$2,179
- Taxable income
- $5,756
- Est. tax owed @ 24.0%
- −$1,382
- After-tax cash flow
- $5,202/yr
For passive investors: Depreciation is non-cash, so a rental often shows a tax loss while cash-flowing — sheltering income. Rental losses are passive: they offset passive income freely, and up to $25,000/yr can offset ordinary (W-2) income if you actively participate and your MAGI is under $100k (phasing out to $0 by $150k); unused losses carry forward. On sale, claimed depreciation is recaptured at up to 25%, and gains may owe capital-gains tax (a 1031 exchange can defer both). Figures are a year-1 estimate at your 24.0% rate — not tax advice; consult a CPA.
Schools (NCES district)
- District
- University City
- NCES district ID
- 2930660
- Math proficiency
- 15% ▼ -10.00%
- Reading proficiency
- 26% ▼ -7.00%
- Median HH income
- $52,927
- Composite
- 18.57/100
- National rank
- #8910
- State rank
- #297 of 324 in MO
Livability — University City
- Score
- 73/100
- State rank
- #84
- US rank
- #5618
Category grades
Schools grade is shown separately in the Schools card above.
Census & demographics
- Census place
- University City, MO
- County
- Saint Louis County · 888,823 people
- City population
- 28,910
- Metro
- St. Louis, MO-IL
- Population (ZIP)
- 14,283
- Household income
- $87,385
- Rent vs Own
- Severe rent burden
- 644.0
Population outlook (St. Louis County) Hauer SSP2
- Today (2025)
- 1,025,227 people
- By 2030
- 1,028,023 · +0.3%
- By 2040
- 1,020,940 · -0.4%
- By 2050
- 1,007,280 · -1.8%
- By 2075
- 987,277 · -3.7%
- By 2100
- 921,984 · -10.1%
Race, ethnicity, and origin ACS 2023
- Neighborhood character
- Diverse neighborhood (Simpson 0.66)
- Race & ethnicity
- White 49% Black 27% Asian 16% Two or more races 5% Hispanic / Latino 1%
- Common ancestry
- Romanian 5% Scotch-Irish 3% Slovak 2%
- Foreign-born
- 12% · China, Canada, Philippines
- Languages at home
- 82% English-only · Chinese 9% Other Asian/Pacific 3% Other Indo-European 2%
Political lean MEDSL · St. Louis
- 2024 margin
- Strong D (+23.4) · D 60.8% · R 37.4% · Other 1.7%
- 2008→2024 swing
- +3.5pp toward D · 2008: 19.9pp · 2024: 23.4pp
- All cycles
- 2024: D+23.4 2020: D+24.0 2016: D+16.2 2012: D+13.7 2008: D+19.9
Not yet ingested
- Civics
- —
Market trends
- HPI YoY
- ▼ -482.68%
- Current HPI
- 255.4778
- Rent YoY
- ▲ 6.64%
- Metro
- St. Louis, MO-IL
- State GDP YoY
- ▲ 1.84%
- F500 in state
- 20
Industry mix (Fortune 500 HQ in MO)
| Industry | F500 HQs | Revenue |
|---|---|---|
| Healthcare | 1 | $163B |
|
||
| Insurance | 1 | $21B |
|
||
| Industrial Technology | 1 | $17B |
|
||
| Retail | 1 | $16B |
|
||
| Industrial Distribution | 1 | $10B |
|
||
| Utilities | 1 | $9B |
|
||
Price history
3 events — show timeline
- 2026-05-22 Listed $74,900 MARIS as Distributed by MLS Grid
- 2005-09-23 Sold (Public Records) — Public Records
- 1975-10-16 Sold (Public Records) — Public Records
Property tax history
+2.1%/yrLatest (2022): $1,500 · +1.0% YoY. Source: county tax records.
Cash-flow waterfall
monthlySold comps — $/sqft
last 12 mo · ≤1 miLoading sold comps…