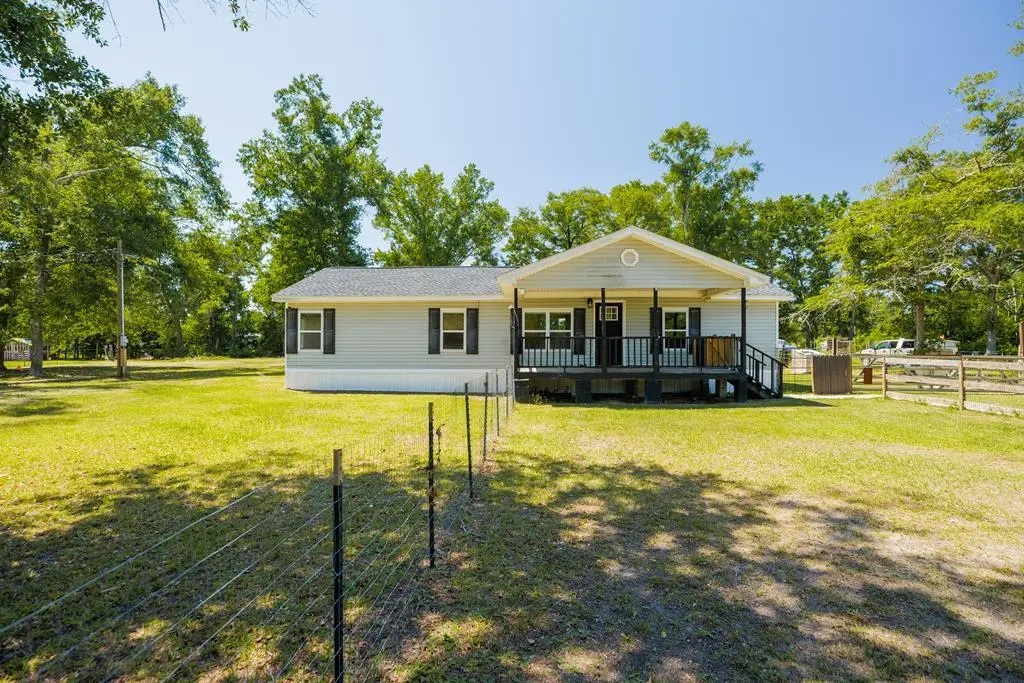
1676 Barker Rd · Ray City, GA
Flood risk 1/10 · Minimal
- FEMA flood zone
- X (unshaded)
- Chance of flooding over 30 yrs
- 0.0%
- Est. flood insurance / yr
- $507 – $1,088
Fire risk 8/10 · Major
- Est. fire insurance / yr
- $963 – $1,789
Heat risk 7/10 · Major
- Hot days now (above 108°F)
- 7 days/yr
- Hot days in 30 yrs
- 19 days/yr
Wind risk 8/10 · Major
- Chance of severe wind over 30 yrs
- 99.0%
Air-quality risk 6/10 · Moderate
- Unhealthy air days now
- 11 days/yr
- Unhealthy air days in 30 yrs
- 12 days/yr
Risk factors via First Street. Map © Google.
Why this score? — see what drove the C+ grade
The composite is a weighted blend of 9 inputs, each scored 0–100. Each bar is that input's sub-score; the figure is the points it added to the 100-point composite (weight × sub-score).
- Cash flow +18.6/30.0
- ARV discount +14.7/15.0
- Appreciation +6.6/10.0
- DSCR +5.9/10.0
- 1% rule +5.0/10.0
- Schools +3.8/10.0
- Livability +3.2/5.0
- Rent growth +2.5/5.0
- Condition / age +2.5/5.0
$154,999
🖨 Deal sheet 📄 Offer letter ✓ Due diligence
Listing remarks MLS
This would be a great rental investment or a great fixer upper starter home. The tile in the home has cracked and will need to be replaced, has a front and back covered patio. The home will be ready to show Monday Oct 3rd
Key facts
- New water heater
- Roof under warranty
- New appliances
Tags
Property features AI
Finance
- Other: Lot approximately 1.06 acres; Zoning: R4
Exterior
- Security: Security system
- Utilities: Private well water; Septic tank sewer
- Home design: Single-story mobile home; Residential property
- Construction: Vinyl siding; Shingle roof; Built as a mobile home
- Exterior features: Covered patio/porch; Fenced yard
Interior
- Kitchen: Dishwasher; Microwave; Refrigerator; Garbage disposal
- Flooring: Vinyl flooring
- Bathrooms: 2 full bathrooms
- Interior features: Security system; Garbage disposal
- Laundry & utility: Washer; Dryer
Neighborhood map
What this means for you Summary
Snapshot
- This is a 3-bed/2.0-bath manufactured listed at $155k.
Deal economics
- At list price, monthly cash flow is $151 ($2k/yr) — positive.
- The deal already cash-flows at list — no discount required.
- To meet the 1% rule (rent ≥ 1% of price), the offer needs to be $155k (0.2% below list).
- Recommended offer: $153k (1.5% below list) — sets the bar for market timing.
- Cap rate 7.5% vs local median 4.0% in Ray City — top-decile yield for the area; either an underpriced asset or a hidden risk that comps aren't pricing in. Stress-test before assuming the spread holds.
Location & tenants
- Location reads 64/100 on livability (#260 in GA) — a middle-class / working-renter tenant base. Strengths: crime A+, cost of living A+, housing A+; Watch: health & safety D, schools F, amenities F.
- Berrien County (rural): math 48% / reading 44% proficiency, ranked #24 of 174 in GA (top 14%) — families likely to look elsewhere, expect single-tenant / working-renter base with shorter leases.
- Market conditions: 37 active listings in the ZIP; 96 units permitted in Berrien County in 2024 (0 in 5+ unit buildings).
Forward outlook
- In year one you build about $6k of equity ($1k loan paydown + $5k appreciation (3.3% local appreciation)).
- Berrien County population projected at -23% by 2050 — secular population decline; favor cash flow + early exit over multi-decade hold.
- At projected returns (3.3% appreciation + 3.0% rent growth), your $43k cash investment doubles in ~5 years — after that, you're playing with house money.
- By year 6, paydown + projected appreciation supports a ~$33k cash-out refi (75% LTV) — recoverable capital for the next deal without selling this one.
Negotiation context
- It's been on market 29 days — a 2% lower offer ($153k) is reasonable based on typical stale-listing flexibility.
- 3 sale attempts since 4y ago with the ask held roughly flat each time — persistent listings suggest the price (not the market) is what's stuck; bring a comps-based counter.
- Current owner paid $50k; list at $155k implies a 210% gain — meaningful room to come down on a strong offer.
Risks & watch-outs
- Climate carrying-cost: severe wind risk, 99% chance of damaging wind over 30y; severe wildfire risk; extreme-heat days projected 7→19/yr by 2055 (HVAC capex compounding) — expect insurance premiums to compound above CPI over the hold.
Questions for the listing agent
- Is there a deadline driving the sale (1031 exchange, divorce, estate, relocation)? That informs how much negotiation room exists.
- Schools are F-rated, which usually means shorter tenancies and higher turnover. Who's the typical renter profile here, and what's been the actual vacancy rate?
- What's the average days-on-market for RENTAL listings here right now (not sales)? A rising rental-DOM trend means longer vacancies and softer asking-rent achievability than the comps imply.
- What's the recent tenant-quality profile in this submarket — average credit score on applications, eviction rate, late-payment / NSF rate, and stable-employment percentage? A property-management company in the area should have these aggregated.
- How much new for-sale + rental construction is in the pipeline within 1–3 miles? Heavy new supply typically softens prices + rents 12–24 months out; constrained supply supports both.
Investment metrics
- 1% rule
- 1.00% ✗
- Cap rate
- 7.46%
- Cash-on-cash
- 4.17%
- DSCR
- 1.19
- GRM
- 8.4
CMA / ARV
- ARV (median comp)
- $184,394
- List price
- $154,999
- Delta
- -15.94%
- Verdict
- UNDERPRICED
- Comps
- 2 within 1.0 mi
Show comp detail 1 sale within ~0.75 mi
| Address | Dist | Beds/Ba | Sqft | Sold | Price | $/sf | Match |
|---|---|---|---|---|---|---|---|
| 3115 Garner Rd | 0.70mi | 3/2.0 | 1,456 (0%) | 8mo | $154,000 | $106 | 61 |
Match score weights: distance 35% · size 25% · config 20% · recency 20%. Top-matched comps best support the ARV.
Projected returns pro-forma
3.27% appreciation · 3.0% rent growth · sell at horizon
- IRR
- 12.1%
- Equity multiple
- 1.70×
- Total profit
- $30,508
- Equity at exit
- $72,050
- IRR
- 14.0%
- Equity multiple
- 3.13×
- Total profit
- $92,495
- Equity at exit
- $112,906
Cash invested: $43,400 (down + closing). Projections, not guarantees.
Landlord ↔ Tenant lean methodology
- Overall (STATE)
- 90 Strongly Landlord-Friendly
- State Georgia
- 90 Strongly Landlord-Friendly · R+3
- County
- — inherits STATE
- City
- — inherits STATE
ZIP-level market 31645
- Home prices YoY
- 1.4%
- Active inventory
- 37
- Price-to-rent
- 8.4×
Monthly cashflow live
- Estimated rent
- $1,547 medium interval (Pro) →
- Mortgage (P&I)
- −$813
- Tax est. 1.5%
- −$194 /mo · $2,325/yr
- Insurance
- −$65
- HOA
- −$0
- Vacancy / Maint / Mgmt
- −$325
- Net cashflow
- $151
Break-even live
UW: 25.0% down · 7.5% · 30yr · 1.5% tax · 5.0% vac · 8.0% maint · 8.0% mgmt
Financing live
Cash to close
- Down payment
- $38,750
- Closing costs
- $4,650
- Reserves months
- —
- Total cash needed
- —
Loan-product check · same deal, 3 products live
Conventional
25% down · 7.5% · 30yr
- Down + closing
- —
- Monthly P&I
- —
- Monthly cashflow
- —
- DSCR
- —
- Eligible?
- —
Personal DTI + credit; lowest rate.
DSCR
20% down · 8.5% · 30yr
- Down + closing
- —
- Monthly P&I
- —
- Monthly cashflow
- —
- DSCR
- —
- Eligible?
- —
No personal income docs; deal must DSCR.
Hard money
10% down · 12.0% · 12mo
- Down + closing
- —
- Monthly P&I
- —
- Monthly cashflow
- —
- DSCR
- —
- Eligible?
- —
Short-term bridge; refi at stabilization.
Listing history 21 events
-
2026-06-17status $154,999 Pending 29 DOM
-
2026-06-17days on market $154,999 Active 29 DOM
-
2026-06-16days on market $154,999 Active 28 DOM
-
2026-06-15days on market $154,999 Active 27 DOM
-
2026-06-14days on market $154,999 Active 25 DOM
-
2026-06-12days on market $154,999 Active 24 DOM
-
2026-06-09days on market $154,999 Active 21 DOM
-
2026-06-08days on market $154,999 Active 20 DOM
-
2026-06-07days on market $154,999 Active 19 DOM
-
2026-06-07pricedays on market $154,999 Active 18 DOM
-
2026-06-03days on market $159,900 Active 15 DOM
-
2026-06-02days on market $159,900 Active 14 DOM
-
2026-06-01days on market $159,900 Active 13 DOM
-
2026-05-31days on market $159,900 Active 12 DOM
-
2026-05-30days on market $159,900 Active 11 DOM
-
2026-05-18status Pending 1059-char remark
-
2026-05-15$159,900 Active 1059-char remark
-
2022-12-01soldstatus $50,000
-
2022-11-30soldstatus $50,000
Show marketing remark (221 chars)
This would be a great rental investment or a great fixer upper starter home. The tile in the home has cracked and will need to be replaced, has a front and back covered patio. The home will be ready to show Monday Oct 3rd
-
2022-09-28$69,900
Show marketing remark (221 chars)
This would be a great rental investment or a great fixer upper starter home. The tile in the home has cracked and will need to be replaced, has a front and back covered patio. The home will be ready to show Monday Oct 3rd
-
2013-09-20soldstatus $39,900
ⓘ Source: listings_history table (triggers on properties + properties_extension) + one-shot
backfill from property_details.listing_events for pre-trigger history.
Climate risk First Street
- Flood 1/10 Low FEMA zone X (unshaded) · 0% chance over 30 yrs
- Wildfire 8/10 Severe
- Heat 7/10 Severe 7 d/yr ≥108°F today · 19 d/yr by 30 yrs out
- Wind 8/10 Severe 99% chance of damaging wind over 30 yrs
- Air quality 6/10 Major 11 unhealthy d/yr today · 12 by 30 yrs out
Nearby sold comps map
Loading sold comps map…
Walkable amenities ~0.75 mi
Loading nearby amenities…
Taxation est. · year 1
- Rental income
- $18,560
- − Mortgage interest
- −$8,682
- − Property taxes
- −$2,325
- − Insurance
- −$775
- − Repairs & maintenance
- −$1,485
- − Management
- −$1,485
- − Depreciation
- −$4,509
- Taxable loss
- −$701
- Est. tax savings @ 24.0%
- +$168
- After-tax cash flow
- $1,977/yr
For passive investors: Depreciation is non-cash, so a rental often shows a tax loss while cash-flowing — sheltering income. Rental losses are passive: they offset passive income freely, and up to $25,000/yr can offset ordinary (W-2) income if you actively participate and your MAGI is under $100k (phasing out to $0 by $150k); unused losses carry forward. On sale, claimed depreciation is recaptured at up to 25%, and gains may owe capital-gains tax (a 1031 exchange can defer both). Figures are a year-1 estimate at your 24.0% rate — not tax advice; consult a CPA.
Schools (NCES district)
- District
- Berrien County
- NCES district ID
- 1300390
- Math proficiency
- 48% ▲ 1.00%
- Reading proficiency
- 44% ▼ -3.00%
- Median HH income
- $33,858
- Composite
- 37.95/100
- National rank
- #4302
- State rank
- #24 of 174 in GA
Livability — Ray City
- Score
- 64/100
- State rank
- #260
- US rank
- #14250
Category grades
Schools grade is shown separately in the Schools card above.
Census & demographics
- Population (ZIP)
- 4,971
Population outlook (Berrien County) Hauer SSP2
- Today (2025)
- 17,982 people
- By 2030
- 17,282 · -3.9%
- By 2040
- 15,676 · -12.8%
- By 2050
- 13,876 · -22.8%
- By 2075
- 9,689 · -46.1%
- By 2100
- 6,430 · -64.2%
Race, ethnicity, and origin ACS 2023
- Neighborhood character
- Predominantly White (74%)
- Race & ethnicity
- White 74% Black 11% Hispanic / Latino 10% Two or more races 5% Asian 1%
- Hispanic origin (detail)
- Mexican 3% Puerto Rican 3%
- Common ancestry
- Slovak 2% Iranian 1% Lithuanian 1%
- Foreign-born
- 2% · Canada
- Languages at home
- 92% English-only · Spanish 8%
Political lean MEDSL · Berrien
- 2024 margin
- Solid R (+69.8) · D 15.0% · R 84.8%
- 2008→2024 swing
- -16.6pp toward R · 2008: -53.2pp · 2024: -69.8pp
- All cycles
- 2024: R+69.8 2020: R+66.5 2016: R+66.5 2012: R+57.7 2008: R+53.2
Not yet ingested
- Civics
- —
Market trends
- HPI YoY
- ▲ 3.27%
- Current HPI
- 233.1015
- Rent YoY
- —
- Metro
- —
- State GDP YoY
- ▲ 2.66%
- F500 in state
- 28
Industry mix (Fortune 500 HQ in GA)
| Industry | F500 HQs | Revenue |
|---|---|---|
| Paper / Packaging | 2 | $29B |
|
||
| Retail | 1 | $160B |
|
||
| Transportation / Logistics | 1 | $91B |
|
||
| Airlines | 1 | $62B |
|
||
| Consumer Goods | 1 | $47B |
|
||
| Utilities | 1 | $25B |
|
||
Price history
+288.5% since first listed9 events — show timeline
- 2026-06-17 Pending — SGMLS
- 2026-06-04 Price Changed $154,999 SGMLS
- 2026-05-22 Relisted — SGMLS
- 2026-05-18 Pending — SGMLS
- 2026-05-15 Listed $159,900 SGMLS
- 2022-12-01 Sold (Public Records) $50,000 Public Records
- 2022-11-30 Sold (MLS) $50,000 SGMLS
- 2022-09-28 Listed $69,900 SGMLS
- 2013-09-20 Sold (Public Records) $39,900 Public Records
Property tax history
-7.0%/yrLatest (2025): $62 · -51.7% YoY. Source: county tax records.
Cash-flow waterfall
monthlySold comps — $/sqft
last 12 mo · ≤1 miLoading sold comps…