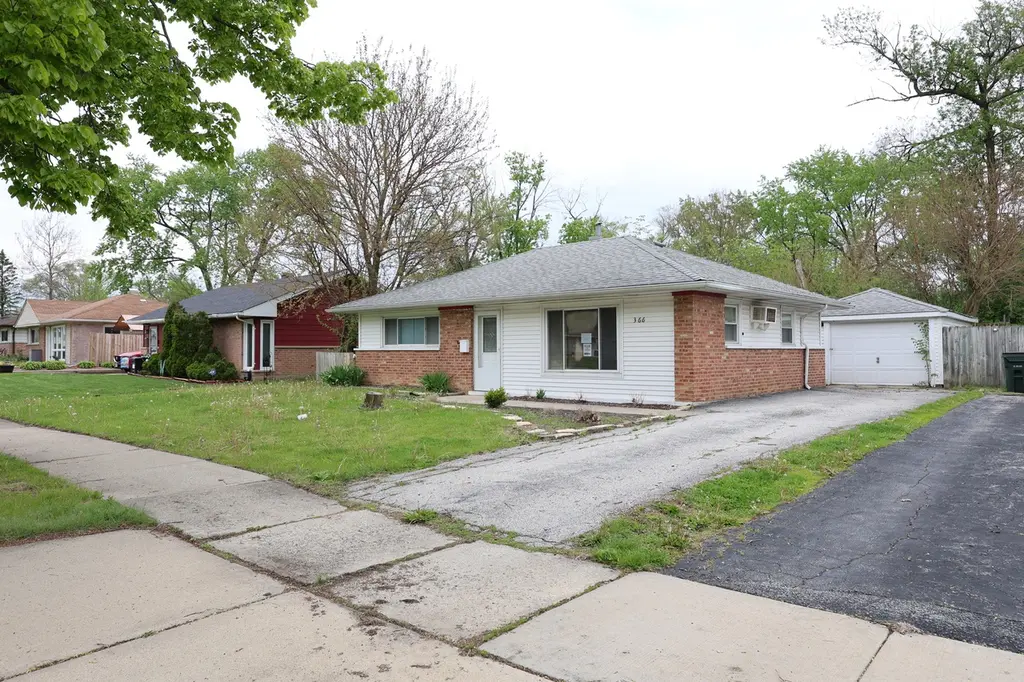
366 Blackhawk Dr · Park Forest, IL
Flood risk 1/10 · Minimal
- FEMA flood zone
- X (unshaded)
- Chance of flooding over 30 yrs
- 0.0%
- Est. flood insurance / yr
- $473 – $860
Fire risk 1/10 · Minimal
- Est. fire insurance / yr
- $804 – $1,492
Heat risk 3/10 · Minor
- Hot days now (above 101°F)
- 7 days/yr
- Hot days in 30 yrs
- 16 days/yr
Wind risk 2/10 · Minimal
- Chance of severe wind over 30 yrs
- —
Air-quality risk 2/10 · Minimal
- Unhealthy air days now
- 1 days/yr
- Unhealthy air days in 30 yrs
- 1 days/yr
Risk factors via First Street. Map © Google.
Why this score? — see what drove the B grade
The composite is a weighted blend of 9 inputs, each scored 0–100. Each bar is that input's sub-score; the figure is the points it added to the 100-point composite (weight × sub-score).
- Cash flow +30.0/30.0
- ARV discount +13.3/15.0
- 1% rule +10.0/10.0
- DSCR +10.0/10.0
- Livability +3.9/5.0
- Rent growth +2.5/5.0
- Condition / age +2.5/5.0
- Schools +0.9/10.0
- Appreciation +0.0/10.0
$115,000
🖨 Deal sheet 📄 Offer letter ✓ Due diligence
Listing remarks
Charming 2-bedroom, 1-bath ranch home awaiting its new owners! This inviting home offers comfortable single-level living with a functional floor plan, spacious living area, and plenty of natural light throughout. The kitchen provides ample cabinet space and room for everyday dining. Both bedrooms are generously sized, and the full bath is conveniently located. Outside, enjoy a yard with plenty of space for outdoor activities, gardening, or future enhancements. Whether you're a first-time homebuyer, downsizing, or looking for an investment opportunity, this home offers great potential. Conveniently located near shopping, dining, schools, and major transportation routes. Don't miss your chanc
Key facts
- Ample cabinet space
- Single-level living
- 7,200 sq ft lot
Tags
Property features AI
Finance
- Other: Parcel number 31352050050000; Located within Park Forest (Rich Township); Directions: Sauk Trail, south on Blackhawk
- Financial info: Special service area: No
- HOA & community: No master association fee required
Exterior
- Parking: Detached owned garage (1 garage space, 1 total parking space)
- Utilities: Public water; Public sewer
- Home design: Detached single-family home; One-story; Fee simple ownership; Rehab completed in 2023; Built before 1978 (71–80 years old)
- Construction: Vinyl siding and brick construction
- Exterior features: Vinyl siding and brick exterior; Lot dimensions approximately 60 x 120
Interior
- Kitchen: Kitchen on the main level
- Bedrooms: Two bedrooms (both on the main level); Master bedroom on the main level
- Bathrooms: One full bathroom
- Heating & cooling: Natural gas heating; Wall unit cooling
- Interior features: Four total rooms; School bus service available
- Laundry & utility: Main-level laundry room
Neighborhood map
What this means for you Summary
Snapshot
- This is a 2-bed/1.0-bath single-family listed at $115k.
Deal economics
- At list price, monthly cash flow is $568 ($7k/yr) — positive.
- The deal already cash-flows at list — no discount required.
- Meets the 1% rule at list price ($2k rent vs $115k).
- Cap rate 12.2% vs local median 9.7% in Park Forest — meaningfully above typical; check what's discounted (condition, days-on-market, listing class) to confirm the premium yield is real.
Location & tenants
- Location reads 78/100 on livability (#148 in IL, #2,726 nationally) — a middle-class / working-renter tenant base. Strengths: commute A+, cost of living A+, housing A+; Watch: schools D+, amenities F.
- Rich Twp Hsd 227 (suburban): math 5% / reading 12% proficiency, ranked #577 of 620 in IL (top 93%) — low school quality limits family demand, transient renter base, plan for 1-2y turnover.
- Market conditions: 102 active listings in the ZIP; 19 comparable units currently listed for rent nearby; rentals leasing fast (median 7d on market — plan ~1-2 weeks tenant-placement turnaround); 6,272 units permitted in Cook County in 2024 (4,658 in 5+ unit buildings).
- This rent runs 34% of the median local income ($62k/yr) — at the standard rent-burdened threshold; future hikes will face affordability resistance.
Forward outlook
- Local home prices are declining (-3.0%/yr); year-one equity from $795 of loan paydown is wiped out by about $3k of value loss. Plan a longer hold.
- At projected returns (-3.0% appreciation + 3.0% rent growth), your $32k cash investment doubles in ~6 years — after that, you're playing with house money.
Negotiation context
- Only 14 days on market — expect competitive offers; lowballing is unlikely to land.
- 9 sale attempts since 19y ago with the ask held roughly flat each time — persistent listings suggest the price (not the market) is what's stuck; bring a comps-based counter.
Risks & watch-outs
- Watch-outs: built in 1952 — expect roof / HVAC / electrical / plumbing capex.
Questions for the listing agent
- Built in 1952 — when were the roof, HVAC, electrical panel, plumbing, and water heater last replaced?
- Is there a deadline driving the sale (1031 exchange, divorce, estate, relocation)? That informs how much negotiation room exists.
- Schools are D-rated, which usually means shorter tenancies and higher turnover. Who's the typical renter profile here, and what's been the actual vacancy rate?
- What's the average days-on-market for RENTAL listings here right now (not sales)? A rising rental-DOM trend means longer vacancies and softer asking-rent achievability than the comps imply.
- What's the recent tenant-quality profile in this submarket — average credit score on applications, eviction rate, late-payment / NSF rate, and stable-employment percentage? A property-management company in the area should have these aggregated.
- How much new for-sale + rental construction is in the pipeline within 1–3 miles? Heavy new supply typically softens prices + rents 12–24 months out; constrained supply supports both.
Investment metrics
- 1% rule
- 1.50% ✓
- Cap rate
- 12.22%
- Cash-on-cash
- 21.17%
- DSCR
- 1.94
- GRM
- 5.6
CMA / ARV
- ARV (on-the-fly)
- $131,911
- Comps found
- 12
Show comp detail 12 sales within ~0.75 mi
| Address | Dist | Beds/Ba | Sqft | Sold | Price | $/sf | Match |
|---|---|---|---|---|---|---|---|
| 353 Miami St | 0.09mi | 2/1.0 | 949 (0%) | 4mo | $112,000 | $118 | 93 |
| 354 Marquette St | 0.15mi | 2/1.0 | 973 (+2%) | 2mo | $131,000 | $135 | 88 |
| 316 Mohawk St | 0.29mi | 2/1.0 | 949 (0%) | 2mo | $141,000 | $149 | 85 |
| 318 Minocqua St | 0.28mi | 2/1.0 | 974 (+3%) | 1mo | $145,000 | $149 | 82 |
| 314 Seminole St | 0.56mi | 2/1.0 | 949 (0%) | 1mo | $135,000 | $142 | 73 |
| 314 Windsor St | 0.28mi | 3/1.0 (+1) | 1,014 (+7%) | 2mo | $141,000 | $139 | 68 |
| 21945 Millard Ave | 0.57mi | 2/1.0 | 980 (+3%) | 3mo | $153,000 | $156 | 66 |
| 254 Blackhawk Dr | 0.53mi | 2/1.0 | 1,000 (+5%) | 2mo | $105,000 | $105 | 65 |
| 209 Miami St | 0.75mi | 2/1.0 | 974 (+3%) | 1mo | $108,000 | $111 | 60 |
| 306 Winnebago St | 0.51mi | 3/2.0 (+1) | 1,088 (+15%) | 3mo | $105,000 | $97 | 41 |
| 208 Miami St | 0.74mi | 3/1.5 (+1) | 1,053 (+11%) | 2mo | $175,000 | $166 | 39 |
| 356 Winnebago St | 0.64mi | 3/2.0 (+1) | 1,088 (+15%) | 1mo | $150,000 | $138 | 36 |
Match score weights: distance 35% · size 25% · config 20% · recency 20%. Top-matched comps best support the ARV.
Projected returns pro-forma
-3.0% appreciation · 3.0% rent growth · sell at horizon
- IRR
- 13.7%
- Equity multiple
- 1.55×
- Total profit
- $17,564
- Equity at exit
- $17,147
- IRR
- 22.5%
- Equity multiple
- 2.92×
- Total profit
- $61,980
- Equity at exit
- $9,943
Cash invested: $32,200 (down + closing). Projections, not guarantees.
Landlord ↔ Tenant lean methodology
- Overall (STATE)
- 43 Moderately Tenant-Leaning
- State Illinois
- 43 Moderately Tenant-Leaning · D+7
- County
- — inherits STATE
- City
- — inherits STATE
ZIP-level market 60466
- Home prices YoY
- -21.1%
- Active inventory
- 102
- Price-to-rent
- 5.6×
Monthly cashflow live
- Estimated rent
- $1,725 high interval (Pro) →
- Mortgage (P&I)
- −$603
- Tax est. 1.5%
- −$144 /mo · $1,725/yr
- Insurance
- −$48
- HOA
- −$0
- Vacancy / Maint / Mgmt
- −$362
- Net cashflow
- $568
Break-even live
UW: 25.0% down · 7.5% · 30yr · 1.5% tax · 5.0% vac · 8.0% maint · 8.0% mgmt
Financing live
Cash to close
- Down payment
- $28,750
- Closing costs
- $3,450
- Reserves months
- —
- Total cash needed
- —
Loan-product check · same deal, 3 products live
Conventional
25% down · 7.5% · 30yr
- Down + closing
- —
- Monthly P&I
- —
- Monthly cashflow
- —
- DSCR
- —
- Eligible?
- —
Personal DTI + credit; lowest rate.
DSCR
20% down · 8.5% · 30yr
- Down + closing
- —
- Monthly P&I
- —
- Monthly cashflow
- —
- DSCR
- —
- Eligible?
- —
No personal income docs; deal must DSCR.
Hard money
10% down · 12.0% · 12mo
- Down + closing
- —
- Monthly P&I
- —
- Monthly cashflow
- —
- DSCR
- —
- Eligible?
- —
Short-term bridge; refi at stabilization.
Rent comps 19 comps
| Address | Beds | Baths | Sqft | Rent | $/sqft | DOM | Units | Dist |
|---|---|---|---|---|---|---|---|---|
| 3905 Tower Dr Richton Park, IL | 1.0–2.0 | 1.0–2.0 | 905 | $1,795 | $1.98 | 1d | 19 | 0.60mi |
| 4014 Euclid Ln Richton Park, IL | 3.0 | 1.0 | 1100 | $2,100 | $1.91 | 12d | 1 | 0.68mi |
| 4014 Euclid Ln Richton Park, IL | 2.0 | 1.0 | 1100 | $2,100 | $1.91 | 7d | 1 | 0.68mi |
| 4014 Euclid Ln Richton Park, IL | 2.0 | 1.0 | 1100 | $2,100 | $1.91 | 21d | 1 | 0.68mi |
| 411 Huron St Park Forest, IL | 3.0 | 1.0 | 1092 | $2,300 | $2.11 | 24d | 1 | 0.78mi |
| 277 Somonauk St Park Forest, IL | 3.0 | 1.0 | 966 | $2,000 | $2.07 | 3d | 1 | 0.79mi |
| 22501 Butterfield Rd Unit 22411-506 Richton Park, IL | 2.0 | 1.0 | 882 | $1,325 | $1.50 | 7d | 1 | 0.89mi |
| 22501 Butterfield Rd Unit 22415-207 Richton Park, IL | 2.0 | 1.5 | 944 | $1,360 | $1.44 | 7d | 1 | 0.89mi |
| 22501 Butterfield Rd Unit 22411-514 Richton Park, IL | 2.0 | 1.5 | 1021 | $1,365 | $1.34 | 7d | 1 | 0.89mi |
| 22501 Butterfield Rd Unit 22407-202 Richton Park, IL | 1.0 | 1.0 | 667 | $1,210 | $1.81 | 7d | 1 | 0.89mi |
| 22501 Butterfield Rd Unit 22400-311 Richton Park, IL | 2.0 | 1.0 | 882 | $1,360 | $1.54 | 7d | 1 | 0.89mi |
| 22501 Butterfield Rd Unit 22419-109 Richton Park, IL | 2.0 | 1.0 | 798 | $1,310 | $1.64 | 7d | 1 | 0.89mi |
| 22501 Butterfield Rd Unit 22407-104 Richton Park, IL | 1.0 | 1.0 | 621 | $1,195 | $1.92 | 7d | 1 | 0.89mi |
| 22501 Butterfield Rd Unit 22411-304 Richton Park, IL | 1.0 | 1.0 | 688 | $1,215 | $1.77 | 7d | 1 | 0.89mi |
| 235 Tampa St Park Forest, IL | 3.0 | 1.0 | 1092 | $2,000 | $1.83 | 24d | 1 | 1.19mi |
| 194 Monee Rd Park Forest, IL | 3.0 | 1.0 | 1092 | $1,971 | $1.80 | 21d | 1 | 1.22mi |
| 4020 216th St Unit 2E Matteson, IL | 3.0 | 1.0 | 600 | $2,000 | $3.33 | 24d | 1 | 1.26mi |
| 3484 Western Ave Unit 3484-B Park Forest, IL | 1.0 | 1.0 | 600 | $1,300 | $2.17 | 1d | 1 | 1.38mi |
| 3324 Western Ave Park Forest, IL | 1.0–3.0 | 1.0 | 1026 | $1,680 | $1.64 | 1d | 11 | 1.38mi |
Listing history 9 events
-
2026-06-18days on market $115,000 Active 14 DOM
-
2026-06-17days on market $115,000 Active 13 DOM
-
2026-06-16days on market $115,000 Active 12 DOM
-
2026-06-15days on market $115,000 Active 11 DOM
-
2026-06-13days on market $115,000 Active 9 DOM
-
2026-06-09days on market $115,000 Active 5 DOM
-
2026-06-08days on market $115,000 Active 4 DOM
-
2026-06-07remarks 699-char remark
-
2026-06-07$115,000 Active 3 DOM
ⓘ Source: listings_history table (triggers on properties + properties_extension) + one-shot
backfill from property_details.listing_events for pre-trigger history.
Climate risk First Street
- Flood 1/10 Low FEMA zone X (unshaded) · 0% chance over 30 yrs
- Wildfire 1/10 Low
- Heat 3/10 Moderate 7 d/yr ≥101°F today · 16 d/yr by 30 yrs out
- Wind 2/10 Low
- Air quality 2/10 Low 1 unhealthy d/yr today · 1 by 30 yrs out
Nearby sold comps map
Loading sold comps map…
Walkable amenities ~0.75 mi
Loading nearby amenities…
Taxation est. · year 1
- Rental income
- $20,699
- − Mortgage interest
- −$6,442
- − Property taxes
- −$1,725
- − Insurance
- −$575
- − Repairs & maintenance
- −$1,656
- − Management
- −$1,656
- − Depreciation
- −$3,345
- Taxable income
- $5,300
- Est. tax owed @ 24.0%
- −$1,272
- After-tax cash flow
- $5,543/yr
For passive investors: Depreciation is non-cash, so a rental often shows a tax loss while cash-flowing — sheltering income. Rental losses are passive: they offset passive income freely, and up to $25,000/yr can offset ordinary (W-2) income if you actively participate and your MAGI is under $100k (phasing out to $0 by $150k); unused losses carry forward. On sale, claimed depreciation is recaptured at up to 25%, and gains may owe capital-gains tax (a 1031 exchange can defer both). Figures are a year-1 estimate at your 24.0% rate — not tax advice; consult a CPA.
Schools (NCES district)
- District
- Rich Twp Hsd 227
- NCES district ID
- 1733420
- Math proficiency
- 5% ▼ -3.00%
- Reading proficiency
- 12% ▬ 0.00%
- Median HH income
- $56,056
- Composite
- 8.93/100
- National rank
- #9885
- State rank
- #577 of 620 in IL
Livability — Park Forest
- Score
- 78/100
- State rank
- #148
- US rank
- #2726
Category grades
Schools grade is shown separately in the Schools card above.
Census & demographics
- Census place
- Park Forest, IL
- County
- Cook County · 4,486,803 people
- City population
- 21,461
- Metro
- Chicago-Naperville-Elgin, IL-IN-WI
- Population (ZIP)
- 21,461
- Household income
- $61,654
- Rent vs Own
- Severe rent burden
- 900.0
Population outlook (Cook County) Hauer SSP2
- Today (2025)
- 5,347,519 people
- By 2030
- 5,357,703 · +0.2%
- By 2040
- 5,324,924 · -0.4%
- By 2050
- 5,230,762 · -2.2%
- By 2075
- 4,785,735 · -10.5%
- By 2100
- 4,188,836 · -21.7%
Race, ethnicity, and origin ACS 2023
- Neighborhood character
- Predominantly Black (69%)
- Race & ethnicity
- Black 69% White 19% Hispanic / Latino 9% Two or more races 3% Native American 1%
- Hispanic origin (detail)
- Mexican 8%
- Common ancestry
- Romanian 2% Iranian 1% Italian 1%
- Foreign-born
- 6% · Canada
- Languages at home
- 90% English-only · Spanish 7% French/Haitian/Cajun 1% Russian/Polish/Slavic 1%
Political lean MEDSL · Cook
- 2024 margin
- Solid D (+42.0) · D 70.4% · R 28.4% · Other 1.2%
- 2008→2024 swing
- -11.4pp toward R · 2008: 53.4pp · 2024: 42.0pp
- All cycles
- 2024: D+42.0 2020: D+50.3 2016: D+53.0 2012: D+49.4 2008: D+53.4
Not yet ingested
- Civics
- —
Market trends
- HPI YoY
- ▼ -58.87%
- Current HPI
- 219.9692
- Rent YoY
- —
- Metro
- Chicago-Naperville-Elgin, IL-IN-WI
- State GDP YoY
- ▲ 1.59%
- F500 in state
- 60
Industry mix (Fortune 500 HQ in IL)
| Industry | F500 HQs | Revenue |
|---|---|---|
| Insurance | 4 | $201B |
|
||
| Consumer Goods | 4 | $87B |
|
||
| Industrial Machinery | 3 | $64B |
|
||
| Healthcare | 2 | $55B |
|
||
| Retail / Pharmacy | 1 | $148B |
|
||
| Agriculture / Food | 1 | $86B |
|
||
Price history
+170.6% since first listed23 events — show timeline
- 2026-06-04 Listed $115,000 MRED as Distributed by MLS Grid
- 2025-10-06 Listing Removed — MRED as Distributed by MLS Grid
- 2025-08-25 Relisted — MRED as Distributed by MLS Grid
- 2025-04-25 Listing Removed — MRED as Distributed by MLS Grid
- 2025-02-27 Listed — MRED as Distributed by MLS Grid
- 2024-05-23 Listing Removed — MRED as Distributed by MLS Grid
- 2024-05-22 Relisted — MRED as Distributed by MLS Grid
- 2024-05-19 Listing Removed — MRED as Distributed by MLS Grid
- 2024-04-29 Listed — MRED as Distributed by MLS Grid
- 2023-04-03 Sold (MLS) $105,000 MRED as Distributed by MLS Grid
- 2023-03-04 Contingent — MRED as Distributed by MLS Grid
- 2023-02-28 Listed $109,900 MRED as Distributed by MLS Grid
- 2022-11-10 Listing Removed — MRED as Distributed by MLS Grid
- 2022-07-14 Listed — MRED as Distributed by MLS Grid
- 2008-11-21 Listing Removed — MRED as Distributed by MLS Grid
- 2008-11-20 Sold (MLS) $22,750 MRED as Distributed by MLS Grid
- 2008-10-30 Contingent — MRED as Distributed by MLS Grid
- 2008-10-03 Listed $76,900 MRED as Distributed by MLS Grid
- 2008-07-06 Listing Removed — MRED as Distributed by MLS Grid
- 2007-07-05 Listed — MRED as Distributed by MLS Grid
- 2003-08-14 Sold (Public Records) $76,500 Public Records
- 1995-09-18 Sold (Public Records) $66,000 Public Records
- 1988-08-10 Sold (Public Records) $42,500 Public Records
Property tax history
+3.5%/yrLatest (2023): $7,320 · +55.8% YoY. Source: county tax records.
Cash-flow waterfall
monthlySold comps — $/sqft
last 12 mo · ≤1 miLoading sold comps…