 🏷️ Likely Rental
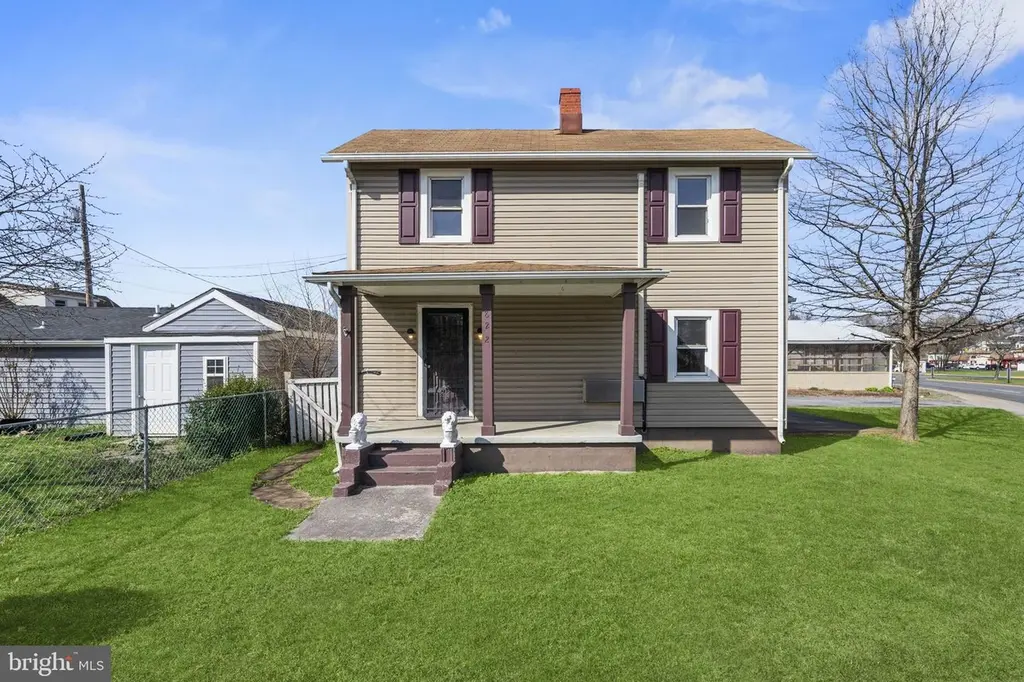
822 N Commerce Ave · Front Royal, VA
Flood risk No data
- FEMA flood zone
- —
- Chance of flooding over 30 yrs
- —
- Est. flood insurance / yr
- —
Fire risk No data
- Est. fire insurance / yr
- —
Heat risk No data
- Hot days now (above threshold)
- —
- Hot days in 30 yrs
- —
Wind risk No data
- Chance of severe wind over 30 yrs
- —
Air-quality risk No data
- Unhealthy air days now
- —
- Unhealthy air days in 30 yrs
- —
Risk factors via First Street. Map © Google.
Why this score? — see what drove the C- grade
The composite is a weighted blend of 9 inputs, each scored 0–100. Each bar is that input's sub-score; the figure is the points it added to the 100-point composite (weight × sub-score).
- ARV discount +15.0/15.0
- Cash flow +13.6/30.0
- Schools +4.9/10.0
- Rent growth +4.6/5.0
- DSCR +4.1/10.0
- Livability +3.7/5.0
- 1% rule +2.7/10.0
- Condition / age +2.5/5.0
- Appreciation +0.0/10.0
$199,900
🖨 Deal sheet 📄 Offer letter ✓ Due diligence
Listing remarks MLS
INVESTOR purchase only. Current tenant and lease in place, and has to convey to the new owner. Text agent for details. Convenient living in the town of Front Royal. Enjoy the cooler summers and mountain adventures close to home. The outdoors awaits with streams, hiking, camping, and Skyline Caverns, just moments away. Easy walk to the Old Town area of Front Royal. The home is currently rented with an active lease (including lawn service). Contact us ASAP for a private appointment to view 822 N Commerce Ave, Front Royal, VA 22630 * Note: some of the photos were digitally staged for your inspiration.
Key facts
- 2,696 sq ft lot
- 2 parking spots
- Built 1960
Neighborhood map
What this means for you Summary
Snapshot
- This is a 2-bed/1.0-bath single-family listed at $200k.
Deal economics
- At list price, monthly cash flow is $11 ($137/yr) — positive.
- The deal already cash-flows at list — no discount required.
- To meet the 1% rule (rent ≥ 1% of price), the offer needs to be $154k (22.7% below list).
- Recommended offer: $154k (22.7% below list) — sets the bar for 1% rule.
- Cap rate 6.4% vs local median 3.6% in Front Royal — top-decile yield for the area; either an underpriced asset or a hidden risk that comps aren't pricing in. Stress-test before assuming the spread holds.
Location & tenants
- Location reads 73/100 on livability (#162 in VA) — a middle-class / working-renter tenant base. Strengths: health & safety A+, housing A, cost of living B+; Watch: commute F, employment D-.
- Warren County Public School District (town): math 49% / reading 64% proficiency, ranked #70 of 131 in VA (top 53%) — acceptable for families but not a draw, mixed tenant base, ~2y average lease.
- Market conditions: Rents rising fast (+8.3%/yr); 280 active listings in the ZIP; 13 comparable units currently listed for rent nearby; rentals at typical pace (median 24d on market — plan ~3-4 weeks tenant-placement turnaround); solid renter incomes; 170 units permitted in Warren County in 2024 (0 in 5+ unit buildings).
Forward outlook
- Local home prices are declining (-3.0%/yr); year-one equity from $1k of loan paydown is wiped out by about $6k of value loss. Plan a longer hold.
- Warren County population projected at +8% by 2050 — modest demand growth; plan on rents tracking national, not racing it.
Negotiation context
- It's been on market 28 days — a 2% lower offer ($197k) is reasonable based on typical stale-listing flexibility.
- 3 sale attempts since 2y ago with the ask held roughly flat each time — persistent listings suggest the price (not the market) is what's stuck; bring a comps-based counter.
Questions for the listing agent
- Built in 1960 — when were the roof, HVAC, electrical panel, plumbing, and water heater last replaced?
- Is there a deadline driving the sale (1031 exchange, divorce, estate, relocation)? That informs how much negotiation room exists.
- Schools are B-rated — typically a magnet for longer-tenancy family renters. What's the average tenant stay here, and is there a school-zone premium baked into asking?
- What's the average days-on-market for RENTAL listings here right now (not sales)? A rising rental-DOM trend means longer vacancies and softer asking-rent achievability than the comps imply.
- What's the recent tenant-quality profile in this submarket — average credit score on applications, eviction rate, late-payment / NSF rate, and stable-employment percentage? A property-management company in the area should have these aggregated.
- How much new for-sale + rental construction is in the pipeline within 1–3 miles? Heavy new supply typically softens prices + rents 12–24 months out; constrained supply supports both.
Investment metrics
- 1% rule
- 0.77% ✗
- Cap rate
- 6.36%
- Cash-on-cash
- 0.24%
- DSCR
- 1.01
- GRM
- 10.8
CMA / ARV
- ARV (median comp)
- $271,857
- List price
- $199,900
- Delta
- -26.47%
- Verdict
- UNDERPRICED
- Comps
- 20 within 1.0 mi
Show comp detail 10 sales within ~0.75 mi
| Address | Dist | Beds/Ba | Sqft | Sold | Price | $/sf | Match |
|---|---|---|---|---|---|---|---|
| 215 E 5th St | 0.33mi | 2/1.0 | 960 (+1%) | 7mo | $269,000 | $280 | 76 |
| 122 W 9th St | 0.25mi | 3/1.5 (+1) | 925 (-2%) | 10mo | $290,000 | $314 | 69 |
| 514 Manassas Ave | 0.46mi | 2/1.0 | 880 (-7%) | 4mo | $264,900 | $301 | 63 |
| 621 New Ave | 0.31mi | 3/1.0 (+1) | 1,040 (+10%) | 11mo | $315,000 | $303 | 55 |
| 527 Frederick Ave | 0.63mi | 3/1.0 (+1) | 960 (+1%) | 13mo | $295,000 | $307 | 52 |
| 101 W 17th St | 0.63mi | 3/1.0 (+1) | 1,025 (+8%) | 2mo | $325,000 | $317 | 50 |
| 517 Frederick Ave | 0.63mi | 3/2.0 (+1) | 960 (+1%) | 14mo | $335,000 | $349 | 48 |
| 27 Fairview Ave | 0.27mi | 3/1.0 (+1) | 1,075 (+13%) | 20mo | $334,000 | $311 | 43 |
| 502 Manassas Ave | 0.48mi | 2/2.0 | 1,012 (+7%) | 23mo | $315,900 | $312 | 43 |
| 222 Washington Ave | 0.71mi | 3/1.0 (+1) | 1,090 (+15%) | 10mo | $262,000 | $240 | 28 |
Match score weights: distance 35% · size 25% · config 20% · recency 20%. Top-matched comps best support the ARV.
Projected returns pro-forma
-3.0% appreciation · 8.0% rent growth · sell at horizon
- IRR
- -11.1%
- Equity multiple
- 0.58×
- Total profit
- $-23,585
- Equity at exit
- $29,806
- IRR
- 3.5%
- Equity multiple
- 1.31×
- Total profit
- $17,221
- Equity at exit
- $17,284
Cash invested: $55,972 (down + closing). Projections, not guarantees.
Landlord ↔ Tenant lean methodology
- Overall (STATE)
- 55 Moderately Landlord-Leaning
- State Virginia
- 55 Moderately Landlord-Leaning · D+2
- County
- — inherits STATE
- City
- — inherits STATE
ZIP-level market 22630
- Home prices YoY
- -27.1%
- Rents YoY
- 8.3%
- Active inventory
- 280
- Price-to-rent
- 10.8×
Monthly cashflow live
- Estimated rent
- $1,545 high interval (Pro) →
- Mortgage (P&I)
- −$1,048
- Tax from tax record
- −$78 /mo · $931/yr
- Insurance
- −$83
- HOA
- −$0
- Vacancy / Maint / Mgmt
- −$324
- Net cashflow
- $11
Break-even live
UW: 25.0% down · 7.5% · 30yr · 1.5% tax · 5.0% vac · 8.0% maint · 8.0% mgmt
Financing live
Cash to close
- Down payment
- $49,975
- Closing costs
- $5,997
- Reserves months
- —
- Total cash needed
- —
Loan-product check · same deal, 3 products live
Conventional
25% down · 7.5% · 30yr
- Down + closing
- —
- Monthly P&I
- —
- Monthly cashflow
- —
- DSCR
- —
- Eligible?
- —
Personal DTI + credit; lowest rate.
DSCR
20% down · 8.5% · 30yr
- Down + closing
- —
- Monthly P&I
- —
- Monthly cashflow
- —
- DSCR
- —
- Eligible?
- —
No personal income docs; deal must DSCR.
Hard money
10% down · 12.0% · 12mo
- Down + closing
- —
- Monthly P&I
- —
- Monthly cashflow
- —
- DSCR
- —
- Eligible?
- —
Short-term bridge; refi at stabilization.
Rent comps 13 comps
| Address | Beds | Baths | Sqft | Rent | $/sqft | DOM | Units | Dist |
|---|---|---|---|---|---|---|---|---|
| 1127 N Royal Ave Unit B Front Royal, VA | 2.0 | 2.0 | 900 | $1,500 | $1.67 | 24d | 1 | 0.24mi |
| 1127 N Royal Ave Unit B Front Royal, VA | 2.0 | 2.0 | 900 | $1,500 | $1.67 | 11d | 1 | 0.24mi |
| 343 Kendrick Ln Front Royal, VA | 2.0 | 1.0 | 730 | $1,250 | $1.71 | 3d | 1 | 0.50mi |
| 343 Kendrick Ln Front Royal, VA | 2.0 | 1.0 | 730 | $1,250 | $1.71 | 43d | 1 | 0.50mi |
| 363 Kendrick Ln Unit 63-51 Front Royal, VA | 2.0 | 1.0 | 730 | $1,250 | $1.71 | 43d | 1 | 0.59mi |
| 1416 N Shenandoah Ave Unit 8 Front Royal, VA | 2.0 | 1.0 | 800 | $1,300 | $1.62 | 24d | 1 | 0.59mi |
| 422 Viscose Ave Unit 3 Front Royal, VA | 2.0 | 1.0 | 816 | $1,490 | $1.83 | 5d | 1 | 0.85mi |
| 518 Viscose Ave #2 Front Royal, VA | 2.0 | 1.0 | 850 | $1,600 | $1.88 | 43d | 1 | 0.86mi |
| 228 Cloud St Unit UPPER Front Royal, VA | 2.0 | 1.0 | 884 | $1,200 | $1.36 | 20d | 1 | 1.04mi |
| 221 Fletcher St #2 Front Royal, VA | 3.0 | 1.0 | 980 | $1,440 | $1.47 | 5d | 1 | 1.05mi |
| 213 Laurel St Front Royal, VA | 2.0 | 1.0 | 768 | $1,440 | $1.88 | 44d | 1 | 1.16mi |
| 310 Frazer Pl Front Royal, VA | 2.0 | 2.0 | 1104 | $2,000 | $1.81 | 43d | 1 | 1.18mi |
| 352 Blue Ridge Ave Unit B Front Royal, VA | 2.0 | 1.0 | 700 | $1,000 | $1.43 | 24d | 1 | 1.22mi |
Listing history 8 events
-
2026-05-06status Pending 606-char remark
Show marketing remark (606 chars)
INVESTOR purchase only. Current tenant and lease in place, and has to convey to the new owner. Text agent for details. Convenient living in the town of Front Royal. Enjoy the cooler summers and mountain adventures close to home. The outdoors awaits with streams, hiking, camping, and Skyline Caverns, just moments away. Easy walk to the Old Town area of Front Royal. The home is currently rented with an active lease (including lawn service). Contact us ASAP for a private appointment to view 822 N Commerce Ave, Front Royal, VA 22630 * Note: some of the photos were digitally staged for your inspiration.
-
2026-04-09$199,900 Active 606-char remark
Show marketing remark (606 chars)
INVESTOR purchase only. Current tenant and lease in place, and has to convey to the new owner. Text agent for details. Convenient living in the town of Front Royal. Enjoy the cooler summers and mountain adventures close to home. The outdoors awaits with streams, hiking, camping, and Skyline Caverns, just moments away. Easy walk to the Old Town area of Front Royal. The home is currently rented with an active lease (including lawn service). Contact us ASAP for a private appointment to view 822 N Commerce Ave, Front Royal, VA 22630 * Note: some of the photos were digitally staged for your inspiration.
-
2026-03-31historical $199,900 606-char remark
Show marketing remark (606 chars)
INVESTOR purchase only. Current tenant and lease in place, and has to convey to the new owner. Text agent for details. Convenient living in the town of Front Royal. Enjoy the cooler summers and mountain adventures close to home. The outdoors awaits with streams, hiking, camping, and Skyline Caverns, just moments away. Easy walk to the Old Town area of Front Royal. The home is currently rented with an active lease (including lawn service). Contact us ASAP for a private appointment to view 822 N Commerce Ave, Front Royal, VA 22630 * Note: some of the photos were digitally staged for your inspiration.
-
2025-08-15historical $1,500
-
2025-08-14$1,500
-
2024-05-06historical $1,400
-
2024-04-30price $1,400
-
2024-03-16$1,500
ⓘ Source: listings_history table (triggers on properties + properties_extension) + one-shot
backfill from property_details.listing_events for pre-trigger history.
Tax reassessment forecast VA · Resets to sale price
- Current annual tax
- $931 · $78/mo
- Projected year-2 tax
- $1,639 · $137/mo
- Expected delta
- +$708/yr (+$59/mo · 76.1%)
ⓘ Screening estimate from a state-policy table — verify with the county assessor before closing.
Nearby sold comps map
Loading sold comps map…
Walkable amenities ~0.75 mi
Loading nearby amenities…
Taxation est. · year 1
- Rental income
- $18,540
- − Mortgage interest
- −$11,198
- − Property taxes
- −$931
- − Insurance
- −$1,000
- − Repairs & maintenance
- −$1,483
- − Management
- −$1,483
- − Depreciation
- −$5,815
- Taxable loss
- −$3,370
- Est. tax savings @ 24.0%
- +$809
- After-tax cash flow
- $945/yr
For passive investors: Depreciation is non-cash, so a rental often shows a tax loss while cash-flowing — sheltering income. Rental losses are passive: they offset passive income freely, and up to $25,000/yr can offset ordinary (W-2) income if you actively participate and your MAGI is under $100k (phasing out to $0 by $150k); unused losses carry forward. On sale, claimed depreciation is recaptured at up to 25%, and gains may owe capital-gains tax (a 1031 exchange can defer both). Figures are a year-1 estimate at your 24.0% rate — not tax advice; consult a CPA.
Schools (NCES district)
- District
- Warren County Public School District
- NCES district ID
- 5103870
- Math proficiency
- 49% ▼ -29.00%
- Reading proficiency
- 64% ▼ -10.00%
- Median HH income
- $61,504
- Composite
- 49.22/100
- National rank
- #2039
- State rank
- #70 of 131 in VA
Livability — Front Royal
- Score
- 73/100
- State rank
- #162
- US rank
- #5050
Category grades
Schools grade is shown separately in the Schools card above.
Census & demographics
- Census place
- Front Royal, VA
- County
- Warren County · 35,615 people
- City population
- 35,615
- Metro
- Washington-Arlington-Alexandria, DC-VA-MD-WV
- Population (ZIP)
- 35,615
- Household income
- $84,631
- Rent vs Own
- Severe rent burden
- 460.0
Population outlook (Warren County) Hauer SSP2
- Today (2025)
- 42,045 people
- By 2030
- 43,257 · +2.9%
- By 2040
- 45,088 · +7.2%
- By 2050
- 45,567 · +8.4%
- By 2075
- 46,081 · +9.6%
- By 2100
- 42,093 · +0.1%
Race, ethnicity, and origin ACS 2023
- Neighborhood character
- Predominantly White (81%)
- Race & ethnicity
- White 81% Hispanic / Latino 7% Black 6% Two or more races 5% Asian 2%
- Hispanic origin (detail)
- Mexican 1%
- Common ancestry
- Slovak 3% Lithuanian 2% Romanian 2%
- Foreign-born
- 6% · Canada
- Languages at home
- 92% English-only · Spanish 5% Other Indo-European 1%
Political lean MEDSL · Warren
- 2024 margin
- Solid R (+37.6) · D 30.6% · R 68.3% · Other 1.1%
- 2008→2024 swing
- -26.0pp toward R · 2008: -11.7pp · 2024: -37.6pp
- All cycles
- 2024: R+37.6 2020: R+35.3 2016: R+37.1 2012: R+20.5 2008: R+11.7
Not yet ingested
- Civics
- —
Market trends
- HPI YoY
- ▼ -118.82%
- Current HPI
- 319.8136
- Rent YoY
- ▲ 8.30%
- Metro
- Washington-Arlington-Alexandria, DC-VA-MD-WV
- State GDP YoY
- ▲ 2.40%
- F500 in state
- 50
Industry mix (Fortune 500 HQ in VA)
| Industry | F500 HQs | Revenue |
|---|---|---|
| Aerospace / Defense | 4 | $236B |
|
||
| Technology / Defense | 3 | $32B |
|
||
| Financial Services | 2 | $176B |
|
||
| Utilities | 2 | $27B |
|
||
| Insurance | 2 | $25B |
|
||
| Technology | 2 | $15B |
|
||
Price history
+13226.7% since first listed8 events — show timeline
- 2026-05-06 Pending — BRIGHT MLS
- 2026-04-09 Listed $199,900 BRIGHT MLS
- 2026-03-31 Coming Soon $199,900 BRIGHT MLS
- 2025-08-15 Rental Removed $1,500 BRIGHTMLS
- 2025-08-14 Listed for Rent $1,500 BRIGHTMLS
- 2024-05-06 Rental Removed $1,400 BRIGHTMLS
- 2024-04-30 Price Changed $1,400 BRIGHTMLS
- 2024-03-16 Listed for Rent $1,500 BRIGHTMLS
Property tax history
+5.4%/yrLatest (2025): $931 · +51.0% YoY. Source: county tax records.
Cash-flow waterfall
monthlySold comps — $/sqft
last 12 mo · ≤1 miLoading sold comps…