 🏗️ New Construction
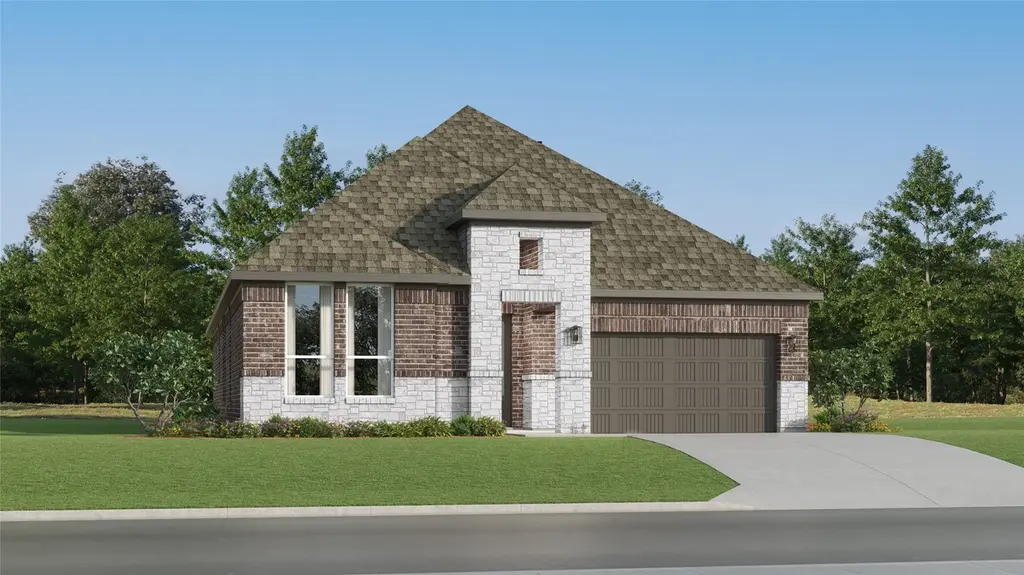
2628 Grove Crest Dr · Rosenberg, TX
Flood risk 6/10 · Moderate
- FEMA flood zone
- X (shaded)
- Chance of flooding over 30 yrs
- 0.69%
- Est. flood insurance / yr
- $507 – $1,088
Fire risk 3/10 · Minor
- Est. fire insurance / yr
- $1,222 – $2,270
Heat risk 9/10 · Severe
- Hot days now (above 110°F)
- 7 days/yr
- Hot days in 30 yrs
- 23 days/yr
Wind risk 9/10 · Severe
- Chance of severe wind over 30 yrs
- 99.0%
Air-quality risk 2/10 · Minimal
- Unhealthy air days now
- 1 days/yr
- Unhealthy air days in 30 yrs
- 1 days/yr
Risk factors via First Street. Map © Google.
Why this score? — see what drove the F grade
The composite is a weighted blend of 9 inputs, each scored 0–100. Each bar is that input's sub-score; the figure is the points it added to the 100-point composite (weight × sub-score).
- ARV discount +7.5/15.0
- Cash flow +6.2/30.0
- Schools +4.6/10.0
- Livability +3.1/5.0
- Condition / age +2.5/5.0
- Rent growth +2.0/5.0
- 1% rule +1.8/10.0
- DSCR +0.6/10.0
- Appreciation +0.0/10.0
$346,990
🖨 Deal sheet 📄 Offer letter ✓ Due diligence
Listing remarks
New Construction Lennar Houston Home - The Netcher Floor Plan - This new single-story home features a gracious layout with ample space to grow and entertain. Two secondary bedrooms share a hallway bathroom off the foyer, while around the corner is a quiet third bedroom. At the heart of the home is an airy open-concept living area complemented by a practical study and a covered patio. In the corner is the serene owner’s suite with an attached bathroom and walk-in closet. The completion date, prices and features may vary and are subject to change. Please verify with Lennar directly. Photos are for illustrative purposes only.
Key facts
- Practical study
- Attached bathroom
- Covered patio
Tags
Property features AI
Finance
- Financial info: Annual association fee of $1,350
- HOA & community: Community association (VanMor Properities) with annual fee
Exterior
- Parking: Attached 2-car garage
- Utilities: Public water; Public sewer
- Home design: Residential property; Under construction (new construction); Slab foundation
- Construction: Built in 2026; Brick construction; Composition roof
- Exterior features: Back yard fence; Subdivision lot
Interior
- Kitchen: Dishwasher; Electric oven; Electric range; Gas oven; Gas range
- Bedrooms: Primary bedroom (First level); Bedroom (First level); Bedroom (First level); Bedroom (First level); Office (First level); Family room (First level); Dining room (First level); Kitchen (First level)
- Flooring: Carpet; Vinyl
- Bathrooms: 2 full bathrooms
- Heating & cooling: Central heating (Electric and Gas); Central air (Electric and Gas)
- Interior features: Breakfast bar; Double vanity; Kitchen/family room combo; Separate shower; Tub/shower
- Laundry & utility: Washer hookup; Electric dryer hookup; Gas dryer hookup
Neighborhood map
What this means for you Summary
Snapshot
- This is a 4-bed/2.0-bath single-family listed at $347k.
Deal economics
- At list price, monthly cash flow is $-713 ($-9k/yr) — negative.
- To cash-flow at today's rent, offer at most $292k (15.9% below list).
- To meet the 1% rule (rent ≥ 1% of price), the offer needs to be $270k (22.3% below list).
- Recommended offer: $270k (22.3% below list) — sets the bar for 1% rule.
- Cap rate 4.1% vs local median 3.4% in Rosenberg — meaningfully above typical; check what's discounted (condition, days-on-market, listing class) to confirm the premium yield is real.
Location & tenants
- Location reads 62/100 on livability (#922 in TX) — a middle-class / working-renter tenant base. Strengths: cost of living A+, housing A+, crime B; Watch: schools D-, amenities F, commute F.
- Lamar CISD (suburban): math 50% / reading 53% proficiency, ranked #116 of 826 in TX (top 14%) — acceptable for families but not a draw, mixed tenant base, ~2y average lease.
- Market conditions: Rents soft (-1.8%/yr); 1332 active listings in the ZIP; 6 comparable units currently listed for rent nearby; rentals lingering (median 44d on market — plan ~5-8 weeks vacancy on turnover, expect pricing pressure); 50% of comp listings sitting > 30 days — soft ceiling on asking rent; solid renter incomes; 12,093 units permitted in Fort Bend County in 2024 (815 in 5+ unit buildings).
- This rent runs 32% of the median local income ($102k/yr) — at the standard rent-burdened threshold; future hikes will face affordability resistance.
Forward outlook
- Local home prices are declining (-3.0%/yr); year-one equity from $3k of loan paydown is wiped out by about $12k of value loss. Plan a longer hold.
- Fort Bend County population projected at +75% by 2050 — long-run rental-demand tailwind backs the buy-and-hold thesis.
Negotiation context
- It's been on market 38 days — a 3% lower offer ($337k) is reasonable based on typical stale-listing flexibility.
- 2 sale attempts with the ask held roughly flat each time — persistent listings suggest the price (not the market) is what's stuck; bring a comps-based counter.
Risks & watch-outs
- Climate carrying-cost: major flood risk; severe wind risk, 99% chance of damaging wind over 30y; extreme-heat days projected 7→23/yr by 2055 (HVAC capex compounding) — expect insurance premiums to compound above CPI over the hold.
Questions for the listing agent
- What do current leases actually rent for vs. the listed asking? Can we see a recent rent roll and the last 12 months of T-12 income?
- It's been on market 38 days. Have you received any prior offers? Is the seller open to a 22% concession, seller financing, or rate buy-down credit?
- What does the HOA fee cover, when was the last increase, and are there any pending special assessments or reserve-fund shortfalls?
- Is there a deadline driving the sale (1031 exchange, divorce, estate, relocation)? That informs how much negotiation room exists.
- Schools are D-rated, which usually means shorter tenancies and higher turnover. Who's the typical renter profile here, and what's been the actual vacancy rate?
- The area grade is low — what's the realistic commute time and amenity access for the typical tenant pool here? Any planned neighborhood developments (good or bad) we should know about?
- What's the average days-on-market for RENTAL listings here right now (not sales)? A rising rental-DOM trend means longer vacancies and softer asking-rent achievability than the comps imply.
- What's the recent tenant-quality profile in this submarket — average credit score on applications, eviction rate, late-payment / NSF rate, and stable-employment percentage? A property-management company in the area should have these aggregated.
- How much new for-sale + rental construction is in the pipeline within 1–3 miles? Heavy new supply typically softens prices + rents 12–24 months out; constrained supply supports both.
Investment metrics
- 1% rule
- 0.68% ✗
- Cap rate
- 4.13%
- Cash-on-cash
- -7.73%
- DSCR
- 0.66
- GRM
- 12.2
CMA / ARV
- ARV (median comp)
- $394,990
- List price
- $346,990
- Delta
- -12.15%
- Verdict
- UNDERPRICED
- Comps
- 20 within 1.0 mi
Show comp detail 12 sales within ~0.75 mi
| Address | Dist | Beds/Ba | Sqft | Sold | Price | $/sf | Match |
|---|---|---|---|---|---|---|---|
| 2711 Grove Crest Dr | 0.15mi | 4/2.0 | 2,162 (0%) | 1mo | $344,990 | $160 | 92 |
| 2723 Grove Crest Dr | 0.01mi | 4/2.0 | 1,941 (-10%) | 1mo | $304,191 | $157 | 82 |
| 4227 Eagle Pass Dr | 0.15mi | 3/2.0 (-1) | 2,093 (-3%) | 3mo | $361,990 | $173 | 80 |
| 4330 Eagle Pass Dr | 0.24mi | 3/2.0 (-1) | 2,093 (-3%) | 2mo | $361,990 | $173 | 77 |
| 2620 Pine Bluff Dr | 0.10mi | 3/2.0 (-1) | 2,358 (+9%) | 1mo | $394,990 | $168 | 74 |
| 2716 Pine Bluff Dr | 0.10mi | 3/2.0 (-1) | 2,358 (+9%) | 3mo | $394,990 | $168 | 73 |
| 4315 Eagle Pass Dr | 0.20mi | 4/3.0 | 2,393 (+11%) | 2mo | $379,990 | $159 | 67 |
| 2704 Pine Bluff Dr | 0.20mi | 3/2.5 (-1) | 2,386 (+10%) | 2mo | $396,990 | $166 | 65 |
| 4411 Eagle Pass Dr | 0.28mi | 4/3.0 | 2,393 (+11%) | 1mo | $381,990 | $160 | 65 |
| 5115 Twin Summit Dr | 0.64mi | 3/2.0 (-1) | 2,086 (-4%) | 2mo | $330,000 | $158 | 58 |
| 4622 Seabourne Landing Dr | 0.50mi | 3/2.0 (-1) | 1,915 (-11%) | 3mo | $299,900 | $157 | 51 |
| 3708 Rock Ledge Dr | 0.71mi | 3/2.5 (-1) | 2,372 (+10%) | 2mo | $325,000 | $137 | 42 |
Match score weights: distance 35% · size 25% · config 20% · recency 20%. Top-matched comps best support the ARV.
Projected returns pro-forma
-3.0% appreciation · 0.0% rent growth · sell at horizon
- IRR
- -33.3%
- Equity multiple
- -0.06×
- Total profit
- $-117,187
- Equity at exit
- $58,894
- IRR
- -64.2%
- Equity multiple
- -0.72×
- Total profit
- $-190,580
- Equity at exit
- $34,152
Cash invested: $110,597 (down + closing). Projections, not guarantees.
Landlord ↔ Tenant lean methodology
- Overall (STATE)
- 87 Strongly Landlord-Friendly
- State Texas
- 87 Strongly Landlord-Friendly · R+5
- County
- — inherits STATE
- City
- — inherits STATE
ZIP-level market 77469
- Home prices YoY
- -25.1%
- Rents YoY
- -1.8%
- Active inventory
- 1332
- Price-to-rent
- 10.7×
Monthly cashflow live
- Estimated rent
- $2,696 high interval (Pro) →
- Mortgage (P&I)
- −$2,071
- Tax est. 1.5%
- −$494 /mo · $5,925/yr
- Insurance
- −$165
- HOA
- −$113
- Vacancy / Maint / Mgmt
- −$566
- Net cashflow
- $-713
Break-even live
UW: 25.0% down · 7.5% · 30yr · 1.5% tax · 5.0% vac · 8.0% maint · 8.0% mgmt
Financing live
Cash to close
- Down payment
- $98,748
- Closing costs
- $11,850
- Reserves months
- —
- Total cash needed
- —
Loan-product check · same deal, 3 products live
Conventional
25% down · 7.5% · 30yr
- Down + closing
- —
- Monthly P&I
- —
- Monthly cashflow
- —
- DSCR
- —
- Eligible?
- —
Personal DTI + credit; lowest rate.
DSCR
20% down · 8.5% · 30yr
- Down + closing
- —
- Monthly P&I
- —
- Monthly cashflow
- —
- DSCR
- —
- Eligible?
- —
No personal income docs; deal must DSCR.
Hard money
10% down · 12.0% · 12mo
- Down + closing
- —
- Monthly P&I
- —
- Monthly cashflow
- —
- DSCR
- —
- Eligible?
- —
Short-term bridge; refi at stabilization.
Rent comps 6 comps
| Address | Beds | Baths | Sqft | Rent | $/sqft | DOM | Units | Dist |
|---|---|---|---|---|---|---|---|---|
| 4516 Bartagrass Dr Richmond, TX | 4.0 | 2.0 | 2160 | $3,850 | $1.78 | 43d | 1 | 0.59mi |
| 5120 Twin Summit Dr Richmond, TX | 4.0 | 2.0 | 1932 | $2,099 | $1.09 | 12d | 1 | 0.63mi |
| 5026 Manor Stone Ln Richmond, TX | 3.0 | 2.0 | 1557 | $1,781 | $1.14 | 12d | 1 | 0.66mi |
| 3715 Rock Ledge Dr Richmond, TX | 3.0 | 2.5 | 2398 | $2,400 | $1.00 | 10d | 1 | 0.74mi |
| 5228 Pine Pass Dr Richmond, TX | 4.0 | 2.0 | 1932 | $2,271 | $1.18 | 43d | 1 | 0.79mi |
| 4212 Russet Elm Ln Richmond, TX | 4.0 | 2.5 | 2452 | $2,295 | $0.94 | 43d | 1 | 1.26mi |
HOA detail
- Monthly dues
- $113 · $1,356/yr
Listing history 19 events
-
2026-06-18days on market $346,990 Active 38 DOM
-
2026-06-18remarks 630-char remark
-
2026-06-17days on market $346,990 Active 37 DOM
-
2026-06-16days on market $346,990 Active 36 DOM
-
2026-06-15days on market $346,990 Active 35 DOM
-
2026-06-13days on market $346,990 Active 33 DOM
-
2026-06-09pricedays on market $346,990 Active 29 DOM
-
2026-06-08days on market $355,690 Active 28 DOM
-
2026-06-07days on market $355,690 Active 27 DOM
-
2026-06-04days on market $355,690 Active 24 DOM
-
2026-06-03days on market $355,690 Active 23 DOM
-
2026-06-02days on market $355,690 Active 22 DOM
-
2026-06-01days on market $355,690 Active 21 DOM
-
2026-05-31days on market $355,690 Active 20 DOM
-
2026-05-11price $341,090 597-char remark
-
2026-05-11$346,990 Active 597-char remark
-
2026-05-05historical
-
2026-05-04price $334,040
-
2026-04-29$346,990 Active
ⓘ Source: listings_history table (triggers on properties + properties_extension) + one-shot
backfill from property_details.listing_events for pre-trigger history.
Climate risk First Street
- Flood 6/10 Major FEMA zone X (shaded) · 69% chance over 30 yrs
- Wildfire 3/10 Moderate
- Heat 9/10 Extreme 7 d/yr ≥110°F today · 23 d/yr by 30 yrs out
- Wind 9/10 Extreme 99% chance of damaging wind over 30 yrs
- Air quality 2/10 Low 1 unhealthy d/yr today · 1 by 30 yrs out
Nearby sold comps map
Loading sold comps map…
Walkable amenities ~0.75 mi
Loading nearby amenities…
Taxation est. · year 1
- Rental income
- $32,355
- − Mortgage interest
- −$22,126
- − Property taxes
- −$5,925
- − Insurance
- −$1,975
- − Repairs & maintenance
- −$2,588
- − Management
- −$2,588
- − HOA
- −$1,356
- − Depreciation
- −$11,491
- Taxable loss
- −$15,694
- Est. tax savings @ 24.0%
- +$3,767
- After-tax cash flow
- $-4,785/yr
For passive investors: Depreciation is non-cash, so a rental often shows a tax loss while cash-flowing — sheltering income. Rental losses are passive: they offset passive income freely, and up to $25,000/yr can offset ordinary (W-2) income if you actively participate and your MAGI is under $100k (phasing out to $0 by $150k); unused losses carry forward. On sale, claimed depreciation is recaptured at up to 25%, and gains may owe capital-gains tax (a 1031 exchange can defer both). Figures are a year-1 estimate at your 24.0% rate — not tax advice; consult a CPA.
Schools (NCES district)
- District
- Lamar CISD
- NCES district ID
- 4826580
- Math proficiency
- 50% ▼ -12.00%
- Reading proficiency
- 53% ▼ -4.00%
- Median HH income
- $75,213
- Composite
- 46.43/100
- National rank
- #2452
- State rank
- #116 of 826 in TX
Livability — Rosenberg
- Score
- 62/100
- State rank
- #922
- US rank
- #16414
Category grades
Schools grade is shown separately in the Schools card above.
Census & demographics
- Census place
- Rosenberg, TX
- County
- Fort Bend County · 836,777 people
- City population
- 115,151
- Metro
- Houston-The Woodlands-Sugar Land, TX
- Population (ZIP)
- 69,826
- Household income
- $102,125
- Rent vs Own
- Severe rent burden
- 1292.0
Population outlook (Fort Bend County) Hauer SSP2
- Today (2025)
- 1,004,526 people
- By 2030
- 1,153,104 · +14.8%
- By 2040
- 1,453,718 · +44.7%
- By 2050
- 1,753,781 · +74.6%
- By 2075
- 2,455,772 · +144.5%
- By 2100
- 2,930,528 · +191.7%
Race, ethnicity, and origin ACS 2023
- Neighborhood character
- Highly diverse neighborhood (Simpson 0.76)
- Race & ethnicity
- Hispanic / Latino 29% White 27% Black 25% Two or more races 15% Asian 15%
- Hispanic origin (detail)
- Mexican 21%
- Common ancestry
- Romanian 1% Lithuanian 1%
- Foreign-born
- 24% · Canada, Vietnam, China
- Languages at home
- 65% English-only · Spanish 17% Other Indo-European 7% Other Asian/Pacific 2%
Political lean MEDSL · Fort Bend
- 2024 margin
- Toss-up / Even · D 49.5% · R 47.9% · Other 2.6%
- 2008→2024 swing
- +4.0pp toward D · 2008: -2.4pp · 2024: 1.6pp
- All cycles
- 2024: D+1.6 2020: D+10.6 2016: D+6.6 2012: R+6.8 2008: R+2.4
Not yet ingested
- Civics
- —
Market trends
- HPI YoY
- ▼ -78.66%
- Current HPI
- 234.9892
- Rent YoY
- ▼ -1.81%
- Metro
- Houston-The Woodlands-Sugar Land, TX
- State GDP YoY
- ▲ 3.95%
- F500 in state
- 110
Industry mix (Fortune 500 HQ in TX)
| Industry | F500 HQs | Revenue |
|---|---|---|
| Energy | 16 | $1,198B |
|
||
| Technology | 5 | $198B |
|
||
| Engineering / Construction | 4 | $72B |
|
||
| Energy Services | 3 | $60B |
|
||
| Utilities | 3 | $41B |
|
||
| Healthcare | 2 | $330B |
|
||
Price history
+0.0% since first listed8 events — show timeline
- 2026-06-08 Price Changed $346,990 HARMLS
- 2026-05-29 Price Changed $355,690 HARMLS
- 2026-05-19 Price Changed $361,090 HARMLS
- 2026-05-11 Price Changed $341,090 HARMLS
- 2026-05-11 Listed $346,990 HARMLS
- 2026-05-05 Listing Removed — HARMLS
- 2026-05-04 Price Changed $334,040 HARMLS
- 2026-04-29 Listed $346,990 HARMLS
Cash-flow waterfall
monthlySold comps — $/sqft
last 12 mo · ≤1 miLoading sold comps…