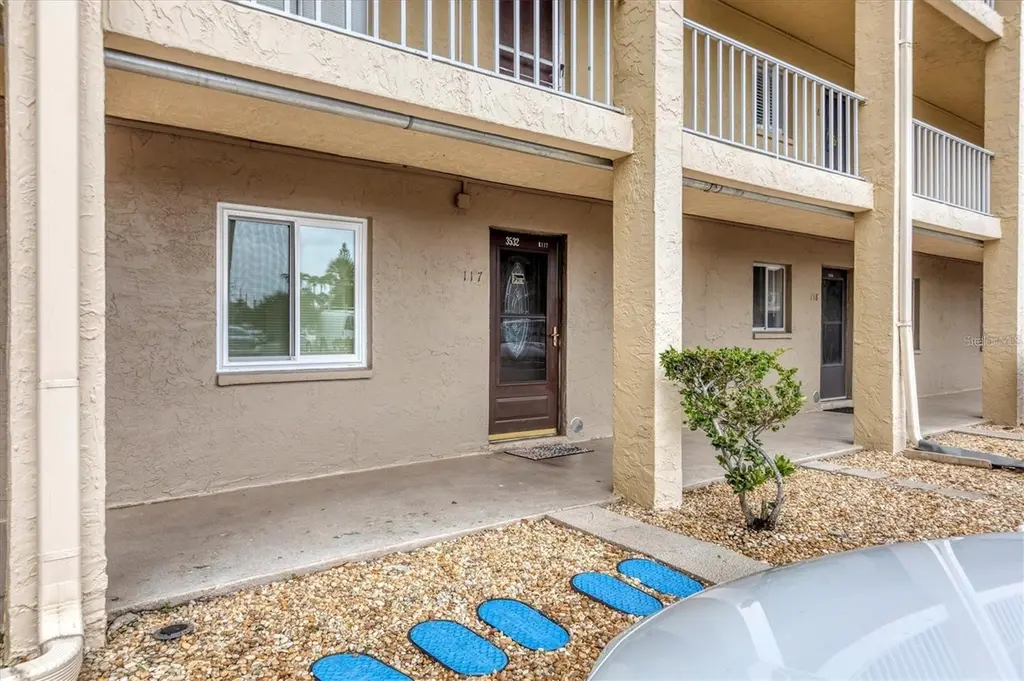
3532 Lake Bayshore Dr Unit K117 · South Bradenton, FL
Flood risk 3/10 · Minor
- FEMA flood zone
- X (unshaded)
- Chance of flooding over 30 yrs
- 0.2%
- Est. flood insurance / yr
- $507 – $1,088
Fire risk 1/10 · Minimal
- Est. fire insurance / yr
- $947 – $1,759
Heat risk 10/10 · Severe
- Hot days now (above 107°F)
- 7 days/yr
- Hot days in 30 yrs
- 31 days/yr
Wind risk 10/10 · Severe
- Chance of severe wind over 30 yrs
- 99.0%
Air-quality risk 3/10 · Minor
- Unhealthy air days now
- 2 days/yr
- Unhealthy air days in 30 yrs
- 2 days/yr
Risk factors via First Street. Map © Google.
Why this score? — see what drove the C+ grade
The composite is a weighted blend of 9 inputs, each scored 0–100. Each bar is that input's sub-score; the figure is the points it added to the 100-point composite (weight × sub-score).
- Cash flow +25.4/30.0
- 1% rule +10.0/10.0
- DSCR +8.4/10.0
- ARV discount +7.5/15.0
- Schools +4.4/10.0
- Livability +3.9/5.0
- Condition / age +2.5/5.0
- Rent growth +1.9/5.0
- Appreciation +0.0/10.0
$60,000
🖨 Deal sheet 📄 Offer letter ✓ Due diligence
Listing remarks
Short Sale. Ground Floor Condo in Beautiful Bayshore on the Lake 55+ community in Bradenton. Your parking is right in front of your door. FULLY FURNISHED. The open floor plan features a tiled foyer, a spacious living room with sliders leading to an all-tiled enclosed lanai.
Key facts
- Ground floor condo
- Tiled foyer
- Bayshore on the lake
Tags
Property features AI
Finance
- Other: Furnished; Condo land included; Total lot approximately 3.66 acres
- Financial info: Total annual HOA fees: $6,828; Lease restrictions apply
- HOA & community: HOA managed by Resource Property Mgt; Monthly HOA/condo fee of $569; Condo fees include cable TV, pool, internet, maintenance of structure, management, pest control, private road, trash, escrow reserves fund, fidelity bond; Association approval required; Clubhouse on site; Senior community; Pets not allowed; Buyer approval required
Exterior
- Parking: No specific parking details provided
- Security: Buyer approval required for community access
- Utilities: Public sewer; Water connected; Sewer connected; Electricity connected; Cable connected
- Home design: Condominium; Single-story (1 story); Faces south; Entry level: Floor 1
- Construction: Block construction; Shingle roof; Slab foundation; Built as part of building 3532/K117
- Exterior features: Other exterior features; Asphalt road access
Interior
- Kitchen: Dishwasher
- Bedrooms: 2 bedrooms
- Flooring: Ceramic tile
- Bathrooms: 1 full bathroom
- Heating & cooling: Electric heating; Central air conditioning
- Interior features: Open floorplan
- Laundry & utility: Common area laundry
Neighborhood map
What this means for you Summary
Snapshot
- This is a 2-bed/1.0-bath condo listed at $60k.
Deal economics
- At list price, monthly cash flow is $138 ($2k/yr) — positive.
- The deal already cash-flows at list — no discount required.
- Meets the 1% rule at list price ($1k rent vs $60k).
- Recommended offer: $59k (1.5% below list) — sets the bar for market timing.
- Cap rate 9.1% vs local median 4.1% in South Bradenton — top-decile yield for the area; either an underpriced asset or a hidden risk that comps aren't pricing in. Stress-test before assuming the spread holds.
Location & tenants
- Location reads 77/100 on livability (#195 in FL, #3,092 nationally) — a middle-class / working-renter tenant base. Strengths: cost of living A+, housing A+, health & safety A+; Watch: amenities C-, crime D+, commute F.
- Manatee (suburban): math 54% / reading 50% proficiency, ranked #26 of 73 in FL (top 36%) — acceptable for families but not a draw, mixed tenant base, ~2y average lease.
- Market conditions: Rents soft (-2.4%/yr); 319 active listings in the ZIP; 40 comparable units currently listed for rent nearby; rentals at typical pace (median 24d on market — plan ~3-4 weeks tenant-placement turnaround); 7,472 units permitted in Manatee County in 2024 (1,782 in 5+ unit buildings).
- This rent runs 34% of the median local income ($53k/yr) — at the standard rent-burdened threshold; future hikes will face affordability resistance.
Forward outlook
- Local home prices are declining (-3.0%/yr); year-one equity from $415 of loan paydown is wiped out by about $2k of value loss. Plan a longer hold.
- Manatee County population projected at +43% by 2050 — long-run rental-demand tailwind backs the buy-and-hold thesis.
Negotiation context
- It's been on market 15 days — a 2% lower offer ($59k) is reasonable based on typical stale-listing flexibility.
- 17 sale attempts since 21y ago with the ask held roughly flat each time — persistent listings suggest the price (not the market) is what's stuck; bring a comps-based counter.
Risks & watch-outs
- Watch-outs: property tax is 2.7% of price; HOA is 38% of rent.
- Climate carrying-cost: severe wind risk, 99% chance of damaging wind over 30y; extreme-heat days projected 7→31/yr by 2055 (HVAC capex compounding) — expect insurance premiums to compound above CPI over the hold.
Questions for the listing agent
- Property tax is high relative to price — has the assessment been appealed recently, and will the sale trigger a re-assessment?
- What does the HOA fee cover, when was the last increase, and are there any pending special assessments or reserve-fund shortfalls?
- Any open or pending special assessments — roof, HVAC, plumbing, elevator, façade? What's the per-unit balance and payoff schedule, and is the seller paying it off at close or rolling it to the buyer?
- Is there a deadline driving the sale (1031 exchange, divorce, estate, relocation)? That informs how much negotiation room exists.
- Schools are B-rated — typically a magnet for longer-tenancy family renters. What's the average tenant stay here, and is there a school-zone premium baked into asking?
- Crime grade is D in this area — have there been break-ins, vandalism, or insurance claims at this property in the last 3 years? What carrier currently insures it and at what premium?
- What's the average days-on-market for RENTAL listings here right now (not sales)? A rising rental-DOM trend means longer vacancies and softer asking-rent achievability than the comps imply.
- What's the recent tenant-quality profile in this submarket — average credit score on applications, eviction rate, late-payment / NSF rate, and stable-employment percentage? A property-management company in the area should have these aggregated.
- How much new apartment / multifamily construction is in the pipeline within 1–3 miles? Heavy new supply (>2% of stock underway) typically softens rents 12–24 months out; light construction supports rent growth.
Investment metrics
- 1% rule
- 2.49% ✓
- Cap rate
- 9.06%
- Cash-on-cash
- 9.87%
- DSCR
- 1.44
- GRM
- 3.3
CMA / ARV
No comps found within radius.
Projected returns pro-forma
-3.0% appreciation · 0.0% rent growth · sell at horizon
- IRR
- -8.5%
- Equity multiple
- 0.71×
- Total profit
- $-4,890
- Equity at exit
- $8,946
- IRR
- -12.0%
- Equity multiple
- 0.51×
- Total profit
- $-8,191
- Equity at exit
- $5,188
Cash invested: $16,800 (down + closing). Projections, not guarantees.
Landlord ↔ Tenant lean methodology
- Overall (STATE)
- 87 Strongly Landlord-Friendly
- State Florida
- 87 Strongly Landlord-Friendly · R+3
- County
- — inherits STATE
- City
- — inherits STATE
ZIP-level market 34205
- Rents YoY
- -2.4%
- Active inventory
- 319
- Price-to-rent
- 3.3×
Monthly cashflow live
- Estimated rent
- $1,495 high interval (Pro) →
- Mortgage (P&I)
- −$315
- Tax from tax record
- −$134 /mo · $1,608/yr
- Insurance
- −$25
- HOA
- −$569
- Vacancy / Maint / Mgmt
- −$314
- Net cashflow
- $138
Break-even live
UW: 25.0% down · 7.5% · 30yr · 1.5% tax · 5.0% vac · 8.0% maint · 8.0% mgmt
Financing live
Cash to close
- Down payment
- $15,000
- Closing costs
- $1,800
- Reserves months
- —
- Total cash needed
- —
Loan-product check · same deal, 3 products live
Conventional
25% down · 7.5% · 30yr
- Down + closing
- —
- Monthly P&I
- —
- Monthly cashflow
- —
- DSCR
- —
- Eligible?
- —
Personal DTI + credit; lowest rate.
DSCR
20% down · 8.5% · 30yr
- Down + closing
- —
- Monthly P&I
- —
- Monthly cashflow
- —
- DSCR
- —
- Eligible?
- —
No personal income docs; deal must DSCR.
Hard money
10% down · 12.0% · 12mo
- Down + closing
- —
- Monthly P&I
- —
- Monthly cashflow
- —
- DSCR
- —
- Eligible?
- —
Short-term bridge; refi at stabilization.
Rent comps 40 comps
| Address | Beds | Baths | Sqft | Rent | $/sqft | DOM | Units | Dist |
|---|---|---|---|---|---|---|---|---|
| 4109 Lake Bayshore Dr Bradenton, FL | 1.0 | 1.0 | 768 | $1,250 | $1.63 | 24d | 1 | 0.16mi |
| 3737 Lake Bayshore Dr Unit 213 Bradenton, FL | 2.0 | 1.0 | 912 | $1,150 | $1.26 | 21d | 1 | 0.16mi |
| 3963 Lake Bayshore Dr Unit F-414 Bradenton, FL | 2.0 | 1.0 | 1040 | $1,200 | $1.15 | 14d | 1 | 0.16mi |
| 2306 30th Ave W Bradenton, FL | 3.0 | 2.0 | 945 | $1,700 | $1.80 | 24d | 1 | 0.26mi |
| 4204 Heron Way Unit B304 Bradenton, FL | 2.0 | 1.0 | 912 | $1,400 | $1.54 | 3d | 1 | 0.33mi |
| 2901 26th St W #807 Bradenton, FL | 2.0 | 2.0 | 940 | $1,525 | $1.62 | 3d | 1 | 0.34mi |
| 3506 14th St W Bradenton, FL | 3.0 | 1.0–2.0 | 874 | $1,725 | $1.97 | 24d | 5 | 0.46mi |
| 2201 24th Ave W Bradenton, FL | 2.0 | 2.0 | 1115 | $1,950 | $1.75 | 24d | 1 | 0.57mi |
| 1308 36th Ave W Bradenton, FL | 1.0 | 1.0 | 715 | $1,199 | $1.68 | 24d | 1 | 0.64mi |
| 4515 26th St W Bradenton, FL | 1.0–2.0 | 1.0–2.0 | 806 | $1,510 | $1.87 | 2d | 14 | 0.66mi |
| 2205 20th St W Bradenton, FL | 2.0 | 1.0 | 810 | $1,850 | $2.28 | 12d | 1 | 0.71mi |
| 2315 17th Street Ln W Bradenton, FL | 1.0 | 1.0 | 528 | $1,200 | $2.27 | 24d | 1 | 0.72mi |
| 4444 17th St W Unit B Bradenton, FL | 2.0 | 1.0 | 850 | $2,200 | $2.59 | 24d | 1 | 0.72mi |
| 2305 46th Ave W Bradenton, FL | 1.0–2.0 | 1.0–2.0 | 1005 | $1,837 | $1.83 | 2d | 10 | 0.74mi |
| 2403 21st Ave W Bradenton, FL | 1.0 | 1.0 | 600 | $1,400 | $2.33 | 24d | 1 | 0.75mi |
| 919 34th Ave W Bradenton, FL | 3.0 | 1.0 | 950 | $1,599 | $1.68 | 12d | 1 | 0.79mi |
| 907 34th Ave W Unit B Bradenton, FL | 3.0 | 1.0 | 1000 | $1,795 | $1.79 | 24d | 1 | 0.82mi |
| 907 34th Ave W Bradenton, FL | 3.0 | 1.0 | 985 | $1,599 | $1.62 | 20d | 1 | 0.82mi |
| 2002 20th St W Unit B Bradenton, FL | 1.0 | 1.0 | 600 | $1,000 | $1.67 | 16d | 1 | 0.84mi |
| 2409 13th St W Apt 2 Bradenton, FL | 2.0 | 1.0 | 770 | $1,175 | $1.53 | 24d | 1 | 0.88mi |
| 2422 11th St W Bradenton, FL | 2.0 | 1.0 | 900 | $1,445 | $1.61 | 24d | 1 | 0.91mi |
| 4705 27th St W Unit A Bradenton, FL | 2.0 | 1.0 | 750 | $1,325 | $1.77 | 3d | 1 | 0.92mi |
| 1912 19th Ave W Unit 1912 Bradenton, FL | 2.0 | 1.0 | 800 | $1,395 | $1.74 | 24d | 1 | 0.93mi |
| 2127 13th St W Unit B Bradenton, FL | 1.0 | 1.0 | 700 | $1,149 | $1.64 | 24d | 1 | 0.96mi |
| 1505 18th Avenue Dr W Bradenton, FL | 3.0 | 1.0 | 886 | $1,875 | $2.12 | 16d | 1 | 1.03mi |
| 2117 11th St W Bradenton, FL | 1.0 | 1.0 | 850 | $1,295 | $1.52 | 24d | 1 | 1.03mi |
| 2017 12th St W Bradenton, FL | 1.0 | 1.0 | 720 | $1,300 | $1.81 | 24d | 1 | 1.04mi |
| 4812 27th St W Bradenton, FL | 2.0 | 2.0 | 912 | $1,599 | $1.75 | 12d | 1 | 1.04mi |
| 4812 27th St W Unit 4812 Bradenton, FL | 2.0 | 2.0 | 912 | $1,545 | $1.69 | 12d | 1 | 1.04mi |
| 2244 9th St W Bradenton, FL | 1.0–2.0 | 1.0–2.0 | 768 | $1,323 | $1.72 | 24d | 4 | 1.04mi |
| 505 30th Ave W Unit E406 Bradenton, FL | 2.0 | 2.0 | 1001 | $1,450 | $1.45 | 24d | 1 | 1.07mi |
| 2004 49th Ave W Unit 2002 Bradenton, FL | 2.0 | 2.0 | 1021 | $1,950 | $1.91 | 24d | 1 | 1.08mi |
| 4906 21st St W Bradenton, FL | 2.0 | 1.0 | 918 | $1,700 | $1.85 | 16d | 1 | 1.08mi |
| 1418 18th Avenue Dr W Unit 1418 Bradenton, FL | 3.0 | 2.0 | 1000 | $1,900 | $1.90 | 24d | 1 | 1.09mi |
| 515 30th Ave W Bradenton, FL | 2.0 | 2.0 | 1001 | $1,375 | $1.37 | 16d | 2 | 1.09mi |
| 4325 40th St W Bradenton, FL | 1.0–2.0 | 1.0–2.0 | 775 | $1,675 | $2.16 | 10d | 9 | 1.11mi |
| 4906 25th St W #101 Bradenton, FL | 2.0 | 1.5 | 1070 | $1,550 | $1.45 | 24d | 1 | 1.11mi |
| 805 22nd Ave W Bradenton, FL | 1.0 | 1.0 | 790 | $1,200 | $1.52 | 24d | 1 | 1.12mi |
| 390 301 Blvd W Bradenton, FL | 2.0 | 2.0 | 1125 | $1,495 | $1.33 | 24d | 1 | 1.12mi |
| 2835 50th Ave W Bradenton, FL | 1.0–2.0 | 1.0–2.0 | 850 | $1,610 | $1.89 | 3d | 16 | 1.14mi |
HOA detail condo
- Monthly dues
- $569 · $6,828/yr
- Assessments
- None detected in remarks — confirm with the listing agent.
Listing history 11 events
-
2026-06-18days on market $60,000 Active 15 DOM
-
2026-06-17days on market $60,000 Active 14 DOM
-
2026-06-16days on market $60,000 Active 13 DOM
-
2026-06-15days on market $60,000 Active 12 DOM
-
2026-06-13days on market $60,000 Active 10 DOM
-
2026-06-13days on market $60,000 Active 9 DOM
-
2026-06-10days on market $60,000 Active 7 DOM
-
2026-06-09days on market $60,000 Active 6 DOM
-
2026-06-08days on market $60,000 Active 5 DOM
-
2026-06-07remarks 274-char remark
-
2026-06-07$60,000 Active 4 DOM
ⓘ Source: listings_history table (triggers on properties + properties_extension) + one-shot
backfill from property_details.listing_events for pre-trigger history.
Tax reassessment forecast FL · Resets to sale price
- Current annual tax
- $1,608 · $134/mo
- Projected year-2 tax
- $1,608 · $134/mo
- Expected delta
- $0/yr ($0/mo · 0.0%)
ⓘ Screening estimate from a state-policy table — verify with the county assessor before closing.
Climate risk First Street
- Flood 3/10 Moderate FEMA zone X (unshaded) · 20% chance over 30 yrs
- Wildfire 1/10 Low
- Heat 10/10 Extreme 7 d/yr ≥107°F today · 31 d/yr by 30 yrs out
- Wind 10/10 Extreme 99% chance of damaging wind over 30 yrs
- Air quality 3/10 Moderate 2 unhealthy d/yr today · 2 by 30 yrs out
Nearby sold comps map
Loading sold comps map…
Walkable amenities ~0.75 mi
Loading nearby amenities…
Taxation est. · year 1
- Rental income
- $17,938
- − Mortgage interest
- −$3,361
- − Property taxes
- −$1,608
- − Insurance
- −$300
- − Repairs & maintenance
- −$1,435
- − Management
- −$1,435
- − HOA
- −$6,828
- − Depreciation
- −$1,745
- Taxable income
- $1,225
- Est. tax owed @ 24.0%
- −$294
- After-tax cash flow
- $1,365/yr
For passive investors: Depreciation is non-cash, so a rental often shows a tax loss while cash-flowing — sheltering income. Rental losses are passive: they offset passive income freely, and up to $25,000/yr can offset ordinary (W-2) income if you actively participate and your MAGI is under $100k (phasing out to $0 by $150k); unused losses carry forward. On sale, claimed depreciation is recaptured at up to 25%, and gains may owe capital-gains tax (a 1031 exchange can defer both). Figures are a year-1 estimate at your 24.0% rate — not tax advice; consult a CPA.
Schools (NCES district)
- District
- Manatee
- NCES district ID
- 1201230
- Math proficiency
- 54% ▼ -6.00%
- Reading proficiency
- 50% ▼ -2.00%
- Median HH income
- $49,607
- Composite
- 44.43/100
- National rank
- #2806
- State rank
- #26 of 73 in FL
Livability — South Bradenton
- Score
- 77/100
- State rank
- #195
- US rank
- #3092
Category grades
Schools grade is shown separately in the Schools card above.
Census & demographics
- Census place
- South Bradenton, FL
- County
- Manatee County · 416,364 people
- Metro
- North Port-Sarasota-Bradenton, FL
- Population (ZIP)
- 31,946
- Household income
- $52,525
- Rent vs Own
- Severe rent burden
- 1736.0
Population outlook (Manatee County) Hauer SSP2
- Today (2025)
- 447,342 people
- By 2030
- 488,911 · +9.3%
- By 2040
- 567,934 · +27.0%
- By 2050
- 637,995 · +42.6%
- By 2075
- 781,970 · +74.8%
- By 2100
- 848,272 · +89.6%
Race, ethnicity, and origin ACS 2023
- Neighborhood character
- Predominantly White (65%)
- Race & ethnicity
- White 65% Hispanic / Latino 18% Black 10% Two or more races 9% Asian 2% Native American 1%
- Hispanic origin (detail)
- Mexican 7% Puerto Rican 4% Cuban 1%
- Common ancestry
- Hispanic 2% Romanian 2% Lithuanian 2%
- Foreign-born
- 15% · Canada, Vietnam
- Languages at home
- 78% English-only · Spanish 14% French/Haitian/Cajun 2% German/W. Germanic 1%
Political lean MEDSL · Manatee
- 2024 margin
- Strong R (+23.5) · D 37.9% · R 61.4%
- 2008→2024 swing
- -16.5pp toward R · 2008: -7.0pp · 2024: -23.5pp
- All cycles
- 2024: R+23.5 2020: R+16.1 2016: R+17.1 2012: R+12.5 2008: R+7.0
Not yet ingested
- Civics
- —
Market trends
- HPI YoY
- ▼ -310.18%
- Current HPI
- 369.8239
- Rent YoY
- ▼ -2.43%
- Metro
- North Port-Sarasota-Bradenton, FL
- State GDP YoY
- ▲ 3.28%
- F500 in state
- 36
Industry mix (Fortune 500 HQ in FL)
| Industry | F500 HQs | Revenue |
|---|---|---|
| Industrial Technology | 2 | $29B |
|
||
| Insurance | 2 | $17B |
|
||
| Retail | 1 | $60B |
|
||
| Technology Distribution | 1 | $58B |
|
||
| Homebuilding | 1 | $35B |
|
||
| Technology Manufacturing | 1 | $35B |
|
||
Price history
+69.0% since first listed47 events — show timeline
- 2026-06-03 Listed $60,000 Stellar MLS as Distributed by MLS Grid
- 2025-10-15 Listing Removed — Stellar MLS as Distributed by MLS Grid
- 2025-10-10 Price Changed $99,000 Stellar MLS as Distributed by MLS Grid
- 2025-09-18 Listed $100,000 Stellar MLS as Distributed by MLS Grid
- 2025-06-27 Listing Removed — Stellar MLS as Distributed by MLS Grid
- 2025-06-13 Relisted — Stellar MLS as Distributed by MLS Grid
- 2025-06-13 Price Changed $109,950 Stellar MLS as Distributed by MLS Grid
- 2025-06-13 Listing Removed — Stellar MLS as Distributed by MLS Grid
- 2025-06-03 Listed $109,950 Stellar MLS as Distributed by MLS Grid
- 2025-05-21 Listing Removed — Stellar MLS as Distributed by MLS Grid
- 2025-05-11 Price Changed $115,000 Stellar MLS as Distributed by MLS Grid
- 2025-03-11 Relisted — Stellar MLS as Distributed by MLS Grid
- 2025-03-10 Pending — Stellar MLS as Distributed by MLS Grid
- 2025-03-06 Relisted — Stellar MLS as Distributed by MLS Grid
- 2025-01-27 Pending — Stellar MLS as Distributed by MLS Grid
- 2025-01-23 Price Changed $117,000 Stellar MLS as Distributed by MLS Grid
- 2024-11-22 Listed $134,950 Stellar MLS as Distributed by MLS Grid
- 2024-09-19 Listing Removed — Stellar MLS as Distributed by MLS Grid
- 2024-08-03 Price Changed $118,000 Stellar MLS as Distributed by MLS Grid
- 2024-07-27 Price Changed $119,990 Stellar MLS as Distributed by MLS Grid
- 2024-07-22 Price Changed $129,990 Stellar MLS as Distributed by MLS Grid
- 2024-06-18 Price Changed $149,990 Stellar MLS as Distributed by MLS Grid
- 2024-06-04 Price Changed $159,990 Stellar MLS as Distributed by MLS Grid
- 2024-06-04 Listed $160,000 Stellar MLS as Distributed by MLS Grid
- 2022-07-27 Sold (Public Records) $149,000 Public Records
- 2022-07-25 Sold (MLS) $149,000 Stellar MLS as Distributed by MLS Grid
- 2022-05-27 Pending — Stellar MLS as Distributed by MLS Grid
- 2022-05-17 Price Changed $159,900 Stellar MLS as Distributed by MLS Grid
- 2022-04-07 Listed $165,000 Stellar MLS as Distributed by MLS Grid
- 2014-08-25 Sold (Public Records) $41,900 Public Records
- 2014-08-08 Sold (MLS) $41,900 Stellar MLS as Distributed by MLS Grid
- 2014-06-10 Listing Removed — Stellar MLS as Distributed by MLS Grid
- 2014-06-01 Relisted — Stellar MLS as Distributed by MLS Grid
- 2014-06-01 Contingent — Stellar MLS as Distributed by MLS Grid
- 2014-06-01 Relisted — Stellar MLS as Distributed by MLS Grid
- 2014-06-01 Pending — Stellar MLS as Distributed by MLS Grid
- 2014-06-01 Price Changed $41,900 Stellar MLS as Distributed by MLS Grid
- 2014-01-26 Listed $42,500 Stellar MLS as Distributed by MLS Grid
- 2013-04-07 Listed $46,500 Stellar MLS as Distributed by MLS Grid
- 2013-01-14 Sold (MLS) $20,000 Stellar MLS as Distributed by MLS Grid
- 2012-04-11 Listed $27,960 Stellar MLS as Distributed by MLS Grid
- 2007-05-18 Listed $99,500 Stellar MLS as Distributed by MLS Grid
- 2006-07-24 Listed $110,000 Stellar MLS as Distributed by MLS Grid
- 2005-09-01 Listed $124,900 Stellar MLS as Distributed by MLS Grid
- 2000-11-01 Sold (Public Records) $39,000 Public Records
- 2000-11-01 Sold (Public Records) $39,000 Public Records
- 1981-06-01 Sold (Public Records) $35,500 Public Records
Property tax history
+7.6%/yrLatest (2025): $1,608 · -19.3% YoY. Source: county tax records.
Cash-flow waterfall
monthlySold comps — $/sqft
last 12 mo · ≤1 miLoading sold comps…