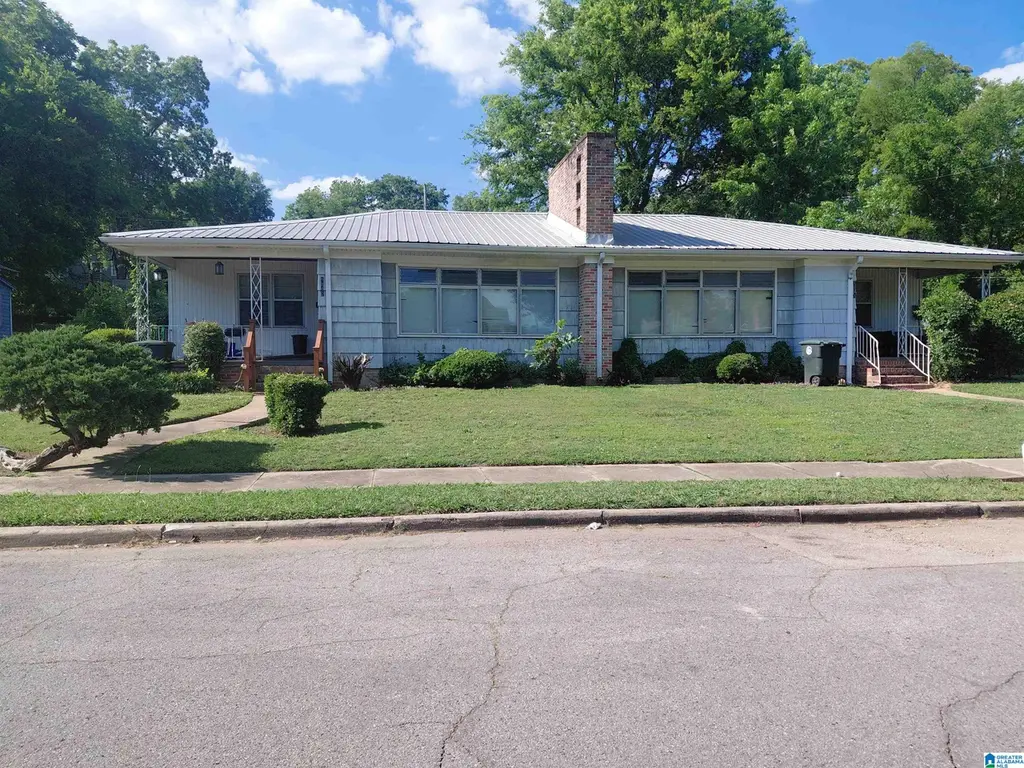
1842 32nd St · Birmingham, AL
Flood risk 1/10 · Minimal
- FEMA flood zone
- X (unshaded)
- Chance of flooding over 30 yrs
- 0.0%
- Est. flood insurance / yr
- $507 – $1,088
Fire risk 1/10 · Minimal
- Est. fire insurance / yr
- $916 – $1,700
Heat risk 7/10 · Major
- Hot days now (above 106°F)
- 7 days/yr
- Hot days in 30 yrs
- 19 days/yr
Wind risk 6/10 · Moderate
- Chance of severe wind over 30 yrs
- 27.0%
Air-quality risk 4/10 · Minor
- Unhealthy air days now
- 5 days/yr
- Unhealthy air days in 30 yrs
- 5 days/yr
Risk factors via First Street. Map © Google.
Why this score? — see what drove the D grade
The composite is a weighted blend of 9 inputs, each scored 0–100. Each bar is that input's sub-score; the figure is the points it added to the 100-point composite (weight × sub-score).
- Cash flow +14.7/30.0
- ARV discount +7.5/15.0
- DSCR +4.5/10.0
- 1% rule +4.3/10.0
- Rent growth +4.3/5.0
- Livability +3.4/5.0
- Condition / age +2.5/5.0
- Schools +0.9/10.0
- Appreciation +0.0/10.0
$154,900
🖨 Deal sheet (PDF) 📄 Offer letter ✓ Due diligence
Listing remarks
Great Investment opportunity in the heart of Ensley near 5 points west! This income-producing duplex features two spacious units, each offering 2 bedrooms, 1 bath, living room, eating area, and fenced backyard space. Situated on a desirable corner lot, both units are currently tenant occupied, providing immediate rental income for investors. Conveniently located near schools, shopping, and major roadways. Whether you're looking to expand your rental portfolio or secure a solid cash-flowing property, this duplex is a must-see opportunity!
Key facts
- Corner lot
- Conveniently located
- Built 1955
Tags
Property features AI
Finance
- Other: One total unit (1 unit); Unit size reported as 1200 (unit-level); Furnished: None
- Financial info: Monthly expenses listed (per month): 140
Exterior
- Parking: On-street parking
- Utilities: Public water; Connected sewer; Owner does not pay utilities; Tenant pays all utilities
- Home design: Existing construction; Duplex (single unit shown); Minor subdivision: ENSLEY
- Construction: Frame construction with siding; Crawl space foundation
- Exterior features: Corner lot location; Not in flood plain
Interior
- Kitchen: Stove
- Bedrooms: 2 bedrooms
- Flooring: Laminate; Some hardwood
- Bathrooms: 1 full bathroom
- Heating & cooling: Central heating; Central cooling
- Interior features: Laminate and some hardwood flooring; Separate living and dining areas; Eating area in kitchen
- Laundry & utility: Electric water heater
Neighborhood map
What this means for you Summary
Snapshot
- This is a 4-bed/1.0-bath single-family listed at $155k.
Deal economics
- At list price, monthly cash flow is $40 ($474/yr) — positive.
- The deal already cash-flows at list — no discount required.
- To meet the 1% rule (rent ≥ 1% of price), the offer needs to be $145k (6.6% below list).
- Recommended offer: $145k (6.6% below list) — sets the bar for 1% rule.
Location & tenants
- Location reads 67/100 on livability (#78 in AL) — a middle-class / working-renter tenant base. Strengths: commute A+, cost of living A+, housing A+; Watch: amenities C-, crime F, employment F.
- Birmingham City (urban): math 4% / reading 20% proficiency, ranked #116 of 129 in AL (top 90%) — low school quality limits family demand, transient renter base, plan for 1-2y turnover; 82% free/reduced lunch — lower-income household profile, screen leases tightly.
- Zoned schools: Minor Elementary School (math 0% / reading 14%, grade F, #601 of 627 statewide, top 98%, 454 students, 90% FRL).
- Market conditions: Rents rising fast (+7.2%/yr); 126 active listings in the ZIP; 27 comparable units currently listed for rent nearby; rentals at typical pace (median 26d on market — plan ~3-4 weeks tenant-placement turnaround); lower-income renter base — watch delinquency; 2,114 units permitted in Jefferson County in 2024 (556 in 5+ unit buildings).
- At $1,446/mo this rent would consume 45% of the median local household income ($39k/yr) (locally 573% of renters already pay >50% of income on rent) — very limited rent-growth headroom before tenants either downsize or default.
Forward outlook
- Local home prices are declining (-3.0%/yr); year-one equity from $1k of loan paydown is wiped out by about $5k of value loss. Plan a longer hold.
- Jefferson County population projected to shrink 4% by 2050 — rents likely to lag national; underwrite the cash flow, not the appreciation.
Negotiation context
- It's been on market 26 days — a 2% lower offer ($153k) is reasonable based on typical stale-listing flexibility.
- 2 sale attempts since 3y ago with the ask held roughly flat each time — persistent listings suggest the price (not the market) is what's stuck; bring a comps-based counter.
Risks & watch-outs
- Watch-outs: built in 1955 — expect roof / HVAC / electrical / plumbing capex.
- Climate carrying-cost: major wind risk, 27% chance of damaging wind over 30y; extreme-heat days projected 7→19/yr by 2055 (HVAC capex compounding) — expect insurance premiums to compound above CPI over the hold.
Questions for the listing agent
- Built in 1955 — when were the roof, HVAC, electrical panel, plumbing, and water heater last replaced?
- Is there a deadline driving the sale (1031 exchange, divorce, estate, relocation)? That informs how much negotiation room exists.
- Schools are F-rated, which usually means shorter tenancies and higher turnover. Who's the typical renter profile here, and what's been the actual vacancy rate?
- Crime grade is F in this area — have there been break-ins, vandalism, or insurance claims at this property in the last 3 years? What carrier currently insures it and at what premium?
- The area grade is low — what's the realistic commute time and amenity access for the typical tenant pool here? Any planned neighborhood developments (good or bad) we should know about?
- What's the average days-on-market for RENTAL listings here right now (not sales)? A rising rental-DOM trend means longer vacancies and softer asking-rent achievability than the comps imply.
- What's the recent tenant-quality profile in this submarket — average credit score on applications, eviction rate, late-payment / NSF rate, and stable-employment percentage? A property-management company in the area should have these aggregated.
- How much new for-sale + rental construction is in the pipeline within 1–3 miles? Heavy new supply typically softens prices + rents 12–24 months out; constrained supply supports both.
Investment metrics
- 1% rule
- 0.93% ✗
- Cap rate
- 6.60%
- Cash-on-cash
- 1.09%
- DSCR
- 1.05
- GRM
- 8.9
CMA / ARV
- ARV (on-the-fly)
- $90,502
- Comps found
- 10
Show comp detail 10 sales within ~0.75 mi
| Address | Dist | Beds/Ba | Sqft | Sold | Price | $/sf | Match |
|---|---|---|---|---|---|---|---|
| 1500 32nd St | 0.46mi | 3/2.5 (-1) | 2,424 (-1%) | 12mo | $78,000 | $32 | 56 |
| 1319 31st Street Ensley | 0.67mi | 4/2.0 | 2,374 (-3%) | 7mo | $87,000 | $37 | 54 |
| 1741 26th St | 0.41mi | 4/2.0 | 2,225 (-9%) | 10mo | $198,900 | $89 | 54 |
| 2204 28th St W | 0.34mi | 4/1.0 | 2,727 (+12%) | 15mo | $39,500 | $14 | 52 |
| 2608 Court R | 0.40mi | 4/2.0 | 2,166 (-11%) | 20mo | $179,000 | $83 | 42 |
| 1511 43rd St | 0.67mi | 3/2.5 (-1) | 2,627 (+7%) | 7mo | $86,500 | $33 | 39 |
| 1409 32nd St | 0.57mi | 5/3.0 (+1) | 2,340 (-4%) | 17mo | $295,000 | $126 | 39 |
| 1349 41st St | 0.72mi | 3/2.0 (-1) | 2,663 (+9%) | 18mo | $75,000 | $28 | 28 |
| 1401 29th St W | 0.63mi | 3/1.5 (-1) | 2,104 (-14%) | 21mo | $37,500 | $18 | 23 |
| 1348 41st St | 0.70mi | 3/2.0 (-1) | 2,098 (-14%) | 16mo | $259,900 | $124 | 21 |
Match score weights: distance 35% · size 25% · config 20% · recency 20%. Top-matched comps best support the ARV.
Projected returns pro-forma
-3.0% appreciation · 7.24% rent growth · sell at horizon
- IRR
- -9.7%
- Equity multiple
- 0.63×
- Total profit
- $-16,109
- Equity at exit
- $23,096
- IRR
- 4.8%
- Equity multiple
- 1.42×
- Total profit
- $18,196
- Equity at exit
- $13,393
Cash invested: $43,372 (down + closing). Projections, not guarantees.
Landlord ↔ Tenant lean methodology
- Overall (STATE)
- 90 Strongly Landlord-Friendly
- State Alabama
- 90 Strongly Landlord-Friendly · R+15
- County
- — inherits STATE
- City
- — inherits STATE
ZIP-level market 35208
- Home prices YoY
- -18.1%
- Rents YoY
- 7.2%
- Active inventory
- 126
- Price-to-rent
- 8.9×
Monthly cashflow live
- Estimated rent
- $1,446 high interval (Pro) →
- Mortgage (P&I)
- −$812
- Tax from tax record
- −$226 /mo · $2,713/yr
- Insurance
- −$65
- HOA
- −$0
- Vacancy / Maint / Mgmt
- −$304
- Net cashflow
- $40
Break-even live
Sensitivity live
| Price | -10% $127 | -5% $83 | +0% $40 | +5% $-4 | +10% $-48 |
|---|---|---|---|---|---|
| Rent | -10% $-75 | -5% $-18 | +0% $40 | +5% $97 | +10% $154 |
| Rate | -1.0pp $118 | -0.5pp $79 | base $40 | +0.5pp $-1 | +1.0pp $-41 |
UW: 25.0% down · 7.5% · 30yr · 1.5% tax · 5.0% vac · 8.0% maint · 8.0% mgmt
Financing live
Cash to close
- Down payment
- $38,725
- Closing costs
- $4,647
- Reserves months
- —
- Total cash needed
- —
Loan-product check · same deal, 3 products live
Conventional
25% down · 7.5% · 30yr
- Down + closing
- —
- Monthly P&I
- —
- Monthly cashflow
- —
- DSCR
- —
- Eligible?
- —
Personal DTI + credit; lowest rate.
DSCR
20% down · 8.5% · 30yr
- Down + closing
- —
- Monthly P&I
- —
- Monthly cashflow
- —
- DSCR
- —
- Eligible?
- —
No personal income docs; deal must DSCR.
Hard money
10% down · 12.0% · 12mo
- Down + closing
- —
- Monthly P&I
- —
- Monthly cashflow
- —
- DSCR
- —
- Eligible?
- —
Short-term bridge; refi at stabilization.
Rent comps 27 comps
| Address | Beds | Baths | Sqft | Rent | $/sqft | DOM | Units | Dist |
|---|---|---|---|---|---|---|---|---|
| 4612 Terrace S Birmingham, AL | 3.0 | 1.0 | 1612 | $1,050 | $0.65 | 45d | 1 | 0.36mi |
| 1633 29th Street Ensley Birmingham, AL | 3.0 | 2.0 | 1658 | $1,200 | $0.72 | 45d | 1 | 0.37mi |
| 4636 Avenue T Unit T Birmingham, AL | 4.0 | 1.5 | 1842 | $1,500 | $0.81 | 3d | 1 | 0.38mi |
| 4105 Avenue Q Unit Q Birmingham, AL | 3.0 | 3.0 | 1760 | $1,250 | $0.71 | 5d | 1 | 0.42mi |
| 2348 Court R Birmingham, AL | 3.0 | 2.0 | 1792 | $1,769 | $0.99 | 3d | 1 | 0.48mi |
| 2348 Court R Birmingham, AL | 3.0 | 2.0 | 2400 | $1,639 | $0.68 | 21d | 1 | 0.48mi |
| 2436 Avenue S Birmingham, AL | 4.0 | 2.0 | 1800 | $1,400 | $0.78 | 5d | 1 | 0.51mi |
| 1526 42nd Street Ensley Unit ENSLEY Birmingham, AL | 4.0 | 1.5 | 1600 | $1,050 | $0.66 | 45d | 1 | 0.59mi |
| 1468 Pike Rd Birmingham, AL | 5.0 | 2.0 | 1729 | $1,385 | $0.80 | 45d | 1 | 0.62mi |
| 1563 Martin Ave Birmingham, AL | 4.0 | 2.0 | 1848 | $1,495 | $0.81 | 3d | 1 | 0.84mi |
| 2335 20th Place Ensley Birmingham, AL | 5.0 | 2.0 | 1800 | $1,850 | $1.03 | 25d | 1 | 0.85mi |
| 2335 20th Place Ensley Birmingham, AL | 5.0 | 2.0 | 1800 | $1,850 | $1.03 | 13d | 1 | 0.85mi |
| 2511 20th Place Ensley Unit ENSLEY Birmingham, AL | 5.0 | 2.0 | 1794 | $1,400 | $0.78 | 5d | 1 | 0.88mi |
| 1900 Saint Charles Ave SW Birmingham, AL | 4.0 | 2.0 | 1623 | $1,350 | $0.83 | 4d | 1 | 0.93mi |
| 200 23rd St SW Birmingham, AL | 5.0 | 1.0 | 1858 | $1,400 | $0.75 | 45d | 1 | 0.93mi |
| 1345 46th Street Ensley Unit ENSLEY Birmingham, AL | 3.0 | 2.0 | 1617 | $1,175 | $0.73 | 5d | 1 | 0.93mi |
| 2720 23rd Street Ensley Birmingham, AL | 4.0 | 2.0 | 1692 | $1,500 | $0.89 | 21d | 1 | 0.94mi |
| 2722 Avenue I Unit I Ensley, AL | 4.0 | 1.0 | 1578 | $1,000 | $0.63 | 45d | 1 | 1.02mi |
| 1872 Princeton Ct SW Birmingham, AL | 5.0 | 2.0 | 1829 | $1,700 | $0.93 | 25d | 1 | 1.02mi |
| 1430 19th Street Ensley Birmingham, AL | 5.0 | 2.0 | 1976 | $1,300 | $0.66 | 45d | 1 | 1.06mi |
| 2920 24th Street Ensley Unit ENSLEY Birmingham, AL | 3.0 | 2.0 | 1800 | $1,050 | $0.58 | 25d | 1 | 1.11mi |
| 1417 Bessemer Rd Birmingham, AL | 3.0 | 1.0 | 1688 | $1,200 | $0.71 | 45d | 1 | 1.11mi |
| 2714 17th Street Ensley Birmingham, AL | 4.0 | 2.0 | 1976 | $1,553 | $0.79 | 5d | 1 | 1.13mi |
| 504 Francis Pl SW Birmingham, AL | 3.0 | 2.0 | 1816 | $1,223 | $0.67 | 25d | 1 | 1.14mi |
| 2523 16th street Ensley Unit ENSLEY Birmingham, AL | 4.0 | 2.0 | 1584 | $1,300 | $0.82 | 45d | 1 | 1.20mi |
| 1701 4th Ter W Birmingham, AL | 4.0 | 2.5 | 1977 | $1,550 | $0.78 | 25d | 1 | 1.29mi |
| 2320 Wesley Ave SW Birmingham, AL | 4.0 | 1.0 | 1865 | $1,200 | $0.64 | 12d | 1 | 1.42mi |
Listing history 17 events
-
2026-06-21days on market $154,900 Active 26 DOM
-
2026-06-18days on market $154,900 Active 23 DOM
-
2026-06-17days on market $154,900 Active 22 DOM
-
2026-06-16days on market $154,900 Active 21 DOM
-
2026-06-15days on market $154,900 Active 20 DOM
-
2026-06-13days on market $154,900 Active 18 DOM
-
2026-06-10days on market $154,900 Active 15 DOM
-
2026-06-09days on market $154,900 Active 14 DOM
-
2026-06-08days on market $154,900 Active 13 DOM
-
2026-06-07days on market $154,900 Active 12 DOM
-
2026-06-03days on market $154,900 Active 8 DOM
-
2026-06-02days on market $154,900 Active 7 DOM
-
2026-06-01days on market $154,900 Active 6 DOM
-
2026-05-31days on market $154,900 Active 5 DOM
-
2026-05-14$154,900 Active
-
2023-09-25historical $600
-
2023-09-05$600
ⓘ Source: listings_history table (triggers on properties + properties_extension) + one-shot
backfill from property_details.listing_events for pre-trigger history.
Tax reassessment forecast AL · Resets to sale price
- Current annual tax
- $2,713 · $226/mo
- Projected year-2 tax
- $2,713 · $226/mo
- Expected delta
- $0/yr ($0/mo · -0.0%)
ⓘ Screening estimate from a state-policy table — verify with the county assessor before closing.
Climate risk First Street
- Flood 1/10 Low FEMA zone X (unshaded) · 0% chance over 30 yrs
- Wildfire 1/10 Low
- Heat 7/10 Severe 7 d/yr ≥106°F today · 19 d/yr by 30 yrs out
- Wind 6/10 Major 27% chance of damaging wind over 30 yrs
- Air quality 4/10 Moderate 5 unhealthy d/yr today · 5 by 30 yrs out
Nearby sold comps map
Loading sold comps map…
Walkable amenities ~0.75 mi
Loading nearby amenities…
Taxation est. · year 1
- Rental income
- $17,354
- − Mortgage interest
- −$8,677
- − Property taxes
- −$2,713
- − Insurance
- −$774
- − Repairs & maintenance
- −$1,388
- − Management
- −$1,388
- − Depreciation
- −$4,506
- Taxable loss
- −$2,093
- Est. tax savings @ 24.0%
- +$502
- After-tax cash flow
- $977/yr
For passive investors: Depreciation is non-cash, so a rental often shows a tax loss while cash-flowing — sheltering income. Rental losses are passive: they offset passive income freely, and up to $25,000/yr can offset ordinary (W-2) income if you actively participate and your MAGI is under $100k (phasing out to $0 by $150k); unused losses carry forward. On sale, claimed depreciation is recaptured at up to 25%, and gains may owe capital-gains tax (a 1031 exchange can defer both). Figures are a year-1 estimate at your 24.0% rate — not tax advice; consult a CPA.
Schools (NCES district)
- District
- Birmingham City
- NCES district ID
- 0100390
- Math proficiency
- 4% ▼ -17.00%
- Reading proficiency
- 20% ▼ -4.00%
- Median HH income
- $31,988
- Composite
- 9.49/100
- National rank
- #9850
- State rank
- #116 of 129 in AL
Livability — Birmingham
- Score
- 67/100
- State rank
- #78
- US rank
- #10412
Category grades
Schools grade is shown separately in the Schools card above.
Census & demographics
- Census place
- Birmingham, AL
- County
- Jefferson County · 527,445 people
- City population
- 210,422
- Metro
- Birmingham-Hoover, AL
- Population (ZIP)
- 13,412
- Household income
- $38,561
- Rent vs Own
- Severe rent burden
- 573.0
Population outlook (Jefferson County) Hauer SSP2
- Today (2025)
- 669,185 people
- By 2030
- 669,694 · +0.1%
- By 2040
- 661,388 · -1.2%
- By 2050
- 643,086 · -3.9%
- By 2075
- 577,267 · -13.7%
- By 2100
- 474,758 · -29.1%
Race, ethnicity, and origin ACS 2023
- Neighborhood character
- Predominantly Black (94%)
- Race & ethnicity
- Black 94% White 4% Hispanic / Latino 2% Two or more races 1%
- Foreign-born
- 3% · Canada
- Languages at home
- 96% English-only · Spanish 2%
Political lean MEDSL · Jefferson
- 2024 margin
- D (+10.4) · D 54.6% · R 44.2% · Other 1.2%
- 2008→2024 swing
- +5.4pp toward D · 2008: 5.1pp · 2024: 10.4pp
- All cycles
- 2024: D+10.4 2020: D+13.2 2016: D+7.2 2012: D+6.0 2008: D+5.1
Not yet ingested
- Civics
- —
Market trends
- HPI YoY
- ▼ -33.99%
- Current HPI
- 153.414
- Rent YoY
- ▲ 7.24%
- Metro
- Birmingham-Hoover, AL
- State GDP YoY
- ▲ 2.94%
- F500 in state
- 4
Industry mix (Fortune 500 HQ in AL)
| Industry | F500 HQs | Revenue |
|---|---|---|
| Financial Services | 1 | $8B |
|
||
| Healthcare | 1 | $5B |
|
||
Price history
3 events — show timeline
- 2026-05-14 Listed $154,900 Greater Alabama MLS
- 2023-09-25 Rental Removed $600 LEASESTAR
- 2023-09-05 Listed for Rent $600 LEASESTAR
Property tax history
+0.0%/yrLatest (2025): $2,713 · +0.0% YoY. Source: county tax records.
Cash-flow waterfall
monthlySold comps — $/sqft
last 12 mo · ≤1 miLoading sold comps…