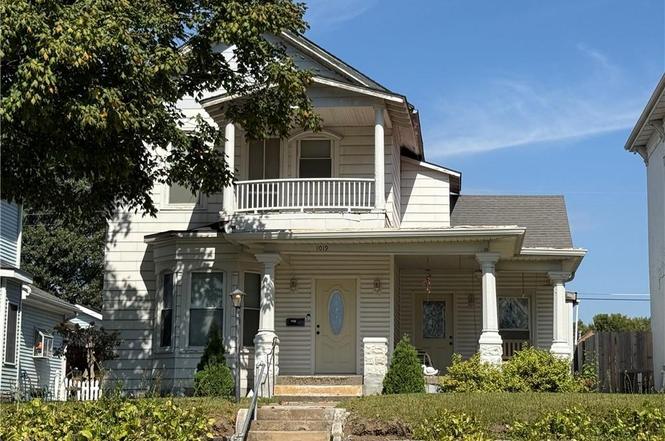
1019 Kansas Ave · Atchison, KS
Flood risk 1/10 · Minimal
- FEMA flood zone
- X (unshaded)
- Chance of flooding over 30 yrs
- 0.0%
- Est. flood insurance / yr
- $473 – $860
Fire risk 4/10 · Minor
- Est. fire insurance / yr
- $1,154 – $2,142
Heat risk 4/10 · Minor
- Hot days now (above 108°F)
- 7 days/yr
- Hot days in 30 yrs
- 17 days/yr
Wind risk 2/10 · Minimal
- Chance of severe wind over 30 yrs
- —
Air-quality risk 2/10 · Minimal
- Unhealthy air days now
- 0 days/yr
- Unhealthy air days in 30 yrs
- 1 days/yr
Risk factors via First Street. Map © Google.
Why this score? — see what drove the C+ grade
The composite is a weighted blend of 9 inputs, each scored 0–100. Each bar is that input's sub-score; the figure is the points it added to the 100-point composite (weight × sub-score).
- Cash flow +22.4/30.0
- ARV discount +15.0/15.0
- DSCR +7.2/10.0
- 1% rule +6.0/10.0
- Livability +3.3/5.0
- Rent growth +2.5/5.0
- Condition / age +2.5/5.0
- Schools +1.8/10.0
- Appreciation +0.0/10.0
$139,000
🖨 Deal sheet 📄 Offer letter ✓ Due diligence
Key facts
- 6,098 sq ft lot
- 2 garage spots
- Built 1900
Property features AI
Finance
- Other: Listed by Gateway Real Estate & Auction
Exterior
- Parking: Detached carport; Detached 2-car garage
- Utilities: Public water; Public sewer
- Home design: Single-family residential; Frame construction; Composition roof; Above-grade finished area about 1,700 (per public records); Orientated on Kansas Ave (property on right from Kansas Ave)
- Construction: Frame construction; Composition roof; More than 100 years old
- Exterior features: Lot approximately 6,098 square feet
Interior
- Bedrooms: 3 bedrooms
- Bathrooms: 1 full bathroom; 1 half bathroom
- Heating & cooling: Forced air heating; Electric cooling
- Interior features: Unfinished partial basement; Two-story floor plan
Neighborhood map
What this means for you Summary
Snapshot
- This is a 2-bed/1.5-bath single-family listed at $139k.
Deal economics
- At list price, monthly cash flow is $232 ($3k/yr) — positive.
- The deal already cash-flows at list — no discount required.
- Meets the 1% rule at list price ($2k rent vs $139k).
- Recommended offer: $122k (12.0% below list) — sets the bar for market timing.
- Cap rate 8.3% vs local median 6.8% in Atchison — meaningfully above typical; check what's discounted (condition, days-on-market, listing class) to confirm the premium yield is real.
Location & tenants
- Location reads 66/100 on livability (#268 in KS) — a middle-class / working-renter tenant base. Strengths: cost of living A+, housing A+, crime A-; Watch: schools D, employment D, amenities F.
- Atchison Public Schools (town): math 18% / reading 25% proficiency, ranked #154 of 169 in KS (top 91%) — low school quality limits family demand, transient renter base, plan for 1-2y turnover.
- Market conditions: 77 active listings in the ZIP; 3 comparable units currently listed for rent nearby; rentals at typical pace (median 19d on market — plan ~3-4 weeks tenant-placement turnaround); 12 units permitted in Atchison County in 2024 (0 in 5+ unit buildings).
Forward outlook
- Local home prices are declining (-3.0%/yr); year-one equity from $961 of loan paydown is wiped out by about $4k of value loss. Plan a longer hold.
- Atchison County population projected at -14% by 2050 — secular population decline; favor cash flow + early exit over multi-decade hold.
Negotiation context
- It's been on market 233 days — a 12% lower offer ($122k) is reasonable based on typical stale-listing flexibility.
Risks & watch-outs
- Watch-outs: built in 1900 — expect roof / HVAC / electrical / plumbing capex.
Questions for the listing agent
- It's been on market 233 days. Have you received any prior offers? Is the seller open to a 12% concession, seller financing, or rate buy-down credit?
- Built in 1900 — when were the roof, HVAC, electrical panel, plumbing, and water heater last replaced?
- Why hasn't it sold? Are there any deal-killer items the seller is aware of (foundation, flood, title, zoning, code violations)?
- Is there a deadline driving the sale (1031 exchange, divorce, estate, relocation)? That informs how much negotiation room exists.
- Schools are D-rated, which usually means shorter tenancies and higher turnover. Who's the typical renter profile here, and what's been the actual vacancy rate?
- What's the average days-on-market for RENTAL listings here right now (not sales)? A rising rental-DOM trend means longer vacancies and softer asking-rent achievability than the comps imply.
- What's the recent tenant-quality profile in this submarket — average credit score on applications, eviction rate, late-payment / NSF rate, and stable-employment percentage? A property-management company in the area should have these aggregated.
- How much new for-sale + rental construction is in the pipeline within 1–3 miles? Heavy new supply typically softens prices + rents 12–24 months out; constrained supply supports both.
Investment metrics
- 1% rule
- 1.10% ✓
- Cap rate
- 8.30%
- Cash-on-cash
- 7.16%
- DSCR
- 1.32
- GRM
- 7.6
CMA / ARV
- ARV (on-the-fly)
- $176,800
- Comps found
- 12
Show comp detail 12 sales within ~0.75 mi
| Address | Dist | Beds/Ba | Sqft | Sold | Price | $/sf | Match |
|---|---|---|---|---|---|---|---|
| 121 N 10th St | 0.06mi | 3/1.5 (+1) | 1,728 (+2%) | 3mo | $65,000 | $38 | 87 |
| 1207 Atchison St | 0.26mi | 3/1.0 (+1) | 1,619 (-5%) | 2mo | $168,500 | $104 | 71 |
| 1121 Kansas Ave | 0.14mi | 3/2.0 (+1) | 1,590 (-6%) | 11mo | $165,000 | $104 | 67 |
| 219 N 12th St | 0.20mi | 3/1.5 (+1) | 1,521 (-10%) | 2mo | $219,000 | $144 | 66 |
| 1014 Ann St | 0.75mi | 1/1.0 (-1) | 1,728 (+2%) | 1mo | $99,000 | $57 | 55 |
| 915 N 9th St | 0.57mi | 3/1.0 (+1) | 1,808 (+6%) | 3mo | $225,000 | $124 | 53 |
| 413 N 7th St | 0.38mi | 3/2.5 (+1) | 1,558 (-8%) | 10mo | $109,000 | $70 | 51 |
| 1407 Commercial St | 0.41mi | 3/1.5 (+1) | 1,527 (-10%) | 11mo | $127,000 | $83 | 49 |
| 401 Parallel St | 0.60mi | 3/2.5 (+1) | 1,804 (+6%) | 12mo | $227,800 | $126 | 43 |
| 417 S 5th St | 0.61mi | 3/2.0 (+1) | 1,493 (-12%) | 6mo | $208,000 | $139 | 39 |
| 811 N 6th St | 0.63mi | 3/2.0 (+1) | 1,536 (-10%) | 11mo | $185,000 | $120 | 38 |
| 411 N 3rd St | 0.65mi | 3/2.0 (+1) | 1,935 (+14%) | 12mo | $162,000 | $84 | 29 |
Match score weights: distance 35% · size 25% · config 20% · recency 20%. Top-matched comps best support the ARV.
Projected returns pro-forma
-3.0% appreciation · 3.0% rent growth · sell at horizon
- IRR
- -5.3%
- Equity multiple
- 0.80×
- Total profit
- $-7,704
- Equity at exit
- $20,725
- IRR
- 4.4%
- Equity multiple
- 1.32×
- Total profit
- $12,461
- Equity at exit
- $12,018
Cash invested: $38,920 (down + closing). Projections, not guarantees.
Landlord ↔ Tenant lean methodology
- Overall (STATE)
- 83 Strongly Landlord-Friendly
- State Kansas
- 83 Strongly Landlord-Friendly · R+10
- County
- — inherits STATE
- City
- — inherits STATE
ZIP-level market 66002
- Active inventory
- 77
- Price-to-rent
- 7.6×
Monthly cashflow live
- Estimated rent
- $1,526 medium interval (Pro) →
- Mortgage (P&I)
- −$729
- Tax from tax record
- −$187 /mo · $2,238/yr
- Insurance
- −$58
- HOA
- −$0
- Vacancy / Maint / Mgmt
- −$320
- Net cashflow
- $232
Break-even live
UW: 25.0% down · 7.5% · 30yr · 1.5% tax · 5.0% vac · 8.0% maint · 8.0% mgmt
Financing live
Cash to close
- Down payment
- $34,750
- Closing costs
- $4,170
- Reserves months
- —
- Total cash needed
- —
Loan-product check · same deal, 3 products live
Conventional
25% down · 7.5% · 30yr
- Down + closing
- —
- Monthly P&I
- —
- Monthly cashflow
- —
- DSCR
- —
- Eligible?
- —
Personal DTI + credit; lowest rate.
DSCR
20% down · 8.5% · 30yr
- Down + closing
- —
- Monthly P&I
- —
- Monthly cashflow
- —
- DSCR
- —
- Eligible?
- —
No personal income docs; deal must DSCR.
Hard money
10% down · 12.0% · 12mo
- Down + closing
- —
- Monthly P&I
- —
- Monthly cashflow
- —
- DSCR
- —
- Eligible?
- —
Short-term bridge; refi at stabilization.
Rent comps 3 comps
| Address | Beds | Baths | Sqft | Rent | $/sqft | DOM | Units | Dist |
|---|---|---|---|---|---|---|---|---|
| 1208 Santa Fe St Atchison, KS | 3.0 | 1.0 | 1552 | $1,600 | $1.03 | 19d | 1 | 0.25mi |
| 625 St Atchison, KS | 3.0 | 2.0 | 1360 | $1,250 | $0.92 | 11d | 1 | 0.38mi |
| 928 S 6th St Atchison, KS | 3.0 | 1.5 | 1439 | $1,900 | $1.32 | 43d | 1 | 0.88mi |
Listing history 18 events
-
2026-06-18days on market $139,000 Active 233 DOM
-
2026-06-17days on market $139,000 Active 232 DOM
-
2026-06-16days on market $139,000 Active 231 DOM
-
2026-06-15days on market $139,000 Active 230 DOM
-
2026-06-13days on market $139,000 Active 228 DOM
-
2026-06-13days on market $139,000 Active 227 DOM
-
2026-06-09days on market $139,000 Active 224 DOM
-
2026-06-08days on market $139,000 Active 223 DOM
-
2026-06-07days on market $139,000 Active 222 DOM
-
2026-06-05days on market $139,000 Active 219 DOM
-
2026-06-03days on market $139,000 Active 218 DOM
-
2026-06-02days on market $139,000 Active 217 DOM
-
2026-06-01days on market $139,000 Active 216 DOM
-
2026-05-31days on market $139,000 Active 215 DOM
-
2026-05-15price $139,000
-
2026-04-17price $149,000
-
2025-10-29$160,000 Active
-
2025-09-30historical $160,000
ⓘ Source: listings_history table (triggers on properties + properties_extension) + one-shot
backfill from property_details.listing_events for pre-trigger history.
Tax reassessment forecast KS · Resets to sale price
- Current annual tax
- $2,238 · $187/mo
- Projected year-2 tax
- $2,238 · $187/mo
- Expected delta
- $0/yr ($0/mo · 0.0%)
ⓘ Screening estimate from a state-policy table — verify with the county assessor before closing.
Climate risk First Street
- Flood 1/10 Low FEMA zone X (unshaded) · 0% chance over 30 yrs
- Wildfire 4/10 Moderate
- Heat 4/10 Moderate 7 d/yr ≥108°F today · 17 d/yr by 30 yrs out
- Wind 2/10 Low
- Air quality 2/10 Low 0 unhealthy d/yr today · 1 by 30 yrs out
Nearby sold comps map
Loading sold comps map…
Walkable amenities ~0.75 mi
Loading nearby amenities…
Taxation est. · year 1
- Rental income
- $18,313
- − Mortgage interest
- −$7,786
- − Property taxes
- −$2,238
- − Insurance
- −$695
- − Repairs & maintenance
- −$1,465
- − Management
- −$1,465
- − Depreciation
- −$4,044
- Taxable income
- $619
- Est. tax owed @ 24.0%
- −$149
- After-tax cash flow
- $2,638/yr
For passive investors: Depreciation is non-cash, so a rental often shows a tax loss while cash-flowing — sheltering income. Rental losses are passive: they offset passive income freely, and up to $25,000/yr can offset ordinary (W-2) income if you actively participate and your MAGI is under $100k (phasing out to $0 by $150k); unused losses carry forward. On sale, claimed depreciation is recaptured at up to 25%, and gains may owe capital-gains tax (a 1031 exchange can defer both). Figures are a year-1 estimate at your 24.0% rate — not tax advice; consult a CPA.
Schools (NCES district)
- District
- Atchison Public Schools
- NCES district ID
- 2003540
- Math proficiency
- 18% ▼ -7.00%
- Reading proficiency
- 25% ▼ -6.00%
- Median HH income
- $43,220
- Composite
- 18.48/100
- National rank
- #8922
- State rank
- #154 of 169 in KS
Livability — Atchison
- Score
- 66/100
- State rank
- #268
- US rank
- #12122
Category grades
Schools grade is shown separately in the Schools card above.
Census & demographics
- Census place
- Atchison, KS
- County
- Atchison County · 13,276 people
- City population
- 13,276
- Metro
- Atchison, KS
- Population (ZIP)
- 13,276
- Household income
- $61,364
- Rent vs Own
- Severe rent burden
- 228.0
Population outlook (Atchison County) Hauer SSP2
- Today (2025)
- 16,056 people
- By 2030
- 15,610 · -2.8%
- By 2040
- 14,691 · -8.5%
- By 2050
- 13,856 · -13.7%
- By 2075
- 12,402 · -22.8%
- By 2100
- 10,883 · -32.2%
Race, ethnicity, and origin ACS 2023
- Neighborhood character
- Predominantly White (85%)
- Race & ethnicity
- White 85% Two or more races 6% Black 5% Hispanic / Latino 4%
- Common ancestry
- Slovak 3% Romanian 2% Lithuanian 2%
- Foreign-born
- 3% · Canada
- Languages at home
- 96% English-only · Spanish 3%
Political lean MEDSL · Atchison
- 2024 margin
- Solid R (+37.4) · D 30.3% · R 67.7% · Other 2.0%
- 2008→2024 swing
- -29.7pp toward R · 2008: -7.7pp · 2024: -37.4pp
- All cycles
- 2024: R+37.4 2020: R+34.4 2016: R+31.8 2012: R+20.8 2008: R+7.7
Not yet ingested
- Civics
- —
Market trends
- HPI YoY
- ▼ -252.16%
- Current HPI
- 192.1037
- Rent YoY
- —
- Metro
- Atchison, KS
- State GDP YoY
- —
- F500 in state
- 0
Price history
-13.1% since first listed4 events — show timeline
- 2026-05-15 Price Changed $139,000 Heartland MLS as Distributed by MLS Grid
- 2026-04-17 Price Changed $149,000 Heartland MLS as Distributed by MLS Grid
- 2025-10-29 Listed $160,000 Heartland MLS as Distributed by MLS Grid
- 2025-09-30 Coming Soon $160,000 Heartland MLS as Distributed by MLS Grid
Property tax history
+4.2%/yrLatest (2025): $2,238 · +7.4% YoY. Source: county tax records.
Cash-flow waterfall
monthlySold comps — $/sqft
last 12 mo · ≤1 miLoading sold comps…