610 Ott St · Branchville, SC
Flood risk 1/10 · Minimal
- FEMA flood zone
- X (unshaded)
- Chance of flooding over 30 yrs
- 0.0%
- Est. flood insurance / yr
- $507 – $1,088
Fire risk 5/10 · Moderate
- Est. fire insurance / yr
- $783 – $1,453
Heat risk 8/10 · Major
- Hot days now (above 108°F)
- 7 days/yr
- Hot days in 30 yrs
- 17 days/yr
Wind risk 8/10 · Major
- Chance of severe wind over 30 yrs
- 80.0%
Air-quality risk 3/10 · Minor
- Unhealthy air days now
- 3 days/yr
- Unhealthy air days in 30 yrs
- 3 days/yr
Risk factors via First Street. Map © Google.
Why this score? — see what drove the C- grade
The composite is a weighted blend of 9 inputs, each scored 0–100. Each bar is that input's sub-score; the figure is the points it added to the 100-point composite (weight × sub-score).
- Cash flow +15.4/30.0
- ARV discount +7.5/15.0
- Appreciation +6.9/10.0
- Schools +5.0/10.0
- DSCR +4.7/10.0
- 1% rule +3.4/10.0
- Livability +3.2/5.0
- Rent growth +2.5/5.0
- Condition / age +2.5/5.0
$140,000
🖨 Deal sheet 📄 Offer letter ✓ Due diligence
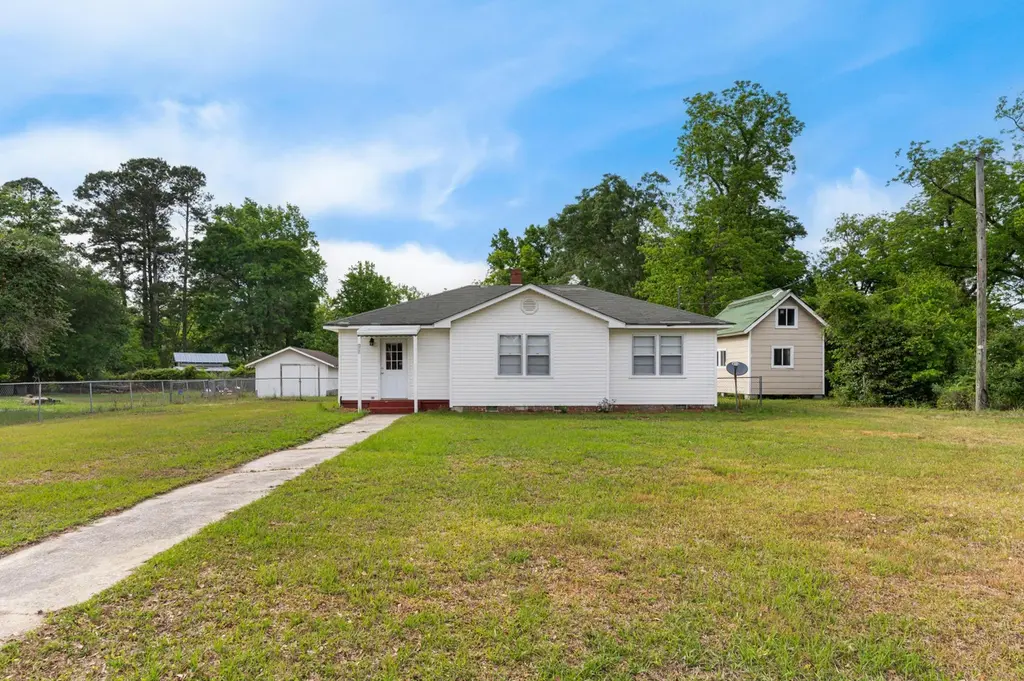
Listing remarks
This charming three-bedroom, one-bath country home, built in 1945, offers 1,136 square feet of inviting family living. You'll find gorgeous original hardwood floors in key areas, adding timeless character. The spacious rooms and expansive yard are perfect for family gatherings, with a handy workshop providing extra storage or hobby space.
Key facts
- Expansive yard
- Handy workshop
- 0.8 acre lot
Tags
Property features AI
Exterior
- Utilities: Public sewer; Service from Edisto Electric
- Home design: Single-family detached home; One level
- Exterior features: Asphalt roof; Storage; Workshop
Interior
- Bedrooms: 3 bedrooms
- Flooring: Carpet; Wood
- Bathrooms: 1 bathroom
- Heating & cooling: Electric heating
- Interior features: Carpet and wood flooring; Electric heating
- Laundry & utility: Washer hookup; Electric dryer hookup
Neighborhood map
What this means for you Summary
Snapshot
- This is a 3-bed/1.0-bath single-family listed at $140k.
Deal economics
- At list price, monthly cash flow is $54 ($651/yr) — positive.
- The deal already cash-flows at list — no discount required.
- To meet the 1% rule (rent ≥ 1% of price), the offer needs to be $117k (16.3% below list).
- Recommended offer: $117k (16.3% below list) — sets the bar for 1% rule.
Location & tenants
- Location reads 65/100 on livability (#128 in SC) — a middle-class / working-renter tenant base. Strengths: cost of living A+, health & safety A+, crime A-; Watch: amenities F, commute F, employment F.
- Zoned schools: Lockett Elementary (math 24%, 231 students, 100% FRL); Branchville High (math 30%, 316 students, 100% FRL).
- Market conditions: 13 active listings in the ZIP; 87 units permitted in Orangeburg County in 2024 (0 in 5+ unit buildings).
Forward outlook
- In year one you build about $6k of equity ($968 loan paydown + $5k appreciation (3.9% local appreciation)).
- Orangeburg County population projected at -27% by 2050 — secular population decline; favor cash flow + early exit over multi-decade hold.
- At projected returns (3.9% appreciation + 3.0% rent growth), your $39k cash investment doubles in ~5 years — after that, you're playing with house money.
- By year 6, paydown + projected appreciation supports a ~$34k cash-out refi (75% LTV) — recoverable capital for the next deal without selling this one.
Negotiation context
- It's been on market 30 days — a 2% lower offer ($138k) is reasonable based on typical stale-listing flexibility.
- Current owner paid $9k; list at $140k implies a 1422% gain — meaningful room to come down on a strong offer.
Risks & watch-outs
- Watch-outs: built in 1945 — expect roof / HVAC / electrical / plumbing capex.
- Climate carrying-cost: severe wind risk, 80% chance of damaging wind over 30y; moderate wildfire risk; extreme-heat days projected 7→17/yr by 2055 (HVAC capex compounding) — expect insurance premiums to compound above CPI over the hold.
Questions for the listing agent
- Built in 1945 — when were the roof, HVAC, electrical panel, plumbing, and water heater last replaced?
- Is there a deadline driving the sale (1031 exchange, divorce, estate, relocation)? That informs how much negotiation room exists.
- What's the average days-on-market for RENTAL listings here right now (not sales)? A rising rental-DOM trend means longer vacancies and softer asking-rent achievability than the comps imply.
- What's the recent tenant-quality profile in this submarket — average credit score on applications, eviction rate, late-payment / NSF rate, and stable-employment percentage? A property-management company in the area should have these aggregated.
- How much new for-sale + rental construction is in the pipeline within 1–3 miles? Heavy new supply typically softens prices + rents 12–24 months out; constrained supply supports both.
Investment metrics
- 1% rule
- 0.84% ✗
- Cap rate
- 6.76%
- Cash-on-cash
- 1.66%
- DSCR
- 1.07
- GRM
- 10.0
CMA / ARV
No comps found within radius.
Projected returns pro-forma
3.89% appreciation · 3.0% rent growth · sell at horizon
- IRR
- 11.5%
- Equity multiple
- 1.69×
- Total profit
- $27,024
- Equity at exit
- $70,123
- IRR
- 13.1%
- Equity multiple
- 3.12×
- Total profit
- $83,298
- Equity at exit
- $114,013
Cash invested: $39,200 (down + closing). Projections, not guarantees.
Landlord ↔ Tenant lean methodology
- Overall (STATE)
- 90 Strongly Landlord-Friendly
- State South Carolina
- 90 Strongly Landlord-Friendly · R+6
- County
- — inherits STATE
- City
- — inherits STATE
ZIP-level market 29432
- Home prices YoY
- 2.2%
- Active inventory
- 13
- Price-to-rent
- 10.0×
Monthly cashflow live
- Estimated rent
- $1,172 medium interval (Pro) →
- Mortgage (P&I)
- −$734
- Tax from tax record
- −$79 /mo · $949/yr
- Insurance
- −$58
- HOA
- −$0
- Vacancy / Maint / Mgmt
- −$246
- Net cashflow
- $54
Break-even live
UW: 25.0% down · 7.5% · 30yr · 1.5% tax · 5.0% vac · 8.0% maint · 8.0% mgmt
Financing live
Cash to close
- Down payment
- $35,000
- Closing costs
- $4,200
- Reserves months
- —
- Total cash needed
- —
Loan-product check · same deal, 3 products live
Conventional
25% down · 7.5% · 30yr
- Down + closing
- —
- Monthly P&I
- —
- Monthly cashflow
- —
- DSCR
- —
- Eligible?
- —
Personal DTI + credit; lowest rate.
DSCR
20% down · 8.5% · 30yr
- Down + closing
- —
- Monthly P&I
- —
- Monthly cashflow
- —
- DSCR
- —
- Eligible?
- —
No personal income docs; deal must DSCR.
Hard money
10% down · 12.0% · 12mo
- Down + closing
- —
- Monthly P&I
- —
- Monthly cashflow
- —
- DSCR
- —
- Eligible?
- —
Short-term bridge; refi at stabilization.
Listing history 19 events
-
2026-06-19days on market $140,000 Active 30 DOM
-
2026-06-18days on market $140,000 Active 29 DOM
-
2026-06-17days on market $140,000 Active 28 DOM
-
2026-06-16days on market $140,000 Active 27 DOM
-
2026-06-15days on market $140,000 Active 26 DOM
-
2026-06-14days on market $140,000 Active 24 DOM
-
2026-06-12days on market $140,000 Active 23 DOM
-
2026-06-09days on market $140,000 Active 20 DOM
-
2026-06-08days on market $140,000 Active 19 DOM
-
2026-06-07days on market $140,000 Active 18 DOM
-
2026-06-07days on market $140,000 Active 17 DOM
-
2026-06-04days on market $140,000 Active 14 DOM
-
2026-06-02days on market $140,000 Active 13 DOM
-
2026-06-01days on market $140,000 Active 12 DOM
-
2026-05-31days on market $140,000 Active 11 DOM
-
2026-05-31days on market $140,000 Active 10 DOM
-
2026-05-20$140,000 Active
-
1992-05-01soldstatus $9,200
-
1992-05-01soldstatus $9,200
ⓘ Source: listings_history table (triggers on properties + properties_extension) + one-shot
backfill from property_details.listing_events for pre-trigger history.
Tax reassessment forecast SC · Resets to sale price
- Current annual tax
- $949 · $79/mo
- Projected year-2 tax
- $949 · $79/mo
- Expected delta
- $0/yr ($0/mo · 0.0%)
ⓘ Screening estimate from a state-policy table — verify with the county assessor before closing.
Climate risk First Street
- Flood 1/10 Low FEMA zone X (unshaded) · 0% chance over 30 yrs
- Wildfire 5/10 Major
- Heat 8/10 Severe 7 d/yr ≥108°F today · 17 d/yr by 30 yrs out
- Wind 8/10 Severe 80% chance of damaging wind over 30 yrs
- Air quality 3/10 Moderate 3 unhealthy d/yr today · 3 by 30 yrs out
Nearby sold comps map
Loading sold comps map…
Walkable amenities ~0.75 mi
Loading nearby amenities…
Taxation est. · year 1
- Rental income
- $14,064
- − Mortgage interest
- −$7,842
- − Property taxes
- −$949
- − Insurance
- −$700
- − Repairs & maintenance
- −$1,125
- − Management
- −$1,125
- − Depreciation
- −$4,073
- Taxable loss
- −$1,750
- Est. tax savings @ 24.0%
- +$420
- After-tax cash flow
- $1,071/yr
For passive investors: Depreciation is non-cash, so a rental often shows a tax loss while cash-flowing — sheltering income. Rental losses are passive: they offset passive income freely, and up to $25,000/yr can offset ordinary (W-2) income if you actively participate and your MAGI is under $100k (phasing out to $0 by $150k); unused losses carry forward. On sale, claimed depreciation is recaptured at up to 25%, and gains may owe capital-gains tax (a 1031 exchange can defer both). Figures are a year-1 estimate at your 24.0% rate — not tax advice; consult a CPA.
Schools (NCES district)
No district data.
Livability — Branchville
- Score
- 65/100
- State rank
- #128
- US rank
- #12447
Category grades
Schools grade is shown separately in the Schools card above.
Census & demographics
- Census place
- Branchville, SC
- Population (ZIP)
- 2,422
Population outlook (Orangeburg County) Hauer SSP2
- Today (2025)
- 82,698 people
- By 2030
- 78,615 · -4.9%
- By 2040
- 69,308 · -16.2%
- By 2050
- 60,629 · -26.7%
- By 2075
- 42,678 · -48.4%
- By 2100
- 28,136 · -66.0%
Race, ethnicity, and origin ACS 2023
- Neighborhood character
- Majority White (62%)
- Race & ethnicity
- White 62% Black 34% Two or more races 3% Hispanic / Latino 2%
- Common ancestry
- Slovak 2% Lithuanian 0%
- Languages at home
- 97% English-only · Spanish 3%
Political lean MEDSL · Orangeburg
- 2024 margin
- Strong D (+24.6) · D 61.8% · R 37.2% · Other 1.1%
- 2008→2024 swing
- -13.5pp toward R · 2008: 38.1pp · 2024: 24.6pp
- All cycles
- 2024: D+24.6 2020: D+33.2 2016: D+37.0 2012: D+43.5 2008: D+38.1
Not yet ingested
- Civics
- —
Market trends
- HPI YoY
- ▲ 3.89%
- Current HPI
- 183.8555
- Rent YoY
- —
- Metro
- —
- State GDP YoY
- ▲ 4.51%
- F500 in state
- 2
Industry mix (Fortune 500 HQ in SC)
| Industry | F500 HQs | Revenue |
|---|---|---|
| Packaging | 1 | $7B |
|
||
Price history
+1421.7% since first listed3 events — show timeline
- 2026-05-20 Listed $140,000 Charleston Trident MLS
- 1992-05-01 Sold (Public Records) $9,200 Public Records
- 1992-05-01 Sold (Public Records) $9,200 Public Records
Property tax history
+4.2%/yrLatest (2024): $949 · +13.9% YoY. Source: county tax records.
Cash-flow waterfall
monthlySold comps — $/sqft
last 12 mo · ≤1 miLoading sold comps…