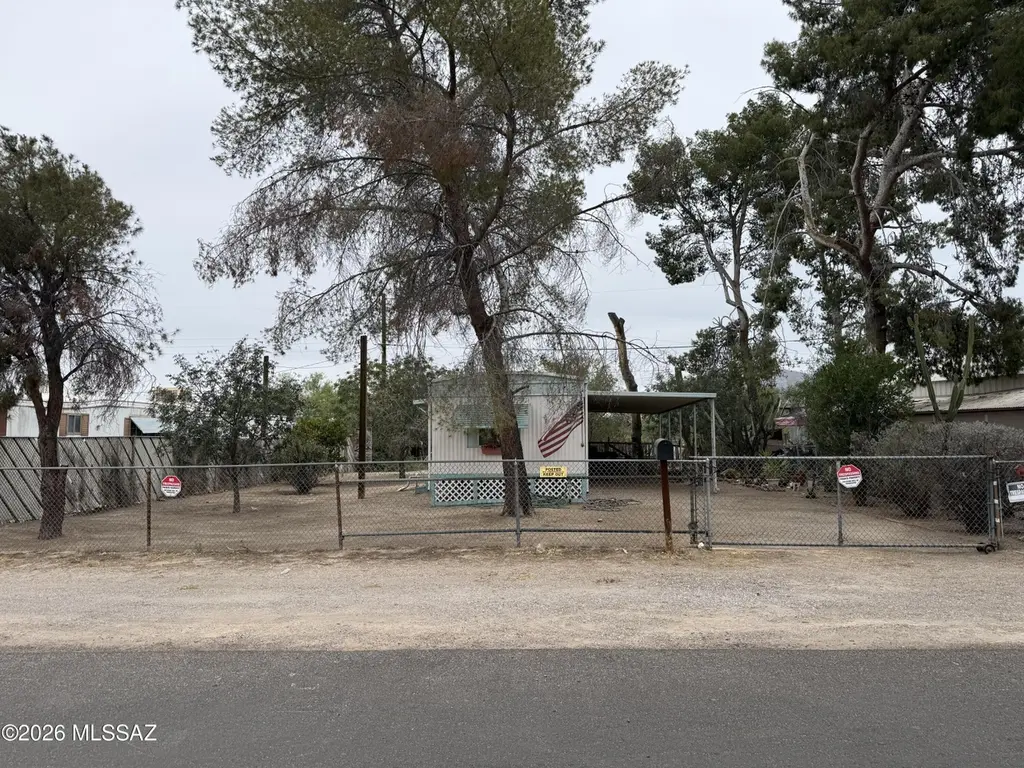
1358 W Mohawk Dr · Flowing Wells, AZ
Flood risk 1/10 · Minimal
- FEMA flood zone
- X (unshaded)
- Chance of flooding over 30 yrs
- 0.0%
- Est. flood insurance / yr
- $507 – $1,088
Fire risk 2/10 · Minimal
- Est. fire insurance / yr
- $610 – $1,132
Heat risk 8/10 · Major
- Hot days now (above 107°F)
- 7 days/yr
- Hot days in 30 yrs
- 19 days/yr
Wind risk 1/10 · Minimal
- Chance of severe wind over 30 yrs
- —
Air-quality risk 1/10 · Minimal
- Unhealthy air days now
- 0 days/yr
- Unhealthy air days in 30 yrs
- 0 days/yr
Risk factors via First Street. Map © Google.
Why this score? — see what drove the D+ grade
The composite is a weighted blend of 9 inputs, each scored 0–100. Each bar is that input's sub-score; the figure is the points it added to the 100-point composite (weight × sub-score).
- Cash flow +19.5/30.0
- ARV discount +7.5/15.0
- DSCR +6.2/10.0
- 1% rule +4.3/10.0
- Livability +3.7/5.0
- Schools +3.1/10.0
- Rent growth +2.6/5.0
- Condition / age +2.5/5.0
- Appreciation +0.0/10.0
$115,000
🖨 Deal sheet (PDF) 📄 Offer letter ✓ Due diligence
Listing remarks
Add an additional dwelling, build a duplex, endless possibilities with Multiple Use Zoning! Selling as-is! Did I mention the potential for an amazing view!
Key facts
- Multiple use zoning
- Additional dwelling
- Amazing view
Tags
Property features AI
Finance
- Other: Lot is subdivided (approx. 7,269 sq ft); Lot dimensions: 113 x 60 x 104 x 62; Zoned Tucson - MU
Exterior
- Parking: Attached garage; 1 covered/carport space
- Utilities: Connected to sewer; Water from local water company
- Home design: Mobile home; Single-story; Fixer condition
- Construction: Frame construction; Metal roof
- Exterior features: Deck; Chain link fencing; Paved road access; City-maintained road
Interior
- Kitchen: Refrigerator; Gas range
- Flooring: Vinyl flooring; Laminate flooring
- Bathrooms: 1 full bathroom
- Heating & cooling: Forced air heating; Central air conditioning; Window unit(s)
- Interior features: Refrigerator; Gas range
- Laundry & utility: Laundry in bathroom
Neighborhood map
What this means for you Summary
Snapshot
- This is a 2-bed/1.0-bath manufactured listed at $115k.
Deal economics
- At list price, monthly cash flow is $131 ($2k/yr) — positive.
- The deal already cash-flows at list — no discount required.
- To meet the 1% rule (rent ≥ 1% of price), the offer needs to be $107k (7.3% below list).
- Recommended offer: $107k (7.3% below list) — sets the bar for 1% rule.
- Cap rate 7.7% vs local median 6.0% in Flowing Wells — meaningfully above typical; check what's discounted (condition, days-on-market, listing class) to confirm the premium yield is real.
Location & tenants
- Location reads 73/100 on livability (#21 in AZ) — a middle-class / working-renter tenant base. Strengths: commute A+, cost of living A+, health & safety A+; Watch: crime F, amenities F, employment F.
- Amphitheater Unified District (4406) (suburban): math 32% / reading 40% proficiency, ranked #85 of 249 in AZ (top 34%) — families likely to look elsewhere, expect single-tenant / working-renter base with shorter leases.
- Zoned schools: Homer Davis Elementary School (math 20% / reading 28%, grade F, #664 of 1,109 statewide, top 60%, 411 students, 86% FRL); Flowing Wells High School (math 22% / reading 24%, grade F, #208 of 381 statewide, top 55%, 1,694 students, 65% FRL) — zoned schools average 75% FRL vs 24% district-wide (51 pts higher); higher-poverty schools than district average — tighter screening recommended.
- Zoned-school proficiency averages 24% at this address vs 36% district-wide (-12 pts) — the specific schools serving this property underperform the Amphitheater Unified District (4406) average; the district grade overstates school quality for this exact location.
- Market conditions: Rents flat; 181 active listings in the ZIP; 15 comparable units currently listed for rent nearby; rentals at typical pace (median 26d on market — plan ~3-4 weeks tenant-placement turnaround); 40% of comp listings sitting > 30 days — soft ceiling on asking rent; lower-income renter base — watch delinquency; 5,268 units permitted in Pima County in 2024 (996 in 5+ unit buildings).
- This rent runs 34% of the median local income ($37k/yr) — at the standard rent-burdened threshold; future hikes will face affordability resistance.
Forward outlook
- Local home prices are declining (-3.0%/yr); year-one equity from $795 of loan paydown is wiped out by about $3k of value loss. Plan a longer hold.
- Pima County population projected at +8% by 2050 — modest demand growth; plan on rents tracking national, not racing it.
Negotiation context
- Only 11 days on market — expect competitive offers; lowballing is unlikely to land.
Risks & watch-outs
- Climate carrying-cost: extreme-heat days projected 7→19/yr by 2055 (HVAC capex compounding) — expect insurance premiums to compound above CPI over the hold.
Questions for the listing agent
- Built in 1973 — when were the roof, HVAC, electrical panel, plumbing, and water heater last replaced?
- Is there a deadline driving the sale (1031 exchange, divorce, estate, relocation)? That informs how much negotiation room exists.
- Schools are D-rated, which usually means shorter tenancies and higher turnover. Who's the typical renter profile here, and what's been the actual vacancy rate?
- Crime grade is F in this area — have there been break-ins, vandalism, or insurance claims at this property in the last 3 years? What carrier currently insures it and at what premium?
- The area grade is low — what's the realistic commute time and amenity access for the typical tenant pool here? Any planned neighborhood developments (good or bad) we should know about?
- What's the average days-on-market for RENTAL listings here right now (not sales)? A rising rental-DOM trend means longer vacancies and softer asking-rent achievability than the comps imply.
- What's the recent tenant-quality profile in this submarket — average credit score on applications, eviction rate, late-payment / NSF rate, and stable-employment percentage? A property-management company in the area should have these aggregated.
- How much new for-sale + rental construction is in the pipeline within 1–3 miles? Heavy new supply typically softens prices + rents 12–24 months out; constrained supply supports both.
Investment metrics
- 1% rule
- 0.93% ✗
- Cap rate
- 7.66%
- Cash-on-cash
- 4.88%
- DSCR
- 1.22
- GRM
- 9.0
CMA / ARV
- ARV (median comp)
- $45,762
- List price
- $115,000
- Delta
- 151.30%
- Verdict
- OVERPRICED
- Comps
- 12 within 1.0 mi
Show comp detail 9 sales within ~0.75 mi
| Address | Dist | Beds/Ba | Sqft | Sold | Price | $/sf | Match |
|---|---|---|---|---|---|---|---|
| 1358 W Mohawk Dr | 0.00mi | 2/1.0 | 720 (0%) | 0mo | $115,000 | $160 | 100 |
| 4737 N Kenwood Ct | 0.36mi | 2/1.0 | 784 (+9%) | 4mo | $199,900 | $255 | 65 |
| 1537 W Wabash St | 0.26mi | 2/2.0 | 780 (+8%) | 8mo | $150,000 | $192 | 63 |
| 1741 W Wetmore Rd #33 | 0.69mi | 2/2.0 | 720 (0%) | 5mo | $16,000 | $22 | 60 |
| 1741 W Wetmore Rd #34 | 0.67mi | 3/2.0 (+1) | 720 (0%) | 0mo | $19,000 | $26 | 59 |
| 1741 W Wetmore Rd #23 | 0.69mi | 3/1.5 (+1) | 720 (0%) | 8mo | $17,500 | $24 | 54 |
| 1741 W Wetmore Rd #15 | 0.69mi | 3/1.5 (+1) | 720 (0%) | 22mo | $17,500 | $24 | 42 |
| 1741 W Wetmore Rd #22 | 0.69mi | 3/1.5 (+1) | 720 (0%) | 23mo | $17,500 | $24 | 42 |
| 1741 W Wetmore Rd #5 | 0.69mi | 2/1.0 | 800 (+11%) | 16mo | $3,000 | $4 | 36 |
Match score weights: distance 35% · size 25% · config 20% · recency 20%. Top-matched comps best support the ARV.
Projected returns pro-forma
-3.0% appreciation · 0.3% rent growth · sell at horizon
- IRR
- -11.6%
- Equity multiple
- 0.59×
- Total profit
- $-13,159
- Equity at exit
- $17,147
- IRR
- -6.4%
- Equity multiple
- 0.63×
- Total profit
- $-11,836
- Equity at exit
- $9,943
Cash invested: $32,200 (down + closing). Projections, not guarantees.
Landlord ↔ Tenant lean methodology
- Overall (STATE)
- 87 Strongly Landlord-Friendly
- State Arizona
- 87 Strongly Landlord-Friendly · R+3
- County
- — inherits STATE
- City
- — inherits STATE
ZIP-level market 85705
- Rents YoY
- 0.3%
- Active inventory
- 181
- Price-to-rent
- 9.0×
Monthly cashflow live
- Estimated rent
- $1,066 high interval (Pro) →
- Mortgage (P&I)
- −$603
- Tax from tax record
- −$60 /mo · $725/yr
- Insurance
- −$48
- HOA
- −$0
- Vacancy / Maint / Mgmt
- −$224
- Net cashflow
- $131
Break-even live
Sensitivity live
| Price | -10% $196 | -5% $163 | +0% $131 | +5% $98 | +10% $66 |
|---|---|---|---|---|---|
| Rent | -10% $47 | -5% $89 | +0% $131 | +5% $173 | +10% $215 |
| Rate | -1.0pp $189 | -0.5pp $160 | base $131 | +0.5pp $101 | +1.0pp $71 |
UW: 25.0% down · 7.5% · 30yr · 1.5% tax · 5.0% vac · 8.0% maint · 8.0% mgmt
Financing live
Cash to close
- Down payment
- $28,750
- Closing costs
- $3,450
- Reserves months
- —
- Total cash needed
- —
Loan-product check · same deal, 3 products live
Conventional
25% down · 7.5% · 30yr
- Down + closing
- —
- Monthly P&I
- —
- Monthly cashflow
- —
- DSCR
- —
- Eligible?
- —
Personal DTI + credit; lowest rate.
DSCR
20% down · 8.5% · 30yr
- Down + closing
- —
- Monthly P&I
- —
- Monthly cashflow
- —
- DSCR
- —
- Eligible?
- —
No personal income docs; deal must DSCR.
Hard money
10% down · 12.0% · 12mo
- Down + closing
- —
- Monthly P&I
- —
- Monthly cashflow
- —
- DSCR
- —
- Eligible?
- —
Short-term bridge; refi at stabilization.
Rent comps 15 comps
| Address | Beds | Baths | Sqft | Rent | $/sqft | DOM | Units | Dist |
|---|---|---|---|---|---|---|---|---|
| 5100 N La Canada Dr Tucson, AZ | 1.0 | 1.0 | 686 | $1,343 | $1.96 | 46d | 1 | 0.43mi |
| 1089 W Schafer Dr Unit 4 Tucson, AZ | 1.0 | 1.0 | 350 | $750 | $2.14 | 23d | 1 | 0.47mi |
| 620 W Limberlost Dr Unit E24 Tucson, AZ | 2.0 | 1.0 | 672 | $1,200 | $1.79 | 25d | 1 | 0.93mi |
| 1215 W Roger Rd Unit 1241-14 Tucson, AZ | 1.0 | 1.0 | 670 | $895 | $1.34 | 45d | 1 | 0.97mi |
| 1355 W Roger Rd Tucson, AZ | 1.0–2.0 | 1.0–2.0 | 627 | $1,084 | $1.73 | 45d | 4 | 0.99mi |
| 1990 W Amy Pl Unit B Tucson, AZ | 1.0 | 1.0 | 600 | $900 | $1.50 | 22d | 1 | 1.00mi |
| 3802 N Flowing Wells Rd Tucson, AZ | 1.0–2.0 | 1.0 | 555 | $1,100 | $1.98 | 45d | 5 | 1.14mi |
| 60 W Stone Loop Tucson, AZ | 2.0 | 1.0 | 588 | $1,395 | $2.37 | 4d | 46 | 1.29mi |
| 239 W Limberlost Dr Tucson, AZ | 1.0 | 1.0 | 680 | $795 | $1.17 | 45d | 1 | 1.32mi |
| 3700 N Fairview Ave Unit 104 Tucson, AZ | 1.0 | 1.0 | 444 | $949 | $2.14 | 5d | 1 | 1.39mi |
| 1700 W Prince Rd Tucson, AZ | 1.0–2.0 | 1.0 | 618 | $1,099 | $1.78 | 3d | 25 | 1.40mi |
| 822 W Thurber Rd Unit B Tucson, AZ | 2.0 | 1.0 | 750 | $825 | $1.10 | 45d | 1 | 1.41mi |
| 532 W Simmons Rd Tucson, AZ | 1.0 | 1.0 | 566 | $1,000 | $1.77 | 19d | 1 | 1.43mi |
| 115 W Limberlost Dr Tucson, AZ | 1.0–2.0 | 1.0–2.0 | 806 | $1,350 | $1.67 | 25d | 1 | 1.43mi |
| 30 E Camino Villas Tucson, AZ | 1.0 | 1.0 | 440 | $753 | $1.71 | 23d | 1 | 1.47mi |
Listing history 5 events
-
2026-05-13status Pending 156-char remark
-
2026-05-07historical Active Contingent 156-char remark
-
2026-05-02$115,000 Active 156-char remark
-
1981-05-01soldstatus $25,000
-
1980-05-01soldstatus $12,000
ⓘ Source: listings_history table (triggers on properties + properties_extension) + one-shot
backfill from property_details.listing_events for pre-trigger history.
Tax reassessment forecast AZ · Resets to sale price
- Current annual tax
- $725 · $60/mo
- Projected year-2 tax
- $759 · $63/mo
- Expected delta
- +$34/yr (+$3/mo · 4.7%)
ⓘ Screening estimate from a state-policy table — verify with the county assessor before closing.
Climate risk First Street
- Flood 1/10 Low FEMA zone X (unshaded) · 0% chance over 30 yrs
- Wildfire 2/10 Low
- Heat 8/10 Severe 7 d/yr ≥107°F today · 19 d/yr by 30 yrs out
- Wind 1/10 Low
- Air quality 1/10 Low 0 unhealthy d/yr today · 0 by 30 yrs out
Nearby sold comps map
Loading sold comps map…
Walkable amenities ~0.75 mi
Loading nearby amenities…
Taxation est. · year 1
- Rental income
- $12,793
- − Mortgage interest
- −$6,442
- − Property taxes
- −$725
- − Insurance
- −$575
- − Repairs & maintenance
- −$1,023
- − Management
- −$1,023
- − Depreciation
- −$3,345
- Taxable loss
- −$341
- Est. tax savings @ 24.0%
- +$82
- After-tax cash flow
- $1,652/yr
For passive investors: Depreciation is non-cash, so a rental often shows a tax loss while cash-flowing — sheltering income. Rental losses are passive: they offset passive income freely, and up to $25,000/yr can offset ordinary (W-2) income if you actively participate and your MAGI is under $100k (phasing out to $0 by $150k); unused losses carry forward. On sale, claimed depreciation is recaptured at up to 25%, and gains may owe capital-gains tax (a 1031 exchange can defer both). Figures are a year-1 estimate at your 24.0% rate — not tax advice; consult a CPA.
Schools (NCES district)
- District
- Amphitheater Unified District (4406)
- NCES district ID
- 0400680
- Math proficiency
- 32% ▼ -13.00%
- Reading proficiency
- 40% ▼ -8.00%
- Median HH income
- $46,524
- Composite
- 30.82/100
- National rank
- #6135
- State rank
- #85 of 249 in AZ
Livability — Flowing Wells
- Score
- 73/100
- State rank
- #21
- US rank
- #5288
Category grades
Schools grade is shown separately in the Schools card above.
Census & demographics
- Census place
- Flowing Wells, AZ
- County
- Pima County · 1,012,107 people
- Metro
- Tucson, AZ
- Population (ZIP)
- 54,700
- Household income
- $37,194
- Rent vs Own
- Severe rent burden
- 4240.0
Population outlook (Pima County) Hauer SSP2
- Today (2025)
- 1,066,056 people
- By 2030
- 1,086,684 · +1.9%
- By 2040
- 1,117,160 · +4.8%
- By 2050
- 1,149,778 · +7.9%
- By 2075
- 1,271,480 · +19.3%
- By 2100
- 1,321,160 · +23.9%
Race, ethnicity, and origin ACS 2023
- Neighborhood character
- Diverse neighborhood (Simpson 0.63)
- Race & ethnicity
- Hispanic / Latino 45% White 41% Two or more races 18% Asian 4% Black 3% Native American 3%
- Hispanic origin (detail)
- Mexican 41%
- Common ancestry
- Portuguese 2% Romanian 2% Lithuanian 2%
- Foreign-born
- 18% · Canada, China, Vietnam
- Languages at home
- 65% English-only · Spanish 30% Chinese 1% Vietnamese 1%
Political lean MEDSL · Pima
- 2024 margin
- D (+15.2) · D 57.0% · R 41.8% · Other 1.2%
- 2008→2024 swing
- +9.1pp toward D · 2008: 6.1pp · 2024: 15.2pp
- All cycles
- 2024: D+15.2 2020: D+18.7 2016: D+13.5 2012: D+5.8 2008: D+6.1
Not yet ingested
- Civics
- —
Market trends
- HPI YoY
- ▼ -163.31%
- Current HPI
- 283.0647
- Rent YoY
- ▲ 0.30%
- Metro
- Tucson, AZ
- State GDP YoY
- ▲ 4.54%
- F500 in state
- 20
Industry mix (Fortune 500 HQ in AZ)
| Industry | F500 HQs | Revenue |
|---|---|---|
| Technology | 2 | $13B |
|
||
| Mining / Metals | 1 | $23B |
|
||
| Environmental Services | 1 | $16B |
|
||
| Metals / Steel | 1 | $14B |
|
||
| Technology Distribution | 1 | $9B |
|
||
| Homebuilding | 1 | $8B |
|
||
Price history
+858.3% since first listed8 events — show timeline
- 2026-06-15 Sold (MLS) $115,000 MLSSAZ
- 2026-06-05 Price Changed $114,700 MLSSAZ
- 2026-05-13 Pending — MLSSAZ
- 2026-05-07 Contingent — MLSSAZ
- 2026-05-06 Price Changed $115,000 MLSSAZ
- 2026-05-02 Listed $115,000 MLSSAZ
- 1981-05-01 Sold (Public Records) $25,000 Public Records
- 1980-05-01 Sold (Public Records) $12,000 Public Records
Property tax history
+1.2%/yrLatest (2025): $725 · +4.5% YoY. Source: county tax records.
Cash-flow waterfall
monthlySold comps — $/sqft
last 12 mo · ≤1 miLoading sold comps…