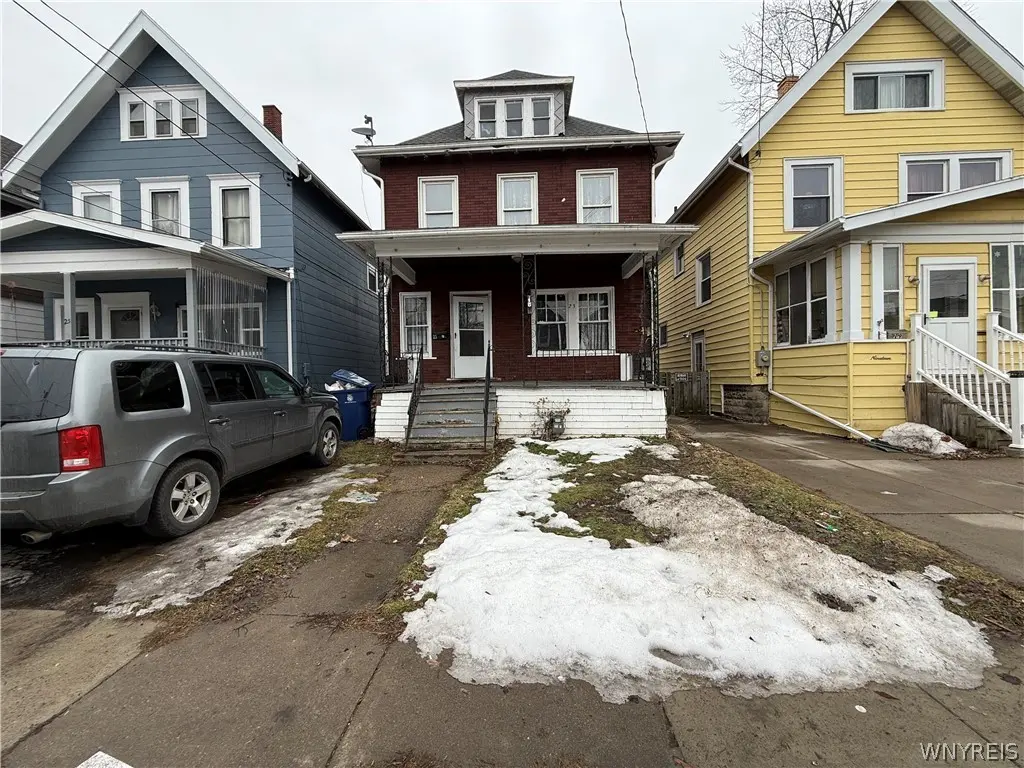
23 Albert Ave · Buffalo, NY
Flood risk 1/10 · Minimal
- FEMA flood zone
- X (unshaded)
- Chance of flooding over 30 yrs
- 0.0%
- Est. flood insurance / yr
- $473 – $860
Fire risk 1/10 · Minimal
- Est. fire insurance / yr
- $691 – $1,283
Heat risk 3/10 · Minor
- Hot days now (above 93°F)
- 7 days/yr
- Hot days in 30 yrs
- 15 days/yr
Wind risk 1/10 · Minimal
- Chance of severe wind over 30 yrs
- —
Air-quality risk 3/10 · Minor
- Unhealthy air days now
- 3 days/yr
- Unhealthy air days in 30 yrs
- 4 days/yr
Risk factors via First Street. Map © Google.
Why this score? — see what drove the C+ grade
The composite is a weighted blend of 9 inputs, each scored 0–100. Each bar is that input's sub-score; the figure is the points it added to the 100-point composite (weight × sub-score).
- Cash flow +24.0/30.0
- ARV discount +9.6/15.0
- DSCR +7.7/10.0
- 1% rule +5.0/10.0
- Rent growth +4.5/5.0
- Livability +3.9/5.0
- Schools +3.3/10.0
- Condition / age +2.5/5.0
- Appreciation +0.0/10.0
$154,900
🖨 Deal sheet (PDF) 📄 Offer letter ✓ Due diligence
Listing remarks MLS
High ceilings, gorgeous formal dining room with natural hardwoods. A nice functional modern kitchen. The beautiful curved staircase. Master with huge walk in closet. The finished man cave in the attic. .. are all the reasons why you don't want to miss seeing this house. Brand spankin new hot water tank.
Key facts
- 3,000 sq ft lot
- Garage
- Built 1900
Property features AI
Exterior
- Parking: Attached garage (1 car)
- Utilities: Cable available; Electricity available (circuit breakers); High-speed internet available; Public water connected; Sewer connected
- Home design: 2-story existing home; Residential lot on a city street; Rectangular lot (approx. 30 x 100)
- Construction: Asphalt roof; Block foundation; Construction details: see remarks
- Exterior features: Concrete driveway; Partial fence
Interior
- Kitchen: Gas oven; Gas range
- Bedrooms: Main level primary (number of bedrooms not specified)
- Flooring: Laminate flooring; Varies by room
- Bathrooms: 1 full bathroom; 1 half bathroom; 2 bathrooms on the main level
- Heating & cooling: Gas forced air heating
- Interior features: Kitchen open to family room; Natural woodwork; Main level primary bedroom
- Laundry & utility: Laundry in basement; Gas water heater
Neighborhood map
What this means for you Summary
Snapshot
- This is a 4-bed/1.0-bath single-family listed at $155k.
Deal economics
- At list price, monthly cash flow is $303 ($4k/yr) — positive.
- The deal already cash-flows at list — no discount required.
- To meet the 1% rule (rent ≥ 1% of price), the offer needs to be $154k (0.5% below list).
- Recommended offer: $154k (0.5% below list) — sets the bar for 1% rule.
Location & tenants
- Location reads 77/100 on livability (#195 in NY, #3,011 nationally) — a middle-class / working-renter tenant base. Strengths: commute A+, housing A+, health & safety A+; Watch: crime F, employment D-.
- Buffalo City School District (urban): math 41% / reading 40% proficiency, ranked #535 of 590 in NY (top 91%) — families likely to look elsewhere, expect single-tenant / working-renter base with shorter leases; 75% free/reduced lunch — lower-income household profile, screen leases tightly.
- Market conditions: Rents rising fast (+8.2%/yr); 197 active listings in the ZIP; 8 comparable units currently listed for rent nearby; rentals at typical pace (median 25d on market — plan ~3-4 weeks tenant-placement turnaround); lower-income renter base — watch delinquency; 1,244 units permitted in Erie County in 2024 (563 in 5+ unit buildings).
- At $1,542/mo this rent would consume 47% of the median local household income ($40k/yr) (locally 2177% of renters already pay >50% of income on rent) — very limited rent-growth headroom before tenants either downsize or default.
Forward outlook
- Local home prices are declining (-3.0%/yr); year-one equity from $1k of loan paydown is wiped out by about $5k of value loss. Plan a longer hold.
- At projected returns (-3.0% appreciation + 8.0% rent growth), your $43k cash investment doubles in ~8 years — after that, you're playing with house money.
Negotiation context
- Only 3 days on market — expect competitive offers; lowballing is unlikely to land.
- 8 sale attempts since 14y ago with the ask held roughly flat each time — persistent listings suggest the price (not the market) is what's stuck; bring a comps-based counter.
- Current owner paid $25k; list at $155k implies a 520% gain — meaningful room to come down on a strong offer.
Risks & watch-outs
- Watch-outs: built in 1900 — expect roof / HVAC / electrical / plumbing capex.
Questions for the listing agent
- Built in 1900 — when were the roof, HVAC, electrical panel, plumbing, and water heater last replaced?
- Is there a deadline driving the sale (1031 exchange, divorce, estate, relocation)? That informs how much negotiation room exists.
- Crime grade is F in this area — have there been break-ins, vandalism, or insurance claims at this property in the last 3 years? What carrier currently insures it and at what premium?
- What's the average days-on-market for RENTAL listings here right now (not sales)? A rising rental-DOM trend means longer vacancies and softer asking-rent achievability than the comps imply.
- What's the recent tenant-quality profile in this submarket — average credit score on applications, eviction rate, late-payment / NSF rate, and stable-employment percentage? A property-management company in the area should have these aggregated.
- How much new for-sale + rental construction is in the pipeline within 1–3 miles? Heavy new supply typically softens prices + rents 12–24 months out; constrained supply supports both.
Investment metrics
- 1% rule
- 1.00% ✗
- Cap rate
- 8.64%
- Cash-on-cash
- 8.39%
- DSCR
- 1.37
- GRM
- 8.4
CMA / ARV
- ARV (median comp)
- $162,591
- List price
- $154,900
- Delta
- -4.73%
- Verdict
- FAIR
- Comps
- 20 within 1.0 mi
Show comp detail 12 sales within ~0.75 mi
| Address | Dist | Beds/Ba | Sqft | Sold | Price | $/sf | Match |
|---|---|---|---|---|---|---|---|
| 186 Crowley Ave | 0.22mi | 4/2.0 | 1,333 (+4%) | 2mo | $215,000 | $161 | 76 |
| 62 Chadduck Ave | 0.31mi | 3/1.0 (-1) | 1,240 (-3%) | 2mo | $155,000 | $125 | 74 |
| 136 Crowley Ave | 0.26mi | 4/1.0 | 1,394 (+9%) | 2mo | $100,000 | $72 | 71 |
| 50 Philadelphia St | 0.49mi | 3/1.5 (-1) | 1,276 (0%) | 1mo | $155,000 | $121 | 69 |
| 280 Esser Ave | 0.51mi | 3/1.0 (-1) | 1,283 (+0%) | 3mo | $175,000 | $136 | 68 |
| 38 Wyandotte Ave | 0.58mi | 4/1.0 | 1,200 (-6%) | 2mo | $150,000 | $125 | 61 |
| 195 Hertel Ave | 0.59mi | 3/1.0 (-1) | 1,236 (-3%) | 1mo | $110,000 | $89 | 61 |
| 107 Ullman St | 0.65mi | 4/2.0 | 1,258 (-1%) | 3mo | $118,000 | $94 | 61 |
| 82 Beatrice Ave | 0.43mi | 3/1.0 (-1) | 1,166 (-9%) | 2mo | $165,000 | $142 | 59 |
| 136 Newfield St | 0.58mi | 3/1.5 (-1) | 1,198 (-6%) | 2mo | $167,000 | $139 | 54 |
| 88 Huetter Ave Ave | 0.71mi | 3/1.5 (-1) | 1,317 (+3%) | 1mo | $250,000 | $190 | 54 |
| 221 Newfield St | 0.68mi | 4/1.5 | 1,127 (-12%) | 4mo | $75,000 | $67 | 44 |
Match score weights: distance 35% · size 25% · config 20% · recency 20%. Top-matched comps best support the ARV.
Projected returns pro-forma
-3.0% appreciation · 8.0% rent growth · sell at horizon
- IRR
- 1.3%
- Equity multiple
- 1.05×
- Total profit
- $2,287
- Equity at exit
- $23,096
- IRR
- 15.0%
- Equity multiple
- 2.47×
- Total profit
- $63,645
- Equity at exit
- $13,393
Cash invested: $43,372 (down + closing). Projections, not guarantees.
Landlord ↔ Tenant lean methodology
- Overall (STATE)
- 15 Strongly Tenant-Friendly
- State New York
- 15 Strongly Tenant-Friendly · D+10
- County
- — inherits STATE
- City
- — inherits STATE
ZIP-level market 14207
- Home prices YoY
- -18.9%
- Rents YoY
- 8.2%
- Active inventory
- 197
- Price-to-rent
- 8.4×
Monthly cashflow live
- Estimated rent
- $1,542 high interval (Pro) →
- Mortgage (P&I)
- −$812
- Tax from tax record
- −$38 /mo · $452/yr
- Insurance
- −$65
- HOA
- −$0
- Vacancy / Maint / Mgmt
- −$324
- Net cashflow
- $303
Break-even live
Sensitivity live
| Price | -10% $391 | -5% $347 | +0% $303 | +5% $259 | +10% $216 |
|---|---|---|---|---|---|
| Rent | -10% $181 | -5% $242 | +0% $303 | +5% $364 | +10% $425 |
| Rate | -1.0pp $381 | -0.5pp $343 | base $303 | +0.5pp $263 | +1.0pp $222 |
UW: 25.0% down · 7.5% · 30yr · 1.5% tax · 5.0% vac · 8.0% maint · 8.0% mgmt
Financing live
Cash to close
- Down payment
- $38,725
- Closing costs
- $4,647
- Reserves months
- —
- Total cash needed
- —
Loan-product check · same deal, 3 products live
Conventional
25% down · 7.5% · 30yr
- Down + closing
- —
- Monthly P&I
- —
- Monthly cashflow
- —
- DSCR
- —
- Eligible?
- —
Personal DTI + credit; lowest rate.
DSCR
20% down · 8.5% · 30yr
- Down + closing
- —
- Monthly P&I
- —
- Monthly cashflow
- —
- DSCR
- —
- Eligible?
- —
No personal income docs; deal must DSCR.
Hard money
10% down · 12.0% · 12mo
- Down + closing
- —
- Monthly P&I
- —
- Monthly cashflow
- —
- DSCR
- —
- Eligible?
- —
Short-term bridge; refi at stabilization.
Rent comps 8 comps
| Address | Beds | Baths | Sqft | Rent | $/sqft | DOM | Units | Dist |
|---|---|---|---|---|---|---|---|---|
| 118 Rano St Buffalo, NY | 3.0 | 1.0 | 1050 | $1,200 | $1.14 | 22d | 1 | 0.27mi |
| 158 Chadduck Ave Buffalo, NY | 4.0 | 1.0 | 1200 | $1,250 | $1.04 | 24d | 1 | 0.33mi |
| 15 Ontario St Unit 1 Buffalo, NY | 3.0 | 1.0 | 1000 | $1,500 | $1.50 | 2d | 1 | 0.50mi |
| 480 W Hazeltine Ave Buffalo, NY | 3.0 | 1.0 | 989 | $1,900 | $1.92 | 24d | 1 | 0.83mi |
| 62 Seabrook St Buffalo, NY | 4.0 | 1.0 | 1300 | $2,000 | $1.54 | 2d | 1 | 0.84mi |
| 72 Reservation St Unit 2 Buffalo, NY | 3.0 | 1.0 | 950 | $1,150 | $1.21 | 24d | 1 | 1.03mi |
| 62 Germain St Buffalo, NY | 3.0 | 1.0 | 1320 | $1,250 | $0.95 | 24d | 1 | 1.08mi |
| 139 Fordham Dr Buffalo, NY | 3.0 | 1.0 | 1453 | $1,700 | $1.17 | 24d | 1 | 1.48mi |
Listing history 29 events
-
2026-06-18days on market $154,900 Active 3 DOM
-
2026-06-17days on market $154,900 Active 2 DOM
-
2026-06-15days on market $154,900 Active 1 DOM
-
2026-06-15days on market $154,900 Active 96 DOM
-
2026-06-13days on market $154,900 Active 94 DOM
-
2026-06-13days on market $154,900 Active 93 DOM
-
2026-06-10days on market $154,900 Active 91 DOM
-
2026-06-09days on market $154,900 Active 90 DOM
-
2026-06-08days on market $154,900 Active 89 DOM
-
2026-06-07pricedays on market $154,900 Active 88 DOM
-
2026-06-03days on market $174,400 Active 84 DOM
-
2026-06-02days on market $174,400 Active 83 DOM
-
2026-06-01days on market $174,400 Active 82 DOM
-
2026-05-31days on market $174,400 Active 81 DOM
-
2026-04-16price $174,400 842-char remark
-
2026-03-11$174,900 Active 842-char remark
-
2025-02-07historical $1,400
-
2025-01-25$1,400
-
2024-12-24historical $1,400
-
2024-12-22historical $1,400
-
2024-12-21$1,400
-
2024-12-21$1,400
-
2024-12-13historical $1,400
-
2024-12-13historical $1,400
-
2024-12-13$1,400
-
2024-12-13$1,400
-
2012-10-05soldstatus $25,000 304-char remark
Show marketing remark (304 chars)
High ceilings, gorgeous formal dining room with natural hardwoods. A nice functional modern kitchen. The beautiful curved staircase. Master with huge walk in closet. The finished man cave in the attic. .. are all the reasons why you don't want to miss seeing this house. Brand spankin new hot water tank.
-
2012-08-04$35,000 304-char remark
Show marketing remark (304 chars)
High ceilings, gorgeous formal dining room with natural hardwoods. A nice functional modern kitchen. The beautiful curved staircase. Master with huge walk in closet. The finished man cave in the attic. .. are all the reasons why you don't want to miss seeing this house. Brand spankin new hot water tank.
-
2007-09-13soldstatus $36,000
ⓘ Source: listings_history table (triggers on properties + properties_extension) + one-shot
backfill from property_details.listing_events for pre-trigger history.
Tax reassessment forecast NY · Partial reset (capped growth)
- Current annual tax
- $452 · $38/mo
- Projected year-2 tax
- $1,535 · $128/mo
- Expected delta
- +$1,083/yr (+$90/mo · 239.3%)
ⓘ Screening estimate from a state-policy table — verify with the county assessor before closing.
Climate risk First Street
- Flood 1/10 Low FEMA zone X (unshaded) · 0% chance over 30 yrs
- Wildfire 1/10 Low
- Heat 3/10 Moderate 7 d/yr ≥93°F today · 15 d/yr by 30 yrs out
- Wind 1/10 Low
- Air quality 3/10 Moderate 3 unhealthy d/yr today · 4 by 30 yrs out
Nearby sold comps map
Loading sold comps map…
Walkable amenities ~0.75 mi
Loading nearby amenities…
Taxation est. · year 1
- Rental income
- $18,498
- − Mortgage interest
- −$8,677
- − Property taxes
- −$452
- − Insurance
- −$774
- − Repairs & maintenance
- −$1,480
- − Management
- −$1,480
- − Depreciation
- −$4,506
- Taxable income
- $1,129
- Est. tax owed @ 24.0%
- −$271
- After-tax cash flow
- $3,368/yr
For passive investors: Depreciation is non-cash, so a rental often shows a tax loss while cash-flowing — sheltering income. Rental losses are passive: they offset passive income freely, and up to $25,000/yr can offset ordinary (W-2) income if you actively participate and your MAGI is under $100k (phasing out to $0 by $150k); unused losses carry forward. On sale, claimed depreciation is recaptured at up to 25%, and gains may owe capital-gains tax (a 1031 exchange can defer both). Figures are a year-1 estimate at your 24.0% rate — not tax advice; consult a CPA.
Schools (NCES district)
- District
- Buffalo City School District
- NCES district ID
- 3605850
- Math proficiency
- 41% ▲ 11.00%
- Reading proficiency
- 40% ▲ 7.00%
- Median HH income
- $31,665
- Composite
- 33.17/100
- National rank
- #5544
- State rank
- #535 of 590 in NY
Livability — Buffalo
- Score
- 77/100
- State rank
- #195
- US rank
- #3011
Category grades
Schools grade is shown separately in the Schools card above.
Census & demographics
- Census place
- Buffalo, NY
- County
- Erie County · 714,559 people
- City population
- 440,021
- Metro
- Buffalo-Cheektowaga, NY
- Population (ZIP)
- 26,327
- Household income
- $39,753
- Rent vs Own
- Severe rent burden
- 2177.0
Population outlook (Erie County) Hauer SSP2
- Today (2025)
- 933,037 people
- By 2030
- 935,181 · +0.2%
- By 2040
- 928,531 · -0.5%
- By 2050
- 905,725 · -2.9%
- By 2075
- 834,037 · -10.6%
- By 2100
- 708,033 · -24.1%
Race, ethnicity, and origin ACS 2023
- Neighborhood character
- Highly diverse neighborhood (Simpson 0.74)
- Race & ethnicity
- White 40% Hispanic / Latino 23% Black 16% Asian 15% Two or more races 14%
- Hispanic origin (detail)
- Puerto Rican 18% Dominican 2%
- Common ancestry
- Romanian 8% Portuguese 1% Arab 1%
- Foreign-born
- 19% · Philippines, Canada, India
- Languages at home
- 65% English-only · Spanish 14% Other Asian/Pacific 10% Other Indo-European 5%
Political lean MEDSL · Erie
- 2024 margin
- Lean D (+9.7) · D 54.8% · R 45.2%
- 2008→2024 swing
- -7.9pp toward R · 2008: 17.5pp · 2024: 9.7pp
- All cycles
- 2024: D+9.7 2020: D+14.7 2016: D+4.8 2012: D+15.6 2008: D+17.5
Not yet ingested
- Civics
- —
Market trends
- HPI YoY
- ▼ -54.42%
- Current HPI
- 233.0902
- Rent YoY
- ▲ 8.19%
- Metro
- Buffalo-Cheektowaga, NY
- State GDP YoY
- ▲ 2.60%
- F500 in state
- 92
Industry mix (Fortune 500 HQ in NY)
| Industry | F500 HQs | Revenue |
|---|---|---|
| Financial Services | 10 | $950B |
|
||
| Consumer Goods | 9 | $162B |
|
||
| Insurance | 4 | $225B |
|
||
| Telecommunications | 2 | $144B |
|
||
| Pharmaceuticals | 2 | $112B |
|
||
| Media / Entertainment | 2 | $69B |
|
||
Price history
+330.3% since first listed18 events — show timeline
- 2026-06-15 Listing Removed — WNYREIS
- 2026-06-15 Listed $154,900 WNYREIS
- 2026-06-06 Price Changed $154,900 WNYREIS
- 2026-04-16 Price Changed $174,400 WNYREIS
- 2026-03-11 Listed $174,900 WNYREIS
- 2025-02-07 Rental Removed $1,400 PROPERTYWARE
- 2025-01-25 Listed for Rent $1,400 PROPERTYWARE
- 2024-12-24 Rental Removed $1,400 PROPERTYWARE
- 2024-12-22 Rental Removed $1,400 SHOWMOJO
- 2024-12-21 Listed for Rent $1,400 SHOWMOJO
- 2024-12-21 Listed for Rent $1,400 PROPERTYWARE
- 2024-12-13 Rental Removed $1,400 PROPERTYWARE
- 2024-12-13 Rental Removed $1,400 SHOWMOJO
- 2024-12-13 Listed for Rent $1,400 PROPERTYWARE
- 2024-12-13 Listed for Rent $1,400 SHOWMOJO
- 2012-10-05 Sold (MLS) $25,000 WNYREIS
- 2012-08-04 Listed $35,000 WNYREIS
- 2007-09-13 Sold (Public Records) $36,000 Public Records
Property tax history
+6.4%/yrLatest (2025): $452 · +22.3% YoY. Source: county tax records.
Cash-flow waterfall
monthlySold comps — $/sqft
last 12 mo · ≤1 miLoading sold comps…