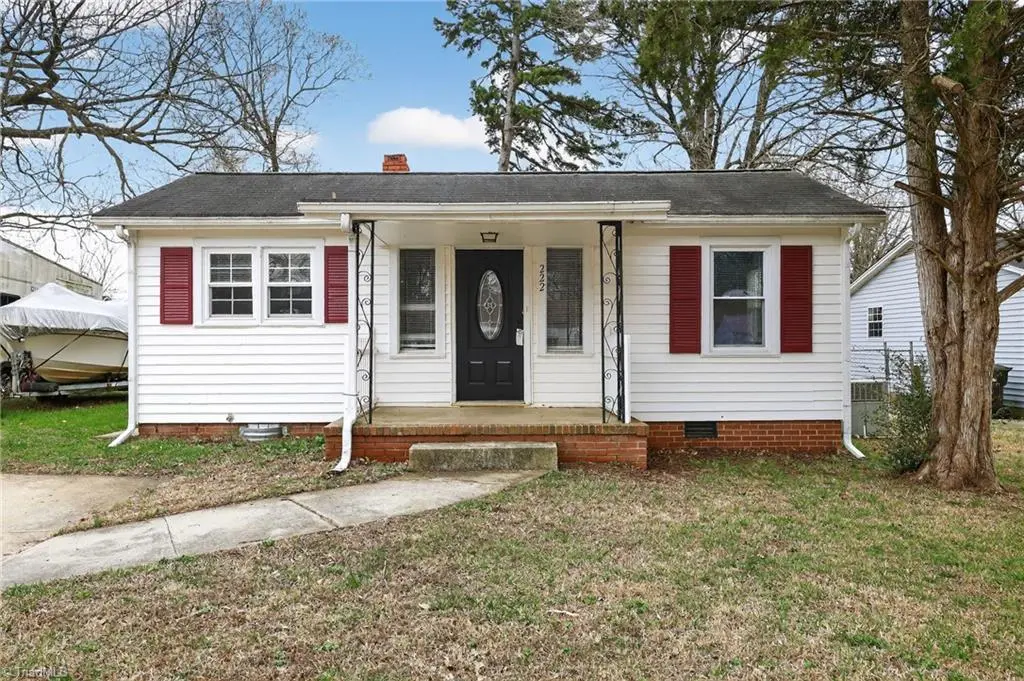
222 Charles Ave · High Point, NC
Flood risk 1/10 · Minimal
- FEMA flood zone
- X (unshaded)
- Chance of flooding over 30 yrs
- 0.0%
- Est. flood insurance / yr
- $507 – $1,088
Fire risk 3/10 · Minor
- Est. fire insurance / yr
- $906 – $1,684
Heat risk 5/10 · Moderate
- Hot days now (above 103°F)
- 7 days/yr
- Hot days in 30 yrs
- 17 days/yr
Wind risk 4/10 · Minor
- Chance of severe wind over 30 yrs
- 18.0%
Air-quality risk 2/10 · Minimal
- Unhealthy air days now
- 1 days/yr
- Unhealthy air days in 30 yrs
- 1 days/yr
Risk factors via First Street. Map © Google.
Why this score? — see what drove the B- grade
The composite is a weighted blend of 9 inputs, each scored 0–100. Each bar is that input's sub-score; the figure is the points it added to the 100-point composite (weight × sub-score).
- Cash flow +24.9/30.0
- ARV discount +15.0/15.0
- DSCR +8.1/10.0
- 1% rule +5.6/10.0
- Livability +3.9/5.0
- Schools +3.6/10.0
- Rent growth +3.4/5.0
- Condition / age +2.5/5.0
- Appreciation +0.0/10.0
$114,900
🖨 Deal sheet 📄 Offer letter ✓ Due diligence
Listing remarks MLS
Fabulous High Point Home! Lots of the work has been done for you! Buyer to verify all systems. CASH ONLY-HIGHEST & BEST with proof of funds. Buyer to pay all closing costs and property sold AS-IS and WHERE-IS. Closing and nonrefundable deposit held with Nelson Law Firm 110 John Wesley Way Greensboro 27401.
Key facts
- Covered front porch
- 7,405 sq ft lot
- Built 1956
Tags
Property features AI
Finance
- Other: Property type: Residential; Structure type: House; Existing (previously built) condition; Lot dimensions approximately 50 x 147 x 51 x 147 on ~0.17 acre
- HOA & community: No homeowners association; Subdivision: Milbourne Heights
Exterior
- Parking: Driveway
- Utilities: Public water; Public sewer; Electric water heater; Natural gas heating
- Home design: One-story house; Stick/site built residential structure; Built in 1956
- Construction: Vinyl siding; Crawl space foundation
- Exterior features: Fenced yard; Public maintained road
Interior
- Kitchen: Built-in refrigerator; Free-standing range; Range hood
- Bedrooms: Primary on main
- Flooring: Carpet; Laminate
- Bathrooms: 1 full bathroom
- Heating & cooling: Forced air heating (natural gas); Central air conditioning
- Interior features: Primary bedroom located on the main level; 5 total rooms
- Laundry & utility: Washer hookup; Dryer connection on main level; Electric water heater
Neighborhood map
What this means for you Summary
Snapshot
- This is a 2-bed/1.0-bath single-family listed at $115k.
Deal economics
- At list price, monthly cash flow is $247 ($3k/yr) — positive.
- The deal already cash-flows at list — no discount required.
- Meets the 1% rule at list price ($1k rent vs $115k).
- Cap rate 8.9% vs local median 4.0% in High Point — top-decile yield for the area; either an underpriced asset or a hidden risk that comps aren't pricing in. Stress-test before assuming the spread holds.
Location & tenants
- Location reads 77/100 on livability (#31 in NC, #3,084 nationally) — a middle-class / working-renter tenant base. Strengths: commute A+, cost of living A+, housing A+; Watch: amenities D, employment D, crime F.
- Guilford County Schools (urban): math 39% / reading 45% proficiency, ranked #99 of 178 in NC (top 56%) — families likely to look elsewhere, expect single-tenant / working-renter base with shorter leases.
- Zoned schools: Union Hill Elementary (math 35% / reading 29%, grade F, #908 of 1,410 statewide, top 67%, 524 students, 99% FRL); Jamestown Middle (math 26% / reading 42%, grade F, #294 of 475 statewide, top 63%, 940 students, 69% FRL); Lucy Ragsdale High (math 45% / reading 58%, grade D+, #299 of 535 statewide, top 56%, 1,346 students, 61% FRL) — zoned schools average 76% FRL vs 52% district-wide (24 pts higher); higher-poverty schools than district average — tighter screening recommended.
- Market conditions: Rents rising (+3.6%/yr); 128 active listings in the ZIP; 12 comparable units currently listed for rent nearby; rentals at typical pace (median 23d on market — plan ~3-4 weeks tenant-placement turnaround); lower-income renter base — watch delinquency; 3,843 units permitted in Guilford County in 2024 (2,397 in 5+ unit buildings).
- This rent runs 34% of the median local income ($42k/yr) — at the standard rent-burdened threshold; future hikes will face affordability resistance.
Forward outlook
- Local home prices are declining (-3.0%/yr); year-one equity from $794 of loan paydown is wiped out by about $3k of value loss. Plan a longer hold.
- Guilford County population projected at +26% by 2050 — long-run rental-demand tailwind backs the buy-and-hold thesis.
Negotiation context
- Only 13 days on market — expect competitive offers; lowballing is unlikely to land.
- 3 sale attempts since 5y ago with the ask held roughly flat each time — persistent listings suggest the price (not the market) is what's stuck; bring a comps-based counter.
- Current owner paid $46k; list at $115k implies a 147% gain — meaningful room to come down on a strong offer.
Risks & watch-outs
- Watch-outs: built in 1956 — expect roof / HVAC / electrical / plumbing capex.
- Climate carrying-cost: extreme-heat days projected 7→17/yr by 2055 (HVAC capex compounding) — expect insurance premiums to compound above CPI over the hold.
Questions for the listing agent
- Built in 1956 — when were the roof, HVAC, electrical panel, plumbing, and water heater last replaced?
- Is there a deadline driving the sale (1031 exchange, divorce, estate, relocation)? That informs how much negotiation room exists.
- Schools are D-rated, which usually means shorter tenancies and higher turnover. Who's the typical renter profile here, and what's been the actual vacancy rate?
- Crime grade is F in this area — have there been break-ins, vandalism, or insurance claims at this property in the last 3 years? What carrier currently insures it and at what premium?
- What's the average days-on-market for RENTAL listings here right now (not sales)? A rising rental-DOM trend means longer vacancies and softer asking-rent achievability than the comps imply.
- What's the recent tenant-quality profile in this submarket — average credit score on applications, eviction rate, late-payment / NSF rate, and stable-employment percentage? A property-management company in the area should have these aggregated.
- How much new for-sale + rental construction is in the pipeline within 1–3 miles? Heavy new supply typically softens prices + rents 12–24 months out; constrained supply supports both.
Investment metrics
- 1% rule
- 1.06% ✓
- Cap rate
- 8.87%
- Cash-on-cash
- 9.21%
- DSCR
- 1.41
- GRM
- 7.9
CMA / ARV
- ARV (on-the-fly)
- $163,800
- Comps found
- 8
Show comp detail 8 sales within ~0.75 mi
| Address | Dist | Beds/Ba | Sqft | Sold | Price | $/sf | Match |
|---|---|---|---|---|---|---|---|
| 240 Friendly Ave | 0.08mi | 3/1.0 (+1) | 834 (-1%) | 16mo | $162,500 | $195 | 77 |
| 206 Paramount St | 0.29mi | 3/1.0 (+1) | 872 (+4%) | 3mo | $155,000 | $178 | 73 |
| 619 Spring Garden Cir | 0.33mi | 2/1.0 | 878 (+4%) | 9mo | $90,000 | $103 | 70 |
| 230 Friendly Ave | 0.06mi | 2/1.0 | 725 (-14%) | 13mo | $150,000 | $207 | 64 |
| 723 Hendrix St | 0.69mi | 2/1.0 | 800 (-5%) | 6mo | $170,000 | $213 | 55 |
| 806 Pinecroft St | 0.33mi | 3/1.0 (+1) | 787 (-6%) | 19mo | $165,000 | $210 | 53 |
| 507 Lawndale Ave | 0.37mi | 3/1.0 (+1) | 960 (+14%) | 20mo | $152,900 | $159 | 37 |
| 1107 + 1111 Hickory Chapel Rd | 0.62mi | 2/1.0 | 960 (+14%) | 20mo | $149,900 | $156 | 31 |
Match score weights: distance 35% · size 25% · config 20% · recency 20%. Top-matched comps best support the ARV.
Projected returns pro-forma
-3.0% appreciation · 3.64% rent growth · sell at horizon
- IRR
- -1.7%
- Equity multiple
- 0.93×
- Total profit
- $-2,137
- Equity at exit
- $17,132
- IRR
- 8.5%
- Equity multiple
- 1.67×
- Total profit
- $21,531
- Equity at exit
- $9,934
Cash invested: $32,172 (down + closing). Projections, not guarantees.
Landlord ↔ Tenant lean methodology
- Overall (STATE)
- 85 Strongly Landlord-Friendly
- State North Carolina
- 85 Strongly Landlord-Friendly · R+3
- County
- — inherits STATE
- City
- — inherits STATE
ZIP-level market 27260
- Rents YoY
- 3.6%
- Active inventory
- 128
- Price-to-rent
- 7.9×
Monthly cashflow live
- Estimated rent
- $1,214 high interval (Pro) →
- Mortgage (P&I)
- −$603
- Tax from tax record
- −$62 /mo · $743/yr
- Insurance
- −$48
- HOA
- −$0
- Vacancy / Maint / Mgmt
- −$255
- Net cashflow
- $247
Break-even live
UW: 25.0% down · 7.5% · 30yr · 1.5% tax · 5.0% vac · 8.0% maint · 8.0% mgmt
Financing live
Cash to close
- Down payment
- $28,725
- Closing costs
- $3,447
- Reserves months
- —
- Total cash needed
- —
Loan-product check · same deal, 3 products live
Conventional
25% down · 7.5% · 30yr
- Down + closing
- —
- Monthly P&I
- —
- Monthly cashflow
- —
- DSCR
- —
- Eligible?
- —
Personal DTI + credit; lowest rate.
DSCR
20% down · 8.5% · 30yr
- Down + closing
- —
- Monthly P&I
- —
- Monthly cashflow
- —
- DSCR
- —
- Eligible?
- —
No personal income docs; deal must DSCR.
Hard money
10% down · 12.0% · 12mo
- Down + closing
- —
- Monthly P&I
- —
- Monthly cashflow
- —
- DSCR
- —
- Eligible?
- —
Short-term bridge; refi at stabilization.
Rent comps 12 comps
| Address | Beds | Baths | Sqft | Rent | $/sqft | DOM | Units | Dist |
|---|---|---|---|---|---|---|---|---|
| 104 Lawndale Ave High Point, NC | 3.0 | 1.0 | 884 | $1,395 | $1.58 | 23d | 1 | 0.17mi |
| 1150 Roberts Ln High Point, NC | 3.0 | 1.0 | 900 | $1,099 | $1.22 | 23d | 1 | 0.43mi |
| 212 Morgan Pl High Point, NC | 2.0 | 1.0 | 560 | $750 | $1.34 | 23d | 1 | 1.16mi |
| 1506 Wendell Ave High Point, NC | 3.0 | 1.0 | 1024 | $1,175 | $1.15 | 23d | 1 | 1.17mi |
| 1701 Franklin Ave High Point, NC | 2.0 | 1.0 | 840 | $1,350 | $1.61 | 23d | 1 | 1.21mi |
| 1506 Hidden Creek Ter High Point, NC | 3.0 | 2.0 | 1065 | $1,395 | $1.31 | 21d | 1 | 1.24mi |
| 1307 Camden Ave High Point, NC | 3.0 | 1.0 | 875 | $1,500 | $1.71 | 23d | 1 | 1.25mi |
| 1404 Waterloo Dr High Point, NC | 3.0 | 2.0 | 1056 | $1,620 | $1.53 | 23d | 1 | 1.30mi |
| 1109 Garrison St High Point, NC | 2.0 | 1.0 | 768 | $1,100 | $1.43 | 23d | 1 | 1.37mi |
| 1416 Furlough Ave High Point, NC | 2.0 | 1.0 | 724 | $950 | $1.31 | 14d | 1 | 1.40mi |
| 223 Woodbury St High Point, NC | 2.0 | 1.0 | 750 | $825 | $1.10 | 23d | 1 | 1.42mi |
| 1730 Brooks Ave High Point, NC | 2.0 | 1.0 | 792 | $900 | $1.14 | 19d | 1 | 1.49mi |
Listing history 12 events
-
2026-04-29status Pending
-
2026-04-24status Active
-
2026-03-28status Pending
-
2026-03-20$114,900 Active
-
2021-03-18soldstatus $46,500
-
2021-03-16soldstatus $55,000 Closed 311-char remark
Show marketing remark (311 chars)
Fabulous High Point Home! Lots of the work has been done for you! Buyer to verify all systems. CASH ONLY-HIGHEST & BEST with proof of funds. Buyer to pay all closing costs and property sold AS-IS and WHERE-IS. Closing and nonrefundable deposit held with Nelson Law Firm 110 John Wesley Way Greensboro 27401.
-
2021-03-04status Pending 311-char remark
Show marketing remark (311 chars)
Fabulous High Point Home! Lots of the work has been done for you! Buyer to verify all systems. CASH ONLY-HIGHEST & BEST with proof of funds. Buyer to pay all closing costs and property sold AS-IS and WHERE-IS. Closing and nonrefundable deposit held with Nelson Law Firm 110 John Wesley Way Greensboro 27401.
-
2021-02-28$59,900 Active 311-char remark
Show marketing remark (311 chars)
Fabulous High Point Home! Lots of the work has been done for you! Buyer to verify all systems. CASH ONLY-HIGHEST & BEST with proof of funds. Buyer to pay all closing costs and property sold AS-IS and WHERE-IS. Closing and nonrefundable deposit held with Nelson Law Firm 110 John Wesley Way Greensboro 27401.
-
2019-12-30price $30,000
-
2019-12-21price $32,000
-
2019-12-20price $37,000
-
1987-09-01soldstatus $23,500
ⓘ Source: listings_history table (triggers on properties + properties_extension) + one-shot
backfill from property_details.listing_events for pre-trigger history.
Tax reassessment forecast NC · Resets to sale price
- Current annual tax
- $743 · $62/mo
- Projected year-2 tax
- $942 · $79/mo
- Expected delta
- +$200/yr (+$17/mo · 26.9%)
ⓘ Screening estimate from a state-policy table — verify with the county assessor before closing.
Climate risk First Street
- Flood 1/10 Low FEMA zone X (unshaded) · 0% chance over 30 yrs
- Wildfire 3/10 Moderate
- Heat 5/10 Major 7 d/yr ≥103°F today · 17 d/yr by 30 yrs out
- Wind 4/10 Moderate 18% chance of damaging wind over 30 yrs
- Air quality 2/10 Low 1 unhealthy d/yr today · 1 by 30 yrs out
Nearby sold comps map
Loading sold comps map…
Walkable amenities ~0.75 mi
Loading nearby amenities…
Taxation est. · year 1
- Rental income
- $14,571
- − Mortgage interest
- −$6,436
- − Property taxes
- −$743
- − Insurance
- −$574
- − Repairs & maintenance
- −$1,166
- − Management
- −$1,166
- − Depreciation
- −$3,343
- Taxable income
- $1,143
- Est. tax owed @ 24.0%
- −$274
- After-tax cash flow
- $2,689/yr
For passive investors: Depreciation is non-cash, so a rental often shows a tax loss while cash-flowing — sheltering income. Rental losses are passive: they offset passive income freely, and up to $25,000/yr can offset ordinary (W-2) income if you actively participate and your MAGI is under $100k (phasing out to $0 by $150k); unused losses carry forward. On sale, claimed depreciation is recaptured at up to 25%, and gains may owe capital-gains tax (a 1031 exchange can defer both). Figures are a year-1 estimate at your 24.0% rate — not tax advice; consult a CPA.
Schools (NCES district)
- District
- Guilford County Schools
- NCES district ID
- 3701920
- Math proficiency
- 39% ▲ 1.00%
- Reading proficiency
- 45% ▲ 1.00%
- Median HH income
- $46,315
- Composite
- 35.78/100
- National rank
- #4842
- State rank
- #99 of 178 in NC
Livability — High Point
- Score
- 77/100
- State rank
- #31
- US rank
- #3084
Category grades
Schools grade is shown separately in the Schools card above.
Census & demographics
- Census place
- High Point, NC
- County
- Guilford County · 487,190 people
- City population
- 102,450
- Metro
- Greensboro-High Point, NC
- Population (ZIP)
- 25,299
- Household income
- $42,308
- Rent vs Own
- Severe rent burden
- 1005.0
Population outlook (Guilford County) Hauer SSP2
- Today (2025)
- 584,596 people
- By 2030
- 616,851 · +5.5%
- By 2040
- 678,451 · +16.1%
- By 2050
- 734,788 · +25.7%
- By 2075
- 862,985 · +47.6%
- By 2100
- 948,704 · +62.3%
Race, ethnicity, and origin ACS 2023
- Neighborhood character
- Diverse neighborhood (Simpson 0.67)
- Race & ethnicity
- Black 51% Hispanic / Latino 20% White 15% Asian 10% Two or more races 10%
- Hispanic origin (detail)
- Mexican 12% Puerto Rican 1%
- Common ancestry
- Hispanic 1% Serbian 1% Italian 1%
- Foreign-born
- 17% · Canada, Philippines, Dominican Republic
- Languages at home
- 71% English-only · Spanish 17% Other Indo-European 4% Other Asian/Pacific 4%
Political lean MEDSL · Guilford
- 2024 margin
- Strong D (+21.8) · D 60.2% · R 38.4% · Other 1.4%
- 2008→2024 swing
- +3.5pp toward D · 2008: 18.4pp · 2024: 21.8pp
- All cycles
- 2024: D+21.8 2020: D+23.1 2016: D+20.0 2012: D+16.5 2008: D+18.4
Not yet ingested
- Civics
- —
Market trends
- HPI YoY
- ▼ -107.22%
- Current HPI
- 159.2101
- Rent YoY
- ▲ 3.64%
- Metro
- Greensboro-High Point, NC
- State GDP YoY
- ▲ 3.28%
- F500 in state
- 26
Industry mix (Fortune 500 HQ in NC)
| Industry | F500 HQs | Revenue |
|---|---|---|
| Financial Services | 2 | $213B |
|
||
| Retail | 2 | $95B |
|
||
| Industrial Conglomerate | 1 | $38B |
|
||
| Metals / Steel | 1 | $35B |
|
||
| Utilities | 1 | $30B |
|
||
| Industrial Machinery | 1 | $19B |
|
||
Price history
+388.9% since first listed12 events — show timeline
- 2026-04-29 Pending — Triad MLS
- 2026-04-24 Relisted — Triad MLS
- 2026-03-28 Pending — Triad MLS
- 2026-03-20 Listed $114,900 Triad MLS
- 2021-03-18 Sold (Public Records) $46,500 Public Records
- 2021-03-16 Sold (MLS) $55,000 Triad MLS
- 2021-03-04 Pending — Triad MLS
- 2021-02-28 Listed $59,900 Triad MLS
- 2019-12-30 Price Changed $30,000 Triad MLS
- 2019-12-21 Price Changed $32,000 Triad MLS
- 2019-12-20 Price Changed $37,000 Triad MLS
- 1987-09-01 Sold (Public Records) $23,500 Public Records
Property tax history
+4.9%/yrLatest (2025): $743 · -0.8% YoY. Source: county tax records.
Cash-flow waterfall
monthlySold comps — $/sqft
last 12 mo · ≤1 miLoading sold comps…