112 Navesink Ave · Highlands, NJ
Flood risk 1/10 · Minimal
- FEMA flood zone
- X (unshaded)
- Chance of flooding over 30 yrs
- 0.0%
- Est. flood insurance / yr
- $473 – $860
Fire risk 1/10 · Minimal
- Est. fire insurance / yr
- $526 – $976
Heat risk 7/10 · Major
- Hot days now (above 94°F)
- 7 days/yr
- Hot days in 30 yrs
- 16 days/yr
Wind risk 8/10 · Major
- Chance of severe wind over 30 yrs
- 80.0%
Air-quality risk 4/10 · Minor
- Unhealthy air days now
- 3 days/yr
- Unhealthy air days in 30 yrs
- 5 days/yr
Risk factors via First Street. Map © Google.
Why this score? — see what drove the B- grade
The composite is a weighted blend of 9 inputs, each scored 0–100. Each bar is that input's sub-score; the figure is the points it added to the 100-point composite (weight × sub-score).
- Cash flow +25.0/30.0
- ARV discount +15.0/15.0
- DSCR +8.2/10.0
- 1% rule +7.5/10.0
- Schools +5.0/10.0
- Livability +3.5/5.0
- Rent growth +2.5/5.0
- Condition / age +2.5/5.0
- Appreciation +0.0/10.0
$499,900
🖨 Deal sheet 📄 Offer letter ✓ Due diligence
Listing remarks
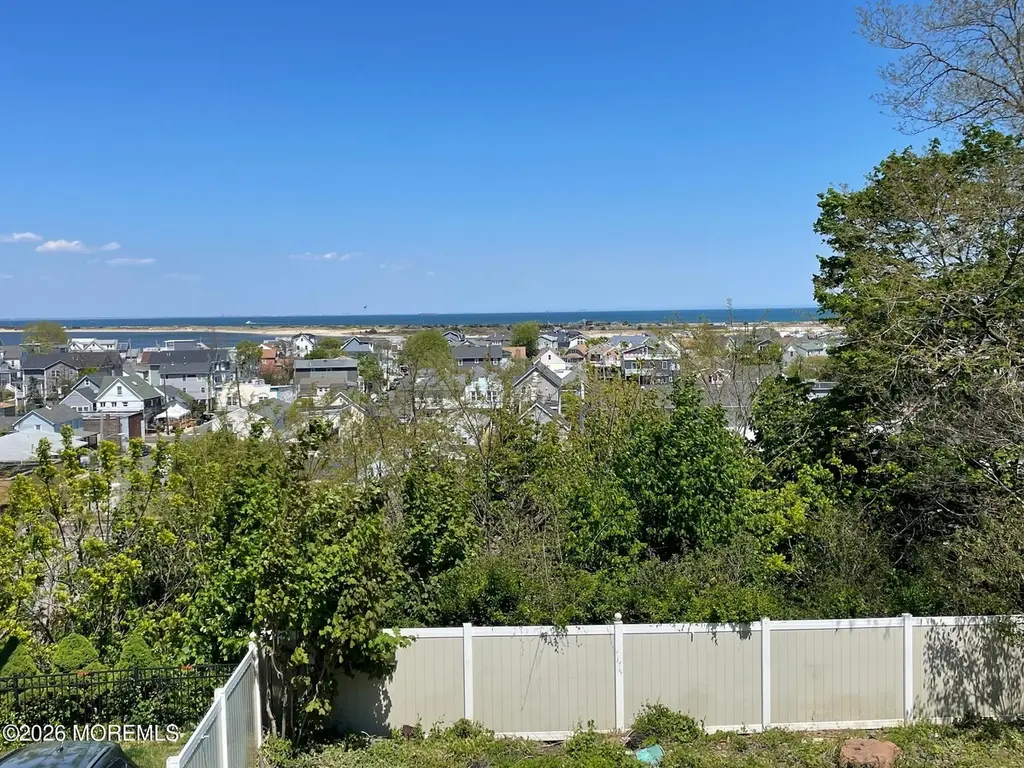
This is a Coming Soon Listing and cannot be shown until 6/2/26. Opportunity awaits! Amazing water views! Rehab or knock down and build new at this amazing location. Just a 3 minute drive to Sandy Hook beach.
Key facts
- 5,227 sq ft lot
- Garage
- Built 1950
Property features AI
Exterior
- Parking: Attached 1-car garage
- Utilities: Public sewer
- Home design: Fee simple ownership
- Construction: Shingle roof
- Exterior features: Ocean views
Interior
- Bedrooms: 3 bedrooms
- Flooring: Wood
- Bathrooms: 2 full bathrooms and 1 half bathroom (2.5 total)
- Heating & cooling: Heating present (other type); Central air conditioning
- Interior features: Wood flooring; Full basement with walk-out access; No fireplaces
Neighborhood map
What this means for you Summary
Snapshot
- This is a 3-bed/2.5-bath single-family listed at $500k.
Deal economics
- At list price, monthly cash flow is $1k ($13k/yr) — positive.
- The deal already cash-flows at list — no discount required.
- Meets the 1% rule at list price ($6k rent vs $500k).
- Recommended offer: $492k (1.5% below list) — sets the bar for market timing.
- Cap rate 8.9% vs local median 2.9% in Highlands — top-decile yield for the area; either an underpriced asset or a hidden risk that comps aren't pricing in. Stress-test before assuming the spread holds.
Location & tenants
- Location reads 69/100 on livability (#283 in NJ) — a middle-class / working-renter tenant base. Strengths: crime A+, employment A+, housing A+; Watch: amenities F, commute F, cost of living F.
- Market conditions: 39 active listings in the ZIP; 6 comparable units currently listed for rent nearby; rentals at typical pace (median 14d on market — plan ~3-4 weeks tenant-placement turnaround); solid renter incomes; 2,840 units permitted in Monmouth County in 2024 (484 in 5+ unit buildings).
- At $6,252/mo this rent would consume 82% of the median local household income ($92k/yr) (locally 259% of renters already pay >50% of income on rent) — very limited rent-growth headroom before tenants either downsize or default.
Forward outlook
- Local home prices are declining (-3.0%/yr); year-one equity from $3k of loan paydown is wiped out by about $15k of value loss. Plan a longer hold.
- Monmouth County population projected at -11% by 2050 — secular population decline; favor cash flow + early exit over multi-decade hold.
Negotiation context
- It's been on market 24 days — a 2% lower offer ($492k) is reasonable based on typical stale-listing flexibility.
- Current owner paid $350k; 43% above their basis — modest negotiation headroom, anchor on the comps not their cost.
Risks & watch-outs
- Watch-outs: built in 1950 — expect roof / HVAC / electrical / plumbing capex.
- Climate carrying-cost: severe wind risk, 80% chance of damaging wind over 30y; extreme-heat days projected 7→16/yr by 2055 (HVAC capex compounding) — expect insurance premiums to compound above CPI over the hold.
Questions for the listing agent
- Built in 1950 — when were the roof, HVAC, electrical panel, plumbing, and water heater last replaced?
- Is there a deadline driving the sale (1031 exchange, divorce, estate, relocation)? That informs how much negotiation room exists.
- Schools are B-rated — typically a magnet for longer-tenancy family renters. What's the average tenant stay here, and is there a school-zone premium baked into asking?
- What's the average days-on-market for RENTAL listings here right now (not sales)? A rising rental-DOM trend means longer vacancies and softer asking-rent achievability than the comps imply.
- What's the recent tenant-quality profile in this submarket — average credit score on applications, eviction rate, late-payment / NSF rate, and stable-employment percentage? A property-management company in the area should have these aggregated.
- How much new for-sale + rental construction is in the pipeline within 1–3 miles? Heavy new supply typically softens prices + rents 12–24 months out; constrained supply supports both.
Investment metrics
- 1% rule
- 1.25% ✓
- Cap rate
- 8.91%
- Cash-on-cash
- 9.33%
- DSCR
- 1.42
- GRM
- 6.7
CMA / ARV
- ARV (on-the-fly)
- $684,906
- Comps found
- 12
Show comp detail 12 sales within ~0.75 mi
| Address | Dist | Beds/Ba | Sqft | Sold | Price | $/sf | Match |
|---|---|---|---|---|---|---|---|
| 25 Shrewsbury Ave | 0.19mi | 3/2.5 | 1,825 (+12%) | 0mo | $1,100,000 | $603 | 70 |
| 85 Seadrift Ave | 0.36mi | 3/2.5 | 1,620 (-0%) | 16mo | $604,999 | $373 | 70 |
| 52 Barberie Ave | 0.45mi | 3/2.0 | 1,764 (+9%) | 1mo | $699,000 | $396 | 62 |
| 315 Shore Dr Unit D | 0.63mi | 2/2.0 (-1) | 1,636 (+1%) | 1mo | $520,000 | $318 | 61 |
| 45 2nd St | 0.18mi | 3/2.5 | 1,502 (-8%) | 21mo | $812,500 | $541 | 61 |
| 55 Bay Ave Unit A | 0.18mi | 3/2.0 | 1,444 (-11%) | 15mo | $475,000 | $329 | 59 |
| 25 Miller St | 0.21mi | 3/2.5 | 1,422 (-12%) | 14mo | $793,000 | $558 | 58 |
| 31 4th St | 0.21mi | 4/2.0 (+1) | 1,803 (+11%) | 11mo | $725,000 | $402 | 56 |
| 61 Barberie Ave | 0.42mi | 3/1.5 | 1,386 (-15%) | 3mo | $690,000 | $498 | 50 |
| 45 Portland Rd | 0.37mi | 3/2.0 | 1,440 (-11%) | 16mo | $475,000 | $330 | 49 |
| 17 Central Ave | 0.61mi | 4/2.0 (+1) | 1,858 (+14%) | 8mo | $785,000 | $422 | 34 |
| 10 Central Ave | 0.64mi | 3/3.0 | 1,852 (+14%) | 13mo | $910,000 | $491 | 34 |
Match score weights: distance 35% · size 25% · config 20% · recency 20%. Top-matched comps best support the ARV.
Projected returns pro-forma
-3.0% appreciation · 3.0% rent growth · sell at horizon
- IRR
- -2.1%
- Equity multiple
- 0.92×
- Total profit
- $-11,336
- Equity at exit
- $74,537
- IRR
- 7.6%
- Equity multiple
- 1.58×
- Total profit
- $80,776
- Equity at exit
- $43,222
Cash invested: $139,972 (down + closing). Projections, not guarantees.
Landlord ↔ Tenant lean methodology
- Overall (STATE)
- 21 Tenant-Leaning
- State New Jersey
- 21 Tenant-Leaning · D+6
- County
- — inherits STATE
- City
- — inherits STATE
ZIP-level market 07732
- Active inventory
- 39
- Price-to-rent
- 6.7×
Monthly cashflow live
- Estimated rent
- $6,252 medium interval (Pro) →
- Mortgage (P&I)
- −$2,622
- Tax from tax record
- −$1,021 /mo · $12,250/yr
- Insurance
- −$208
- HOA
- −$0
- Vacancy / Maint / Mgmt
- −$1,313
- Net cashflow
- $1,089
Break-even live
UW: 25.0% down · 7.5% · 30yr · 1.5% tax · 5.0% vac · 8.0% maint · 8.0% mgmt
Financing live
Cash to close
- Down payment
- $124,975
- Closing costs
- $14,997
- Reserves months
- —
- Total cash needed
- —
Loan-product check · same deal, 3 products live
Conventional
25% down · 7.5% · 30yr
- Down + closing
- —
- Monthly P&I
- —
- Monthly cashflow
- —
- DSCR
- —
- Eligible?
- —
Personal DTI + credit; lowest rate.
DSCR
20% down · 8.5% · 30yr
- Down + closing
- —
- Monthly P&I
- —
- Monthly cashflow
- —
- DSCR
- —
- Eligible?
- —
No personal income docs; deal must DSCR.
Hard money
10% down · 12.0% · 12mo
- Down + closing
- —
- Monthly P&I
- —
- Monthly cashflow
- —
- DSCR
- —
- Eligible?
- —
Short-term bridge; refi at stabilization.
Rent comps 6 comps
| Address | Beds | Baths | Sqft | Rent | $/sqft | DOM | Units | Dist |
|---|---|---|---|---|---|---|---|---|
| 179 Bay Ave Highlands, NJ | 4.0 | 2.0 | 1613 | $8,200 | $5.08 | 11d | 1 | 0.12mi |
| 60 5th St Unit D Highlands, NJ | 2.0 | 1.0 | 1292 | $8,500 | $6.58 | 1d | 1 | 0.27mi |
| 67 Snug Harbor Ave Highlands, NJ | 3.0 | 2.0 | 1414 | $2,000 | $1.41 | 17d | 1 | 0.53mi |
| 324 Shore Dr Unit E1 Highlands, NJ | 2.0 | 2.0 | 1519 | $3,100 | $2.04 | 1d | 1 | 0.74mi |
| 216 Ocean Ave Sea Bright, NJ | 2.0 | 2.0 | 1788 | $5,500 | $3.08 | 14d | 1 | 0.82mi |
| 60 Mathews St Unit 1st floor Highlands, NJ | 3.0 | 1.0 | 1556 | $2,500 | $1.61 | 24d | 1 | 0.87mi |
Listing history 17 events
-
2026-06-18days on market $499,900 Active 24 DOM
-
2026-06-17days on market $499,900 Active 23 DOM
-
2026-06-16days on market $499,900 Active 22 DOM
-
2026-06-15days on market $499,900 Active 21 DOM
-
2026-06-13days on market $499,900 Active 19 DOM
-
2026-06-13days on market $499,900 Active 18 DOM
-
2026-06-09days on market $499,900 Active 15 DOM
-
2026-06-08days on market $499,900 Active 14 DOM
-
2026-06-07days on market $499,900 Active 13 DOM
-
2026-06-04days on market $499,900 Active 10 DOM
-
2026-06-03days on market $499,900 Active 9 DOM
-
2026-06-02days on market $499,900 Active 8 DOM
-
2026-06-01days on market $499,900 Active 7 DOM
-
2026-05-31days on market $499,900 Active 6 DOM
-
2026-05-18historical $499,900
-
2009-08-18soldstatus $350,000
-
1997-01-29soldstatus $1
ⓘ Source: listings_history table (triggers on properties + properties_extension) + one-shot
backfill from property_details.listing_events for pre-trigger history.
Tax reassessment forecast NJ · Partial reset (capped growth)
- Current annual tax
- $12,250 · $1,021/mo
- Projected year-2 tax
- $12,349 · $1,029/mo
- Expected delta
- +$99/yr (+$8/mo · 0.8%)
ⓘ Screening estimate from a state-policy table — verify with the county assessor before closing.
Climate risk First Street
- Flood 1/10 Low FEMA zone X (unshaded) · 0% chance over 30 yrs
- Wildfire 1/10 Low
- Heat 7/10 Severe 7 d/yr ≥94°F today · 16 d/yr by 30 yrs out
- Wind 8/10 Severe 80% chance of damaging wind over 30 yrs
- Air quality 4/10 Moderate 3 unhealthy d/yr today · 5 by 30 yrs out
Nearby sold comps map
Loading sold comps map…
Walkable amenities ~0.75 mi
Loading nearby amenities…
Taxation est. · year 1
- Rental income
- $75,027
- − Mortgage interest
- −$28,002
- − Property taxes
- −$12,250
- − Insurance
- −$2,500
- − Repairs & maintenance
- −$6,002
- − Management
- −$6,002
- − Depreciation
- −$14,543
- Taxable income
- $5,728
- Est. tax owed @ 24.0%
- −$1,375
- After-tax cash flow
- $11,688/yr
For passive investors: Depreciation is non-cash, so a rental often shows a tax loss while cash-flowing — sheltering income. Rental losses are passive: they offset passive income freely, and up to $25,000/yr can offset ordinary (W-2) income if you actively participate and your MAGI is under $100k (phasing out to $0 by $150k); unused losses carry forward. On sale, claimed depreciation is recaptured at up to 25%, and gains may owe capital-gains tax (a 1031 exchange can defer both). Figures are a year-1 estimate at your 24.0% rate — not tax advice; consult a CPA.
Schools (NCES district)
No district data.
Livability — Highlands
- Score
- 69/100
- State rank
- #283
- US rank
- #8335
Category grades
Schools grade is shown separately in the Schools card above.
Census & demographics
- Census place
- Highlands, NJ
- County
- Monmouth County · 505,557 people
- City population
- 4,527
- Metro
- New York-Newark-Jersey City, NY-NJ-PA
- Population (ZIP)
- 4,527
- Household income
- $91,875
- Rent vs Own
- Severe rent burden
- 259.0
Population outlook (Monmouth County) Hauer SSP2
- Today (2025)
- 620,308 people
- By 2030
- 612,309 · -1.3%
- By 2040
- 587,297 · -5.3%
- By 2050
- 551,342 · -11.1%
- By 2075
- 472,934 · -23.8%
- By 2100
- 381,534 · -38.5%
Race, ethnicity, and origin ACS 2023
- Neighborhood character
- Predominantly White (79%)
- Race & ethnicity
- White 79% Asian 8% Two or more races 7% Hispanic / Latino 6% Black 2%
- Hispanic origin (detail)
- Puerto Rican 2%
- Common ancestry
- Lithuanian 4% Romanian 2% Slovak 2%
- Foreign-born
- 15% · Canada, China, Vietnam
- Languages at home
- 90% English-only · Spanish 4% Chinese 3% Arabic 1%
Political lean MEDSL · Monmouth
- 2024 margin
- R (+11.4) · D 43.4% · R 54.8% · Other 1.8%
- 2008→2024 swing
- -7.7pp toward R · 2008: -3.7pp · 2024: -11.4pp
- All cycles
- 2024: R+11.4 2020: R+2.8 2016: R+9.5 2012: R+5.5 2008: R+3.7
Not yet ingested
- Civics
- —
Market trends
- HPI YoY
- ▼ -357.74%
- Current HPI
- 345.5835
- Rent YoY
- —
- Metro
- New York-Newark-Jersey City, NY-NJ-PA
- State GDP YoY
- ▲ 2.05%
- F500 in state
- 34
Industry mix (Fortune 500 HQ in NJ)
| Industry | F500 HQs | Revenue |
|---|---|---|
| Consumer Goods | 3 | $31B |
|
||
| Pharmaceuticals | 2 | $153B |
|
||
| Technology | 2 | $21B |
|
||
| Insurance | 2 | $20B |
|
||
| Healthcare | 2 | $19B |
|
||
| Financial Services | 1 | $70B |
|
||
Price history
+42.8% since first listed3 events — show timeline
- 2026-05-18 Coming Soon $499,900 MOMLS
- 2009-08-18 Sold (Public Records) $350,000 Public Records
- 1997-01-29 Sold (Public Records) $1 Public Records
Property tax history
+2.7%/yrLatest (2025): $12,250 · -4.6% YoY. Source: county tax records.
Cash-flow waterfall
monthlySold comps — $/sqft
last 12 mo · ≤1 miLoading sold comps…