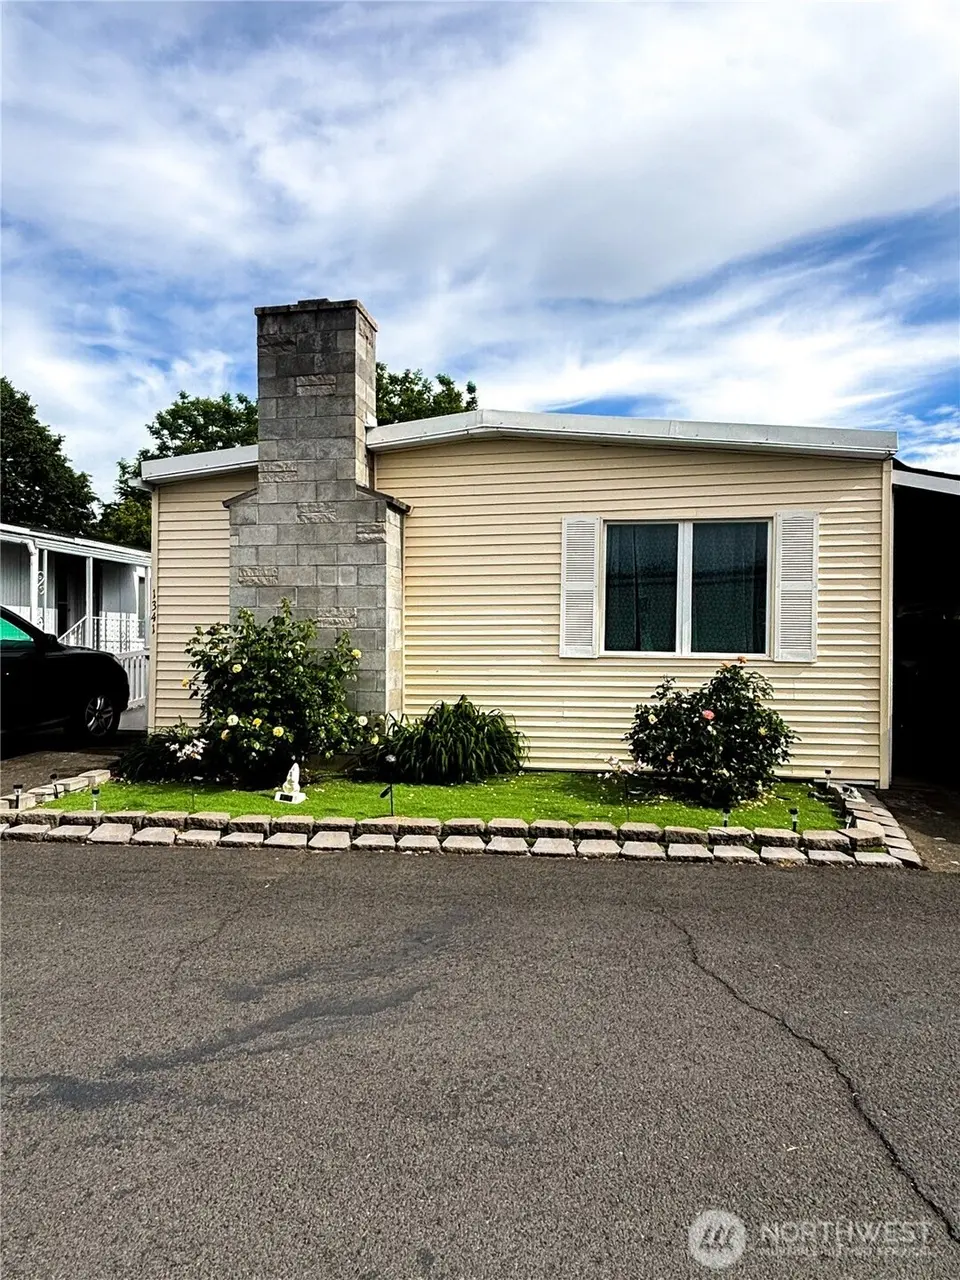
1341 BROOKYLN · Walla Walla, WA
Flood risk No data
- FEMA flood zone
- —
- Chance of flooding over 30 yrs
- —
- Est. flood insurance / yr
- —
Fire risk No data
- Est. fire insurance / yr
- —
Heat risk No data
- Hot days now (above threshold)
- —
- Hot days in 30 yrs
- —
Wind risk No data
- Chance of severe wind over 30 yrs
- —
Air-quality risk No data
- Unhealthy air days now
- —
- Unhealthy air days in 30 yrs
- —
Risk factors via First Street. Map © Google.
Why this score? — see what drove the B+ grade
The composite is a weighted blend of 9 inputs, each scored 0–100. Each bar is that input's sub-score; the figure is the points it added to the 100-point composite (weight × sub-score).
- Cash flow +30.0/30.0
- ARV discount +12.9/15.0
- 1% rule +10.0/10.0
- DSCR +10.0/10.0
- Schools +4.1/10.0
- Livability +4.0/5.0
- Rent growth +3.1/5.0
- Condition / age +2.5/5.0
- Appreciation +0.0/10.0
$99,500
🖨 Deal sheet (PDF) 📄 Offer letter ✓ Due diligence
Listing remarks
Nestled in the tranquil Rancho Villa community, this well-maintained home offers serenity and comfort. Located on a quiet street with Garrison Creek flowing behind the backyard, you'll enjoy ample storage with the additional shed. The inviting floor plan features a wood burning fireplace with a spacious living room and separate dining area. The kitchen is equipped with plenty of counter and cabinet space. This home offers 3 bedroom and 2 bathrooms with a walk-in shower. Recent updates include a new Bitumen Membrane roof in 2023, Updated showers, Siding, Vinyl windows, Plank flooring, Door, Ramp and Steps
Key facts
- Updated showers
- Ample storage
- Parking
Tags
Property features AI
Finance
- Other: Calculated living area 1,340 (public record)
- Financial info: Land lease: $700; Listing terms: Cash
- HOA & community: Located in Rancho Villa park; Park amenities include clubhouse; Park approved for sale
Exterior
- Parking: Carport
- Utilities: City of Walla Walla water; City of Walla Walla sewer; Pacific Power electric; Electric water heater
- Home design: Manufactured double-wide home; Single-story; Manufactured house (Fuqua model 56tT/24); Mobile home remains on site; Tie-down foundation
- Construction: Metal/vinyl construction materials; Wood energy source
- Exterior features: Metal/vinyl exterior; On waterfront (creek)
Interior
- Kitchen: Dishwasher; Refrigerator; Stove/Range
- Bedrooms: 3 bedrooms
- Flooring: Vinyl plank flooring; Carpet
- Bathrooms: 1 full bath; 1 three-quarter bath; 2 bathtubs; 1 shower
- Heating & cooling: Forced air heating; Heat pump heating; Forced air cooling; Heat pump cooling
- Interior features: Fireplace (wood burning); Water heater
- Laundry & utility: Water heater located in laundry room
Neighborhood map
What this means for you Summary
Snapshot
- This is a 3-bed/2.0-bath manufactured listed at $100k.
Deal economics
- At list price, monthly cash flow is $803 ($10k/yr) — positive.
- The deal already cash-flows at list — no discount required.
- Meets the 1% rule at list price ($2k rent vs $100k).
- Recommended offer: $97k (3.0% below list) — sets the bar for market timing.
- Cap rate 16.0% vs local median 2.3% in Walla Walla — top-decile yield for the area; either an underpriced asset or a hidden risk that comps aren't pricing in. Stress-test before assuming the spread holds.
Location & tenants
- Location reads 79/100 on livability (#105 in WA, #2,015 nationally) — a middle-class / working-renter tenant base. Strengths: amenities A+, commute A+, housing A+; Watch: schools C-.
- Walla Walla Public Schools (urban): math 41% / reading 50% proficiency, ranked #179 of 291 in WA (top 62%) — families likely to look elsewhere, expect single-tenant / working-renter base with shorter leases.
- Market conditions: Rents rising (+2.4%/yr); 427 active listings in the ZIP; 14 comparable units currently listed for rent nearby; rentals lingering (median 45d on market — plan ~5-8 weeks vacancy on turnover, expect pricing pressure); 100% of comp listings sitting > 30 days — soft ceiling on asking rent; 206 units permitted in Walla Walla County in 2024 (50 in 5+ unit buildings).
Forward outlook
- Local home prices are declining (-3.0%/yr); year-one equity from $688 of loan paydown is wiped out by about $3k of value loss. Plan a longer hold.
- Walla Walla County population projected at +8% by 2050 — modest demand growth; plan on rents tracking national, not racing it.
- At projected returns (-3.0% appreciation + 2.4% rent growth), your $28k cash investment doubles in ~4 years — after that, you're playing with house money.
Negotiation context
- It's been on market 37 days — a 3% lower offer ($97k) is reasonable based on typical stale-listing flexibility.
- 2 sale attempts with the ask held roughly flat each time — persistent listings suggest the price (not the market) is what's stuck; bring a comps-based counter.
- Current owner paid $75k; 33% above their basis — modest negotiation headroom, anchor on the comps not their cost.
Questions for the listing agent
- It's been on market 37 days. Have you received any prior offers? Is the seller open to a 3% concession, seller financing, or rate buy-down credit?
- Built in 1969 — when were the roof, HVAC, electrical panel, plumbing, and water heater last replaced?
- Is there a deadline driving the sale (1031 exchange, divorce, estate, relocation)? That informs how much negotiation room exists.
- What's the average days-on-market for RENTAL listings here right now (not sales)? A rising rental-DOM trend means longer vacancies and softer asking-rent achievability than the comps imply.
- What's the recent tenant-quality profile in this submarket — average credit score on applications, eviction rate, late-payment / NSF rate, and stable-employment percentage? A property-management company in the area should have these aggregated.
- How much new for-sale + rental construction is in the pipeline within 1–3 miles? Heavy new supply typically softens prices + rents 12–24 months out; constrained supply supports both.
Investment metrics
- 1% rule
- 1.79% ✓
- Cap rate
- 15.97%
- Cash-on-cash
- 34.57%
- DSCR
- 2.54
- GRM
- 4.7
CMA / ARV
- ARV (median comp)
- $112,984
- List price
- $99,500
- Delta
- -11.93%
- Verdict
- UNDERPRICED
- Comps
- 20 within 1.0 mi
Show comp detail 12 sales within ~0.75 mi
| Address | Dist | Beds/Ba | Sqft | Sold | Price | $/sf | Match |
|---|---|---|---|---|---|---|---|
| 1328 Samuel | 0.10mi | 3/2.0 | 1,352 (+1%) | 0mo | $65,000 | $48 | 94 |
| 1400 Samuel Dr | 0.09mi | 3/2.0 | 1,280 (-4%) | 2mo | $169,900 | $133 | 86 |
| 1260 Jones Dr | 0.23mi | 3/2.0 | 1,344 (+0%) | 3mo | $170,000 | $126 | 86 |
| 1312 Gloria Ln | 0.12mi | 3/2.0 | 1,344 (+0%) | 9mo | $62,000 | $46 | 86 |
| 1326 Samuel Dr | 0.11mi | 3/2.0 | 1,334 (-0%) | 10mo | $57,900 | $43 | 86 |
| 1312 Rancho Villa Dr | 0.14mi | 3/2.0 | 1,352 (+1%) | 10mo | $125,000 | $92 | 84 |
| 1372 Samuel Dr | 0.13mi | 2/2.0 (-1) | 1,334 (-0%) | 6mo | $55,000 | $41 | 83 |
| 1252 Jones Dr | 0.22mi | 3/2.0 | 1,344 (+0%) | 7mo | $120,000 | $89 | 83 |
| 1370 Samuel Dr | 0.12mi | 3/2.0 | 1,416 (+6%) | 6mo | $135,000 | $95 | 80 |
| 1236 Jones Dr | 0.19mi | 3/2.0 | 1,214 (-9%) | 1mo | $49,900 | $41 | 74 |
| 67 Jade St | 0.58mi | 3/2.0 | 1,344 (+0%) | 2mo | $107,000 | $80 | 71 |
| 1320 Fort Ln | 0.09mi | 3/2.0 | 1,512 (+13%) | 6mo | $130,000 | $86 | 70 |
Match score weights: distance 35% · size 25% · config 20% · recency 20%. Top-matched comps best support the ARV.
Projected returns pro-forma
-3.0% appreciation · 2.4% rent growth · sell at horizon
- IRR
- 29.4%
- Equity multiple
- 2.22×
- Total profit
- $33,896
- Equity at exit
- $14,836
- IRR
- 36.4%
- Equity multiple
- 4.26×
- Total profit
- $90,901
- Equity at exit
- $8,603
Cash invested: $27,860 (down + closing). Projections, not guarantees.
Landlord ↔ Tenant lean methodology
- Overall (STATE)
- 28 Tenant-Leaning
- State Washington
- 28 Tenant-Leaning · D+8
- County
- — inherits STATE
- City
- — inherits STATE
ZIP-level market 99362
- Rents YoY
- 2.4%
- Active inventory
- 427
- Price-to-rent
- 4.7×
Monthly cashflow live
- Estimated rent
- $1,782 high interval (Pro) →
- Mortgage (P&I)
- −$522
- Tax from tax record
- −$42 /mo · $505/yr
- Insurance
- −$41
- HOA
- −$0
- Vacancy / Maint / Mgmt
- −$374
- Net cashflow
- $803
Break-even live
Sensitivity live
| Price | -10% $859 | -5% $831 | +0% $803 | +5% $774 | +10% $746 |
|---|---|---|---|---|---|
| Rent | -10% $662 | -5% $732 | +0% $803 | +5% $873 | +10% $943 |
| Rate | -1.0pp $853 | -0.5pp $828 | base $803 | +0.5pp $777 | +1.0pp $751 |
UW: 25.0% down · 7.5% · 30yr · 1.5% tax · 5.0% vac · 8.0% maint · 8.0% mgmt
Financing live
Cash to close
- Down payment
- $24,875
- Closing costs
- $2,985
- Reserves months
- —
- Total cash needed
- —
Loan-product check · same deal, 3 products live
Conventional
25% down · 7.5% · 30yr
- Down + closing
- —
- Monthly P&I
- —
- Monthly cashflow
- —
- DSCR
- —
- Eligible?
- —
Personal DTI + credit; lowest rate.
DSCR
20% down · 8.5% · 30yr
- Down + closing
- —
- Monthly P&I
- —
- Monthly cashflow
- —
- DSCR
- —
- Eligible?
- —
No personal income docs; deal must DSCR.
Hard money
10% down · 12.0% · 12mo
- Down + closing
- —
- Monthly P&I
- —
- Monthly cashflow
- —
- DSCR
- —
- Eligible?
- —
Short-term bridge; refi at stabilization.
Rent comps 14 comps
| Address | Beds | Baths | Sqft | Rent | $/sqft | DOM | Units | Dist |
|---|---|---|---|---|---|---|---|---|
| 208 Marjorie Pl Unit marj208 Walla Walla, WA | 3.0 | 2.0 | 1080 | $1,295 | $1.20 | 45d | 1 | 0.81mi |
| 1908 Sunset Dr Unit 217 Walla Walla, WA | 3.0 | 2.5 | 1500 | $2,050 | $1.37 | 45d | 1 | 0.86mi |
| 1914 Sunset Dr Unit 1914SUN-B Walla Walla, WA | 2.0 | 1.5 | 952 | $1,625 | $1.71 | 45d | 1 | 0.87mi |
| 265 Avery St Walla Walla, WA | 3.0 | 2.5 | 1268 | $1,995 | $1.57 | 45d | 1 | 0.93mi |
| 1339 Modoc St Walla Walla, WA | 2.0 | 2.0 | 1187 | $2,195 | $1.85 | 45d | 1 | 1.02mi |
| 942 NE Spitzenburg St Apt B104 College Place, WA | 2.0 | 1.5 | 975 | $1,530 | $1.57 | 45d | 1 | 1.06mi |
| 332 S 3rd Ave Walla Walla, WA | 2.0 | 1.0 | 1084 | $1,630 | $1.50 | 45d | 1 | 1.16mi |
| 22 NE Hadley Way #1 College Place, WA | 2.0 | 2.5 | 1150 | $2,095 | $1.82 | 45d | 1 | 1.18mi |
| 425 N 7th Ave Apt 2 Walla Walla, WA | 4.0 | 2.5 | 1697 | $1,795 | $1.06 | 45d | 1 | 1.32mi |
| 2121 S 2nd Ave Apt 304 Walla Walla, WA | 2.0 | 1.5 | 975 | $1,530 | $1.57 | 45d | 1 | 1.34mi |
| 420 Catherine St #3 Walla Walla, WA | 2.0 | 1.0 | 890 | $1,295 | $1.46 | 45d | 1 | 1.37mi |
| 255 Elder Pl #3 College Place, WA | 2.0 | 1.0 | 889 | $1,415 | $1.59 | 45d | 1 | 1.39mi |
| 310 SE 3rd St Unit 4 College Place, WA | 2.0 | 1.0 | 1300 | $1,300 | $1.00 | 45d | 1 | 1.49mi |
| 218 E Whitman Dr Unit 1 College Place, WA | 4.0 | 2.5 | 1485 | $2,240 | $1.51 | 45d | 1 | 1.50mi |
Listing history 21 events
-
2026-06-21days on market $99,500 Active 37 DOM
-
2026-06-19days on market $99,500 Active 35 DOM
-
2026-06-18days on market $99,500 Active 34 DOM
-
2026-06-17days on market $99,500 Active 33 DOM
-
2026-06-16days on market $99,500 Active 32 DOM
-
2026-06-15days on market $99,500 Active 31 DOM
-
2026-06-14days on market $99,500 Active 29 DOM
-
2026-06-12days on market $99,500 Active 28 DOM
-
2026-06-09days on market $99,500 Active 25 DOM
-
2026-06-08days on market $99,500 Active 24 DOM
-
2026-06-07days on market $99,500 Active 23 DOM
-
2026-06-02days on market $99,500 Active 18 DOM
-
2026-06-01days on market $99,500 Active 17 DOM
-
2026-05-31days on market $99,500 Active 16 DOM
-
2026-05-30days on market $99,500 Active 15 DOM
-
2026-05-15$99,500 Active
-
2025-06-27soldstatus $75,000 Closed
-
2025-06-21status Pending
-
2025-05-16price $79,900
-
2025-04-16price $89,900
-
2025-03-02$99,500 Active
ⓘ Source: listings_history table (triggers on properties + properties_extension) + one-shot
backfill from property_details.listing_events for pre-trigger history.
Tax reassessment forecast WA · Resets to sale price
- Current annual tax
- $505 · $42/mo
- Projected year-2 tax
- $975 · $81/mo
- Expected delta
- +$470/yr (+$39/mo · 93.2%)
ⓘ Screening estimate from a state-policy table — verify with the county assessor before closing.
Nearby sold comps map
Loading sold comps map…
Walkable amenities ~0.75 mi
Loading nearby amenities…
Taxation est. · year 1
- Rental income
- $21,385
- − Mortgage interest
- −$5,574
- − Property taxes
- −$505
- − Insurance
- −$498
- − Repairs & maintenance
- −$1,711
- − Management
- −$1,711
- − Depreciation
- −$2,895
- Taxable income
- $8,493
- Est. tax owed @ 24.0%
- −$2,038
- After-tax cash flow
- $7,592/yr
For passive investors: Depreciation is non-cash, so a rental often shows a tax loss while cash-flowing — sheltering income. Rental losses are passive: they offset passive income freely, and up to $25,000/yr can offset ordinary (W-2) income if you actively participate and your MAGI is under $100k (phasing out to $0 by $150k); unused losses carry forward. On sale, claimed depreciation is recaptured at up to 25%, and gains may owe capital-gains tax (a 1031 exchange can defer both). Figures are a year-1 estimate at your 24.0% rate — not tax advice; consult a CPA.
Schools (NCES district)
- District
- Walla Walla Public Schools
- NCES district ID
- 5309450
- Math proficiency
- 41% ▲ 3.00%
- Reading proficiency
- 50% ▼ -1.00%
- Median HH income
- $46,207
- Composite
- 40.88/100
- National rank
- #7531
- State rank
- #179 of 291 in WA
Livability — Walla Walla
- Score
- 79/100
- State rank
- #105
- US rank
- #2015
Category grades
Schools grade is shown separately in the Schools card above.
Census & demographics
- Census place
- Walla Walla, WA
- County
- Walla Walla County · 52,990 people
- City population
- 42,853
- Metro
- Walla Walla, WA
- Population (ZIP)
- 42,853
- Household income
- $72,474
- Rent vs Own
- Severe rent burden
- 1238.0
Population outlook (Walla Walla County) Hauer SSP2
- Today (2025)
- 63,088 people
- By 2030
- 64,417 · +2.1%
- By 2040
- 66,563 · +5.5%
- By 2050
- 68,337 · +8.3%
- By 2075
- 73,235 · +16.1%
- By 2100
- 74,878 · +18.7%
Race, ethnicity, and origin ACS 2023
- Neighborhood character
- Predominantly White (69%)
- Race & ethnicity
- White 69% Hispanic / Latino 22% Two or more races 9% Black 2% Asian 2% Native American 2%
- Hispanic origin (detail)
- Mexican 17%
- Common ancestry
- Slovak 3% Portuguese 3% Lithuanian 3%
- Foreign-born
- 9% · Canada, China
- Languages at home
- 83% English-only · Spanish 15% Chinese 1%
Political lean MEDSL · Walla Walla
- 2024 margin
- Lean R (+8.1) · D 44.6% · R 52.7% · Other 2.7%
- 2008→2024 swing
- +8.5pp toward D · 2008: -16.6pp · 2024: -8.1pp
- All cycles
- 2024: R+8.1 2020: R+8.7 2016: R+16.4 2012: R+22.3 2008: R+16.6
Not yet ingested
- Civics
- —
Market trends
- HPI YoY
- ▼ -488.03%
- Current HPI
- 321.6891
- Rent YoY
- ▲ 2.40%
- Metro
- Walla Walla, WA
- State GDP YoY
- ▲ 4.65%
- F500 in state
- 22
Industry mix (Fortune 500 HQ in WA)
| Industry | F500 HQs | Revenue |
|---|---|---|
| Retail | 2 | $269B |
|
||
| Technology / Retail | 1 | $638B |
|
||
| Technology | 1 | $245B |
|
||
| Telecommunications | 1 | $38B |
|
||
| Food / Beverage | 1 | $36B |
|
||
| Automotive / Trucks | 1 | $34B |
|
||
Price history
+0.0% since first listed6 events — show timeline
- 2026-05-15 Listed $99,500 NWMLS as Distributed by MLS Grid
- 2025-06-27 Sold (MLS) $75,000 NWMLS as Distributed by MLS Grid
- 2025-06-21 Pending — NWMLS as Distributed by MLS Grid
- 2025-05-16 Price Changed $79,900 NWMLS as Distributed by MLS Grid
- 2025-04-16 Price Changed $89,900 NWMLS as Distributed by MLS Grid
- 2025-03-02 Listed $99,500 NWMLS as Distributed by MLS Grid
Property tax history
+7.0%/yrLatest (2026): $505 · +8.6% YoY. Source: county tax records.
Cash-flow waterfall
monthlySold comps — $/sqft
last 12 mo · ≤1 miLoading sold comps…