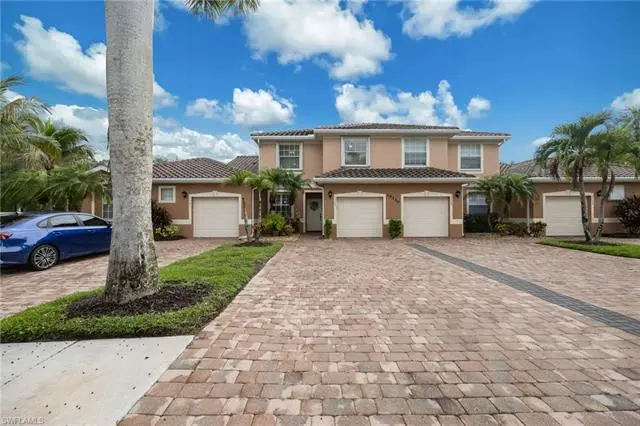
14130 Winchester Ct #1502 · Winding Cypress, FL
Flood risk 6/10 · Moderate
- FEMA flood zone
- X (shaded)
- Chance of flooding over 30 yrs
- 0.67%
- Est. flood insurance / yr
- $507 – $1,088
Fire risk 4/10 · Minor
- Est. fire insurance / yr
- $947 – $1,759
Heat risk 10/10 · Severe
- Hot days now (above 108°F)
- 7 days/yr
- Hot days in 30 yrs
- 29 days/yr
Wind risk 10/10 · Severe
- Chance of severe wind over 30 yrs
- 99.0%
Air-quality risk 2/10 · Minimal
- Unhealthy air days now
- 2 days/yr
- Unhealthy air days in 30 yrs
- 2 days/yr
Risk factors via First Street. Map © Google.
Why this score? — see what drove the B grade
The composite is a weighted blend of 9 inputs, each scored 0–100. Each bar is that input's sub-score; the figure is the points it added to the 100-point composite (weight × sub-score).
- Cash flow +29.6/30.0
- DSCR +10.0/10.0
- 1% rule +9.7/10.0
- ARV discount +7.5/15.0
- Schools +5.0/10.0
- Appreciation +4.3/10.0
- Rent growth +3.3/5.0
- Livability +2.5/5.0
- Condition / age +2.5/5.0
$349,000
🖨 Deal sheet 📄 Offer letter ✓ Due diligence
Listing remarks
Enjoy sunsets and peaceful garden views from this beautifully maintained Engle Homes Sanibel III floor plan located on a quiet cul-de-sac in Reflection Lakes. This 3-bedroom, 2.5-bath townhome condo features an open-concept design with vaulted ceilings throughout the main living area and an extended screened lanai overlooking an expansive green space and privacy wall. The kitchen offers a breakfast nook, new stainless steel appliances, updated faucet and deep sink that overlooks the living and dining areas. Fresh interior paint, updated lighting, custom drapery and tasteful finishes are found throughout the home. The first-floor primary suite features vaulted ceilings, a walk-in closet, and
Key facts
- Open-concept design
- Breakfast nook
- Cul-de-sac
Tags
Property features AI
Finance
- Other: Part of a complex of 76 units with 4 units per building and 2 floors; Subdivision: Reflection Lakes of Naples
- HOA & community: Mandatory HOA; Monthly master HOA fee; Monthly condo fee; Professional management; Maintenance covers cable, insurance, internet/Wi-Fi, irrigation water, lawn/land maintenance, legal/accounting, manager, master association fee, exterior pest control, recreation facilities, reserves, sewer, street lights, and trash removal; Community amenities include clubhouse, community pool, exercise room, billiards, bocce court, bike and jog path, BBQ/picnic area, community room, hobby room, library, sidewalks, and streetlights; Gated community; Total annual recurring fees reported
Exterior
- Parking: Paved driveway; Attached 1-car garage
- Security: Gated community; Unmonitored alarm
- Utilities: Central water (assessment paid); Central sewer (assessment paid); Cable available
- Home design: Residential townhouse; 2-story design; Rear exposure faces northwest
- Construction: Built in 2006; Concrete block construction
- Exterior features: Stucco exterior; Tile roof; Single-hung windows; Electric and manual shutters; Gated community; Cul-de-sac location; Landscaped area and privacy wall; Irrigation system with assessment paid and reclaimed water
Interior
- Kitchen: Pantry; Dishwasher; Disposal; Microwave; Range; Refrigerator/ice maker; Eat-in kitchen with breakfast area
- Bedrooms: 3 bedrooms; Master bedroom on ground level; Split bedroom floorplan
- Flooring: Carpet; Tile
- Bathrooms: 2 full bathrooms; 1 half bathroom; Master bath with dual sinks and shower (no tub)
- Heating & cooling: Central electric heat (heat pump); Central electric cooling (heat pump); Ceiling fans (4)
- Interior features: Cable prewire; Fire sprinkler system; Pantry; Smoke detectors; Volume ceilings; Walk-in closet; Window coverings; Auto garage door; Security system; Screened lanai/porch; Laundry in residence; Negotiable furnishing
- Laundry & utility: Washer and dryer included; Laundry located inside the residence
Neighborhood map
What this means for you Summary
Snapshot
- This is a 3-bed/2.5-bath townhouse listed at $349k.
Deal economics
- At list price, monthly cash flow is $1k ($15k/yr) — positive.
- The deal already cash-flows at list — no discount required.
- Meets the 1% rule at list price ($5k rent vs $349k).
Location & tenants
- Location reads: area grade B — affects rentability + tenant quality, not the cash-flow math above.
- Collier (suburban): math 60% / reading 56% proficiency, ranked #16 of 73 in FL (top 22%) — acceptable for families but not a draw, mixed tenant base, ~2y average lease.
- Zoned schools: Manatee Elementary School (math 58% / reading 51%, grade C, #892 of 2,144 statewide, top 44%, 584 students, 73% FRL); Lely High School (math 40% / reading 39%, grade F, #304 of 667 statewide, top 47%, 1,504 students, 54% FRL).
- Market conditions: Rents rising (+3.2%/yr); 900 active listings in the ZIP; 40 comparable units currently listed for rent nearby; rentals at typical pace (median 24d on market — plan ~3-4 weeks tenant-placement turnaround); solid renter incomes; 3,520 units permitted in Collier County in 2024 (959 in 5+ unit buildings).
- At $5,139/mo this rent would consume 69% of the median local household income ($89k/yr) (locally 550% of renters already pay >50% of income on rent) — very limited rent-growth headroom before tenants either downsize or default.
Forward outlook
- Local home prices are declining (-1.5%/yr); year-one equity from $2k of loan paydown is wiped out by about $5k of value loss. Plan a longer hold.
- Collier County population projected at +30% by 2050 — long-run rental-demand tailwind backs the buy-and-hold thesis.
- At projected returns (-1.5% appreciation + 3.2% rent growth), your $98k cash investment doubles in ~6 years — after that, you're playing with house money.
Negotiation context
- Only 13 days on market — expect competitive offers; lowballing is unlikely to land.
- 3 sale attempts since 20y ago with the ask held roughly flat each time — persistent listings suggest the price (not the market) is what's stuck; bring a comps-based counter.
- Current owner paid $281k; 24% above their basis — modest negotiation headroom, anchor on the comps not their cost.
Risks & watch-outs
- Climate carrying-cost: major flood risk; severe wind risk, 99% chance of damaging wind over 30y; extreme-heat days projected 7→29/yr by 2055 (HVAC capex compounding) — expect insurance premiums to compound above CPI over the hold.
Questions for the listing agent
- What does the HOA fee cover, when was the last increase, and are there any pending special assessments or reserve-fund shortfalls?
- Is there a deadline driving the sale (1031 exchange, divorce, estate, relocation)? That informs how much negotiation room exists.
- What's the average days-on-market for RENTAL listings here right now (not sales)? A rising rental-DOM trend means longer vacancies and softer asking-rent achievability than the comps imply.
- What's the recent tenant-quality profile in this submarket — average credit score on applications, eviction rate, late-payment / NSF rate, and stable-employment percentage? A property-management company in the area should have these aggregated.
- How much new for-sale + rental construction is in the pipeline within 1–3 miles? Heavy new supply typically softens prices + rents 12–24 months out; constrained supply supports both.
Investment metrics
- 1% rule
- 1.47% ✓
- Cap rate
- 10.61%
- Cash-on-cash
- 15.41%
- DSCR
- 1.69
- GRM
- 5.7
CMA / ARV
No comps found within radius.
Projected returns pro-forma
-1.48% appreciation · 3.21% rent growth · sell at horizon
- IRR
- 11.1%
- Equity multiple
- 1.49×
- Total profit
- $47,525
- Equity at exit
- $76,261
- IRR
- 18.0%
- Equity multiple
- 2.75×
- Total profit
- $170,908
- Equity at exit
- $73,461
Cash invested: $97,720 (down + closing). Projections, not guarantees.
Landlord ↔ Tenant lean methodology
- Overall (STATE)
- 87 Strongly Landlord-Friendly
- State Florida
- 87 Strongly Landlord-Friendly · R+3
- County
- — inherits STATE
- City
- — inherits STATE
ZIP-level market 34114
- Home prices YoY
- -0.6%
- Rents YoY
- 3.2%
- Active inventory
- 900
- Price-to-rent
- 5.7×
Monthly cashflow live
- Estimated rent
- $5,139 high interval (Pro) →
- Mortgage (P&I)
- −$1,830
- Tax from tax record
- −$134 /mo · $1,613/yr
- Insurance
- −$145
- HOA
- −$695
- Vacancy / Maint / Mgmt
- −$1,079
- Net cashflow
- $1,255
Break-even live
UW: 25.0% down · 7.5% · 30yr · 1.5% tax · 5.0% vac · 8.0% maint · 8.0% mgmt
Financing live
Cash to close
- Down payment
- $87,250
- Closing costs
- $10,470
- Reserves months
- —
- Total cash needed
- —
Loan-product check · same deal, 3 products live
Conventional
25% down · 7.5% · 30yr
- Down + closing
- —
- Monthly P&I
- —
- Monthly cashflow
- —
- DSCR
- —
- Eligible?
- —
Personal DTI + credit; lowest rate.
DSCR
20% down · 8.5% · 30yr
- Down + closing
- —
- Monthly P&I
- —
- Monthly cashflow
- —
- DSCR
- —
- Eligible?
- —
No personal income docs; deal must DSCR.
Hard money
10% down · 12.0% · 12mo
- Down + closing
- —
- Monthly P&I
- —
- Monthly cashflow
- —
- DSCR
- —
- Eligible?
- —
Short-term bridge; refi at stabilization.
Rent comps 40 comps
| Address | Beds | Baths | Sqft | Rent | $/sqft | DOM | Units | Dist |
|---|---|---|---|---|---|---|---|---|
| 14214 Manchester Dr Naples, FL | 3.0 | 2.0 | 1560 | $2,800 | $1.79 | 23d | 1 | 0.28mi |
| 14214 Manchester Dr Naples, FL | 3.0 | 2.0 | 1560 | $2,700 | $1.73 | 21d | 1 | 0.28mi |
| 14678 Fern Lake Ct Unit 1049694P Naples, FL | 3.0 | 2.0 | 2142 | $6,065 | $2.83 | 13d | 1 | 0.41mi |
| 14837 Windward Ln Naples, FL | 4.0 | 2.0 | 2046 | $4,995 | $2.44 | 23d | 1 | 0.43mi |
| 14103 Nautica Ct Naples, FL | 3.0 | 2.5 | 1850 | $3,650 | $1.97 | 23d | 1 | 0.49mi |
| 9267 Museo Cir Unit 204 Naples, FL | 3.0 | 3.5 | 2100 | $5,200 | $2.48 | 23d | 1 | 0.49mi |
| 14796 Canton Ct Naples, FL | 3.0 | 2.0 | 1677 | $7,000 | $4.17 | 23d | 1 | 0.50mi |
| 14162 Nautica Ct Naples, FL | 3.0 | 2.0 | 1684 | $3,800 | $2.26 | 23d | 1 | 0.53mi |
| 2244 Yellowfin Cir Naples, FL | 3.0 | 2.0 | 1655 | $3,300 | $1.99 | 13d | 1 | 0.54mi |
| 9259 Museo Cir #102 Naples, FL | 3.0 | 3.0 | 2100 | $4,150 | $1.98 | 23d | 1 | 0.56mi |
| 2235 Yellowfin Cir Naples, FL | 2.0 | 2.0 | 1500 | $2,795 | $1.86 | 23d | 1 | 0.57mi |
| 1937 Yellowfin Cir Naples, FL | 3.0 | 2.0 | 2214 | $3,830 | $1.73 | 21d | 1 | 0.57mi |
| 9255 Museo #103 Naples, FL | 3.0 | 3.0 | 2100 | $9,000 | $4.29 | 23d | 1 | 0.58mi |
| 9243 Tesoro Ln Unit 2 Naples, FL | 3.0 | 3.0 | 2100 | $6,500 | $3.10 | 13d | 1 | 0.69mi |
| 7674 Jacaranda Ln Naples, FL | 2.0 | 2.0 | 1554 | $3,800 | $2.45 | 23d | 1 | 0.74mi |
| 9242 Tesoro Ln Unit 1-102 Naples, FL | 3.0 | 3.0 | 2237 | $3,000 | $1.34 | 23d | 1 | 0.75mi |
| 2057 Yellowfin Cir Naples, FL | 3.0 | 3.0 | 2080 | $7,800 | $3.75 | 23d | 1 | 0.75mi |
| 2122 Yellowfin Cir Naples, FL | 4.0 | 3.0 | 2200 | $3,200 | $1.45 | 13d | 1 | 0.75mi |
| 14670 Catamaran Pl Naples, FL | 3.0 | 2.0 | 1816 | $7,000 | $3.85 | 23d | 1 | 0.76mi |
| 7662 Jacaranda Ln Naples, FL | 2.0 | 2.0 | 1555 | $3,500 | $2.25 | 13d | 1 | 0.76mi |
| 130 Grassy Key Ln Naples, FL | 3.0 | 2.0 | 1248 | $1,850 | $1.48 | 13d | 1 | 0.77mi |
| 130 Grassy Key Ln #37 Naples, FL | 3.0 | 2.0 | 1248 | $1,795 | $1.44 | 13d | 1 | 0.77mi |
| 14662 Catamaran Pl Naples, FL | 3.0 | 2.0 | 2034 | $7,000 | $3.44 | 23d | 1 | 0.78mi |
| 7631 Jacaranda Ln Naples, FL | 2.0 | 2.0 | 1542 | $7,000 | $4.54 | 23d | 1 | 0.82mi |
| 7567 Winding Cypress Dr Naples, FL | 3.0 | 2.0 | 1805 | $11,500 | $6.37 | 23d | 1 | 0.86mi |
| 14827 Edgewater Cir Naples, FL | 2.0 | 2.0 | 1515 | $6,500 | $4.29 | 23d | 1 | 0.93mi |
| 14546 Tropical Dr Naples, FL | 4.0 | 2.0 | 2046 | $5,500 | $2.69 | 23d | 1 | 0.95mi |
| 14888 Edgewater Cir Naples, FL | 2.0 | 2.0 | 1515 | $6,200 | $4.09 | 23d | 1 | 0.96mi |
| 14715 Kelson Cir Naples, FL | 3.0 | 3.5 | 2225 | $12,000 | $5.39 | 23d | 1 | 0.96mi |
| 14606 Tropical Dr Naples, FL | 3.0 | 2.0 | 2046 | $9,500 | $4.64 | 23d | 1 | 0.98mi |
| 14940 Edgewater Cir Naples, FL | 2.0 | 2.0 | 1519 | $7,200 | $4.74 | 23d | 1 | 1.00mi |
| 14551 Edgewater Cir Naples, FL | 2.0 | 2.0 | 1515 | $6,000 | $3.96 | 23d | 1 | 1.04mi |
| 14558 Edgewater Cir Naples, FL | 2.0 | 2.0 | 1519 | $6,500 | $4.28 | 23d | 1 | 1.06mi |
| 14567 Edgewater Cir Naples, FL | 2.0 | 2.0 | 1515 | $6,500 | $4.29 | 23d | 1 | 1.07mi |
| 14582 Edgewater Cir Naples, FL | 2.0 | 2.0 | 1515 | $7,500 | $4.95 | 23d | 1 | 1.08mi |
| 14680 Edgewater Cir Naples, FL | 2.0 | 2.0 | 1515 | $3,195 | $2.11 | 23d | 1 | 1.08mi |
| 14672 Edgewater Cir Naples, FL | 2.0 | 2.0 | 1519 | $6,500 | $4.28 | 23d | 1 | 1.09mi |
| 14610 Edgewater Cir Naples, FL | 2.0 | 2.0 | 1894 | $7,500 | $3.96 | 23d | 1 | 1.10mi |
| 14644 Edgewater Cir Naples, FL | 2.0 | 2.0 | 1519 | $7,000 | $4.61 | 23d | 1 | 1.11mi |
| 14632 Edgewater Cir Unit 1049696P Naples, FL | 2.0 | 2.0 | 1506 | $6,237 | $4.14 | 13d | 1 | 1.11mi |
HOA detail
- Monthly dues
- $695 · $8,340/yr
Listing history 10 events
-
2026-06-18days on market $349,000 Active 13 DOM
-
2026-06-17days on market $349,000 Active 12 DOM
-
2026-06-16days on market $349,000 Active 11 DOM
-
2026-06-15days on market $349,000 Active 10 DOM
-
2026-06-14days on market $349,000 Active 8 DOM
-
2026-06-10days on market $349,000 Active 5 DOM
-
2026-06-09days on market $349,000 Active 4 DOM
-
2026-06-08days on market $349,000 Active 3 DOM
-
2026-06-07remarks 699-char remark
-
2026-06-07$349,000 Active 2 DOM
ⓘ Source: listings_history table (triggers on properties + properties_extension) + one-shot
backfill from property_details.listing_events for pre-trigger history.
Tax reassessment forecast FL · Resets to sale price
- Current annual tax
- $1,613 · $134/mo
- Projected year-2 tax
- $2,897 · $241/mo
- Expected delta
- +$1,284/yr (+$107/mo · 79.6%)
ⓘ Screening estimate from a state-policy table — verify with the county assessor before closing.
Climate risk First Street
- Flood 6/10 Major FEMA zone X (shaded) · 67% chance over 30 yrs
- Wildfire 4/10 Moderate
- Heat 10/10 Extreme 7 d/yr ≥108°F today · 29 d/yr by 30 yrs out
- Wind 10/10 Extreme 99% chance of damaging wind over 30 yrs
- Air quality 2/10 Low 2 unhealthy d/yr today · 2 by 30 yrs out
Nearby sold comps map
Loading sold comps map…
Walkable amenities ~0.75 mi
Loading nearby amenities…
Taxation est. · year 1
- Rental income
- $61,663
- − Mortgage interest
- −$19,549
- − Property taxes
- −$1,613
- − Insurance
- −$1,745
- − Repairs & maintenance
- −$4,933
- − Management
- −$4,933
- − HOA
- −$8,340
- − Depreciation
- −$10,153
- Taxable income
- $10,397
- Est. tax owed @ 24.0%
- −$2,495
- After-tax cash flow
- $12,559/yr
For passive investors: Depreciation is non-cash, so a rental often shows a tax loss while cash-flowing — sheltering income. Rental losses are passive: they offset passive income freely, and up to $25,000/yr can offset ordinary (W-2) income if you actively participate and your MAGI is under $100k (phasing out to $0 by $150k); unused losses carry forward. On sale, claimed depreciation is recaptured at up to 25%, and gains may owe capital-gains tax (a 1031 exchange can defer both). Figures are a year-1 estimate at your 24.0% rate — not tax advice; consult a CPA.
Schools (NCES district)
- District
- Collier
- NCES district ID
- 1200330
- Math proficiency
- 60% ▼ -4.00%
- Reading proficiency
- 56% ▼ -2.00%
- Median HH income
- $58,275
- Composite
- 50.23/100
- National rank
- #1892
- State rank
- #16 of 73 in FL
Livability — Winding Cypress
No livability data for this city. (Only ~50 U.S. cities are tracked.)
Census & demographics
- County
- Collier County · 396,295 people
- Metro
- Naples-Marco Island, FL
- Population (ZIP)
- 23,559
- Household income
- $89,334
- Rent vs Own
- Severe rent burden
- 550.0
Population outlook (Collier County) Hauer SSP2
- Today (2025)
- 420,858 people
- By 2030
- 450,054 · +6.9%
- By 2040
- 502,232 · +19.3%
- By 2050
- 544,932 · +29.5%
- By 2075
- 627,203 · +49.0%
- By 2100
- 659,015 · +56.6%
Race, ethnicity, and origin ACS 2023
- Neighborhood character
- Predominantly White (72%)
- Race & ethnicity
- White 72% Hispanic / Latino 17% Two or more races 13% Black 7%
- Hispanic origin (detail)
- Mexican 7% Puerto Rican 1% Cuban 3%
- Common ancestry
- Hispanic 5% Romanian 4% Lithuanian 1%
- Foreign-born
- 21% · Canada, Jamaica
- Languages at home
- 75% English-only · Spanish 15% French/Haitian/Cajun 5% Other Indo-European 4%
Political lean MEDSL · Collier
- 2024 margin
- Solid R (+33.1) · D 33.1% · R 66.2%
- 2008→2024 swing
- -10.6pp toward R · 2008: -22.5pp · 2024: -33.1pp
- All cycles
- 2024: R+33.1 2020: R+24.7 2016: R+26.0 2012: R+30.1 2008: R+22.5
Not yet ingested
- Civics
- —
Market trends
- HPI YoY
- ▼ -1.48%
- Current HPI
- 266.5545
- Rent YoY
- ▲ 3.21%
- Metro
- Naples-Marco Island, FL
- State GDP YoY
- ▲ 3.28%
- F500 in state
- 36
Industry mix (Fortune 500 HQ in FL)
| Industry | F500 HQs | Revenue |
|---|---|---|
| Industrial Technology | 2 | $29B |
|
||
| Insurance | 2 | $17B |
|
||
| Retail | 1 | $60B |
|
||
| Technology Distribution | 1 | $58B |
|
||
| Homebuilding | 1 | $35B |
|
||
| Technology Manufacturing | 1 | $35B |
|
||
Price history
+90.5% since first listed7 events — show timeline
- 2026-06-05 Listed $349,000 NAPLESMLS
- 2021-10-28 Listing Removed — NAPLESMLS
- 2021-10-19 Pending — NAPLESMLS
- 2021-10-06 Listed $339,900 NAPLESMLS
- 2006-12-04 Listed $260,000 MIML
- 2006-10-10 Sold (Public Records) $281,000 Public Records
- 2006-09-25 Sold (Public Records) $183,244 Public Records
Property tax history
+1.0%/yrLatest (2025): $1,613 · +6.6% YoY. Source: county tax records.
Cash-flow waterfall
monthlySold comps — $/sqft
last 12 mo · ≤1 miLoading sold comps…