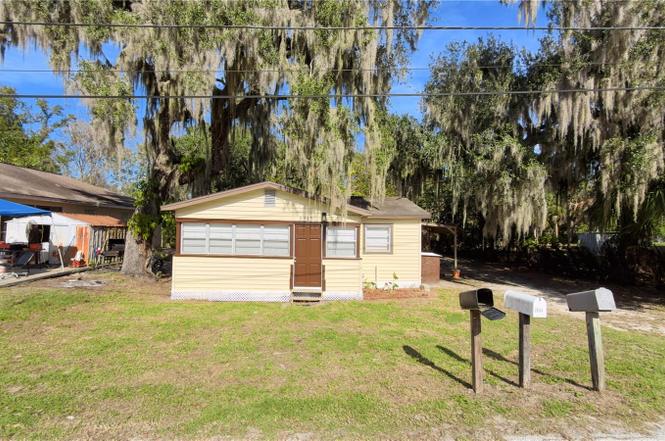
2565 4th St · Fuller Heights, FL
Flood risk 1/10 · Minimal
- FEMA flood zone
- X (unshaded)
- Chance of flooding over 30 yrs
- 0.0%
- Est. flood insurance / yr
- $507 – $1,088
Fire risk 6/10 · Moderate
- Est. fire insurance / yr
- $947 – $1,759
Heat risk 9/10 · Severe
- Hot days now (above 108°F)
- 7 days/yr
- Hot days in 30 yrs
- 24 days/yr
Wind risk 9/10 · Severe
- Chance of severe wind over 30 yrs
- 99.0%
Air-quality risk 2/10 · Minimal
- Unhealthy air days now
- 2 days/yr
- Unhealthy air days in 30 yrs
- 2 days/yr
Risk factors via First Street. Map © Google.
Why this score? — see what drove the B- grade
The composite is a weighted blend of 9 inputs, each scored 0–100. Each bar is that input's sub-score; the figure is the points it added to the 100-point composite (weight × sub-score).
- Cash flow +30.0/30.0
- DSCR +10.0/10.0
- 1% rule +8.6/10.0
- ARV discount +7.5/15.0
- Schools +3.5/10.0
- Livability +3.2/5.0
- Rent growth +2.9/5.0
- Condition / age +2.5/5.0
- Appreciation +0.0/10.0
$103,900
🖨 Deal sheet 📄 Offer letter ✓ Due diligence
Listing remarks
Under contract-accepting backup offers. Welcome home to this 2 bedroom/1 bath bungalow. Luxury Plank Flooring throughout with new ceiling fans and lighting. Eat-in Kitchen features refrigerator, microwave, range and maple cabinets. Bath has cultured marble vanity and shower/tub combination. Use the enclosed porch as a sitting room or flex room. The side porch provides shade and space to cook-out or relax. Close to Downtown Lakeland and Lakeland Airport.
Key facts
- Lakeland airport
- Downtown lakeland
- Eat-in kitchen
Tags
Property features AI
Exterior
- Utilities: Public water; Septic tank sewer; Electricity connected
- Home design: Single-family residence; One story; Southeast facing; Residential property
- Construction: Vinyl siding and frame construction; Shingle roof; Crawlspace foundation; Built on one level
- Exterior features: Private mailbox; Asphalt road access
Interior
- Kitchen: Microwave; Range; Refrigerator
- Bedrooms: 2 bedrooms
- Bathrooms: 1 full bathroom
- Heating & cooling: Ductless heating; Wall/window cooling units
- Interior features: Ceiling fans
- Laundry & utility: No laundry room listed
Neighborhood map
What this means for you Summary
Snapshot
- This is a 2-bed/1.0-bath single-family listed at $104k.
Deal economics
- At list price, monthly cash flow is $401 ($5k/yr) — positive.
- The deal already cash-flows at list — no discount required.
- Meets the 1% rule at list price ($1k rent vs $104k).
- Recommended offer: $95k (9.0% below list) — sets the bar for market timing.
Location & tenants
- Location reads 63/100 on livability (#720 in FL) — a middle-class / working-renter tenant base. Strengths: housing A+, cost of living A-, crime B; Watch: schools F, amenities F, commute F.
- Polk (suburban): math 39% / reading 43% proficiency, ranked #62 of 73 in FL (top 85%) — families likely to look elsewhere, expect single-tenant / working-renter base with shorter leases.
- Market conditions: Rents rising (+1.6%/yr); 180 active listings in the ZIP; 10,384 units permitted in Polk County in 2024 (1,716 in 5+ unit buildings).
Forward outlook
- Local home prices are declining (-3.0%/yr); year-one equity from $718 of loan paydown is wiped out by about $3k of value loss. Plan a longer hold.
- Polk County population projected at +33% by 2050 — long-run rental-demand tailwind backs the buy-and-hold thesis.
- At projected returns (-3.0% appreciation + 1.6% rent growth), your $29k cash investment doubles in ~9 years — after that, you're playing with house money.
Negotiation context
- It's been on market 97 days — a 9% lower offer ($95k) is reasonable based on typical stale-listing flexibility.
- 6 sale attempts since 19y ago; this cycle's ask has dropped $11k (10%) from the opening price — seller is motivated, your offer sets the floor, not the list.
Risks & watch-outs
- Watch-outs: built in 1958 — expect roof / HVAC / electrical / plumbing capex.
- Climate carrying-cost: severe wind risk, 99% chance of damaging wind over 30y; major wildfire risk; extreme-heat days projected 7→24/yr by 2055 (HVAC capex compounding) — expect insurance premiums to compound above CPI over the hold.
Questions for the listing agent
- It's been on market 97 days. Have you received any prior offers? Is the seller open to a 9% concession, seller financing, or rate buy-down credit?
- Built in 1958 — when were the roof, HVAC, electrical panel, plumbing, and water heater last replaced?
- Why hasn't it sold? Are there any deal-killer items the seller is aware of (foundation, flood, title, zoning, code violations)?
- Is there a deadline driving the sale (1031 exchange, divorce, estate, relocation)? That informs how much negotiation room exists.
- Schools are F-rated, which usually means shorter tenancies and higher turnover. Who's the typical renter profile here, and what's been the actual vacancy rate?
- What's the average days-on-market for RENTAL listings here right now (not sales)? A rising rental-DOM trend means longer vacancies and softer asking-rent achievability than the comps imply.
- What's the recent tenant-quality profile in this submarket — average credit score on applications, eviction rate, late-payment / NSF rate, and stable-employment percentage? A property-management company in the area should have these aggregated.
- How much new for-sale + rental construction is in the pipeline within 1–3 miles? Heavy new supply typically softens prices + rents 12–24 months out; constrained supply supports both.
Investment metrics
- 1% rule
- 1.36% ✓
- Cap rate
- 10.92%
- Cash-on-cash
- 16.53%
- DSCR
- 1.74
- GRM
- 6.1
CMA / ARV
No comps found within radius.
Projected returns pro-forma
-3.0% appreciation · 1.59% rent growth · sell at horizon
- IRR
- 6.0%
- Equity multiple
- 1.23×
- Total profit
- $6,738
- Equity at exit
- $15,492
- IRR
- 14.1%
- Equity multiple
- 2.06×
- Total profit
- $30,950
- Equity at exit
- $8,983
Cash invested: $29,092 (down + closing). Projections, not guarantees.
Landlord ↔ Tenant lean methodology
- Overall (STATE)
- 87 Strongly Landlord-Friendly
- State Florida
- 87 Strongly Landlord-Friendly · R+3
- County
- — inherits STATE
- City
- — inherits STATE
ZIP-level market 33860
- Home prices YoY
- -22.4%
- Rents YoY
- 1.6%
- Active inventory
- 180
- Price-to-rent
- 6.1×
Monthly cashflow live
- Estimated rent
- $1,408 medium interval (Pro) →
- Mortgage (P&I)
- −$545
- Tax from tax record
- −$124 /mo · $1,483/yr
- Insurance
- −$43
- HOA
- −$0
- Vacancy / Maint / Mgmt
- −$296
- Net cashflow
- $401
Break-even live
UW: 25.0% down · 7.5% · 30yr · 1.5% tax · 5.0% vac · 8.0% maint · 8.0% mgmt
Financing live
Cash to close
- Down payment
- $25,975
- Closing costs
- $3,117
- Reserves months
- —
- Total cash needed
- —
Loan-product check · same deal, 3 products live
Conventional
25% down · 7.5% · 30yr
- Down + closing
- —
- Monthly P&I
- —
- Monthly cashflow
- —
- DSCR
- —
- Eligible?
- —
Personal DTI + credit; lowest rate.
DSCR
20% down · 8.5% · 30yr
- Down + closing
- —
- Monthly P&I
- —
- Monthly cashflow
- —
- DSCR
- —
- Eligible?
- —
No personal income docs; deal must DSCR.
Hard money
10% down · 12.0% · 12mo
- Down + closing
- —
- Monthly P&I
- —
- Monthly cashflow
- —
- DSCR
- —
- Eligible?
- —
Short-term bridge; refi at stabilization.
Listing history 20 events
-
2026-05-21status Pending
-
2026-05-14price $103,900
-
2026-05-07price $104,900
-
2026-04-27price $106,900
-
2026-04-10price $108,900
-
2026-04-01price $109,900
-
2026-03-26price $111,900
-
2026-03-19price $112,900
-
2026-02-27price $113,900
-
2026-02-13$114,900 Active
-
2024-01-30historical $1,100
-
2024-01-15$1,100
-
2017-02-10soldstatus $265,300
-
2010-06-11historical
-
2010-01-06$47,500
-
2009-05-12historical
-
2009-01-16$90,000
-
2008-03-18historical
-
2008-03-17$125,000
-
2007-11-12$160,000
ⓘ Source: listings_history table (triggers on properties + properties_extension) + one-shot
backfill from property_details.listing_events for pre-trigger history.
Tax reassessment forecast FL · Resets to sale price
- Current annual tax
- $1,483 · $124/mo
- Projected year-2 tax
- $1,483 · $124/mo
- Expected delta
- $0/yr ($0/mo · 0.0%)
ⓘ Screening estimate from a state-policy table — verify with the county assessor before closing.
Climate risk First Street
- Flood 1/10 Low FEMA zone X (unshaded) · 0% chance over 30 yrs
- Wildfire 6/10 Major
- Heat 9/10 Extreme 7 d/yr ≥108°F today · 24 d/yr by 30 yrs out
- Wind 9/10 Extreme 99% chance of damaging wind over 30 yrs
- Air quality 2/10 Low 2 unhealthy d/yr today · 2 by 30 yrs out
Nearby sold comps map
Loading sold comps map…
Walkable amenities ~0.75 mi
Loading nearby amenities…
Taxation est. · year 1
- Rental income
- $16,900
- − Mortgage interest
- −$5,820
- − Property taxes
- −$1,483
- − Insurance
- −$520
- − Repairs & maintenance
- −$1,352
- − Management
- −$1,352
- − Depreciation
- −$3,023
- Taxable income
- $3,350
- Est. tax owed @ 24.0%
- −$804
- After-tax cash flow
- $4,006/yr
For passive investors: Depreciation is non-cash, so a rental often shows a tax loss while cash-flowing — sheltering income. Rental losses are passive: they offset passive income freely, and up to $25,000/yr can offset ordinary (W-2) income if you actively participate and your MAGI is under $100k (phasing out to $0 by $150k); unused losses carry forward. On sale, claimed depreciation is recaptured at up to 25%, and gains may owe capital-gains tax (a 1031 exchange can defer both). Figures are a year-1 estimate at your 24.0% rate — not tax advice; consult a CPA.
Schools (NCES district)
- District
- Polk
- NCES district ID
- 1201590
- Math proficiency
- 39% ▼ -11.00%
- Reading proficiency
- 43% ▼ -4.00%
- Median HH income
- $43,979
- Composite
- 34.74/100
- National rank
- #5132
- State rank
- #62 of 73 in FL
Livability — Fuller Heights
- Score
- 63/100
- State rank
- #720
- US rank
- #15426
Category grades
Schools grade is shown separately in the Schools card above.
Census & demographics
- Census place
- Fuller Heights, FL
- County
- Polk County · 740,051 people
- Metro
- Lakeland-Winter Haven, FL
- Population (ZIP)
- 24,892
- Household income
- $65,710
- Rent vs Own
- Severe rent burden
- 583.0
Population outlook (Polk County) Hauer SSP2
- Today (2025)
- 752,975 people
- By 2030
- 804,621 · +6.9%
- By 2040
- 906,117 · +20.3%
- By 2050
- 1,000,476 · +32.9%
- By 2075
- 1,197,520 · +59.0%
- By 2100
- 1,271,518 · +68.9%
Race, ethnicity, and origin ACS 2023
- Neighborhood character
- Diverse neighborhood (Simpson 0.60)
- Race & ethnicity
- White 53% Hispanic / Latino 33% Two or more races 12% Black 10% Asian 1% Native American 1%
- Hispanic origin (detail)
- Mexican 19% Puerto Rican 7% Cuban 2%
- Common ancestry
- Lithuanian 2% Romanian 1% Slovak 1%
- Foreign-born
- 15% · Canada
- Languages at home
- 70% English-only · Spanish 28% Other Indo-European 1%
Political lean MEDSL · Polk
- 2024 margin
- Strong R (+20.7) · D 39.2% · R 59.9%
- 2008→2024 swing
- -14.6pp toward R · 2008: -6.1pp · 2024: -20.7pp
- All cycles
- 2024: R+20.7 2020: R+14.4 2016: R+14.1 2012: R+6.8 2008: R+6.1
Not yet ingested
- Civics
- —
Market trends
- HPI YoY
- ▼ -101.08%
- Current HPI
- 349.7266
- Rent YoY
- ▲ 1.59%
- Metro
- Lakeland-Winter Haven, FL
- State GDP YoY
- ▲ 3.28%
- F500 in state
- 36
Industry mix (Fortune 500 HQ in FL)
| Industry | F500 HQs | Revenue |
|---|---|---|
| Industrial Technology | 2 | $29B |
|
||
| Insurance | 2 | $17B |
|
||
| Retail | 1 | $60B |
|
||
| Technology Distribution | 1 | $58B |
|
||
| Homebuilding | 1 | $35B |
|
||
| Technology Manufacturing | 1 | $35B |
|
||
Price history
-35.1% since first listed20 events — show timeline
- 2026-05-21 Pending — Stellar MLS as Distributed by MLS Grid
- 2026-05-14 Price Changed $103,900 Stellar MLS as Distributed by MLS Grid
- 2026-05-07 Price Changed $104,900 Stellar MLS as Distributed by MLS Grid
- 2026-04-27 Price Changed $106,900 Stellar MLS as Distributed by MLS Grid
- 2026-04-10 Price Changed $108,900 Stellar MLS as Distributed by MLS Grid
- 2026-04-01 Price Changed $109,900 Stellar MLS as Distributed by MLS Grid
- 2026-03-26 Price Changed $111,900 Stellar MLS as Distributed by MLS Grid
- 2026-03-19 Price Changed $112,900 Stellar MLS as Distributed by MLS Grid
- 2026-02-27 Price Changed $113,900 Stellar MLS as Distributed by MLS Grid
- 2026-02-13 Listed $114,900 Stellar MLS as Distributed by MLS Grid
- 2024-01-30 Rental Removed $1,100 STELLARMLS
- 2024-01-15 Listed for Rent $1,100 STELLARMLS
- 2017-02-10 Sold (Public Records) $265,300 Public Records
- 2010-06-11 Listing Removed — Stellar MLS as Distributed by MLS Grid
- 2010-01-06 Listed $47,500 Stellar MLS as Distributed by MLS Grid
- 2009-05-12 Listing Removed — Stellar MLS as Distributed by MLS Grid
- 2009-01-16 Listed $90,000 Stellar MLS as Distributed by MLS Grid
- 2008-03-18 Listing Removed — Stellar MLS as Distributed by MLS Grid
- 2008-03-17 Listed $125,000 Stellar MLS as Distributed by MLS Grid
- 2007-11-12 Listed $160,000 Stellar MLS as Distributed by MLS Grid
Property tax history
+17.4%/yrLatest (2025): $1,483 · +13.6% YoY. Source: county tax records.
Cash-flow waterfall
monthlySold comps — $/sqft
last 12 mo · ≤1 miLoading sold comps…