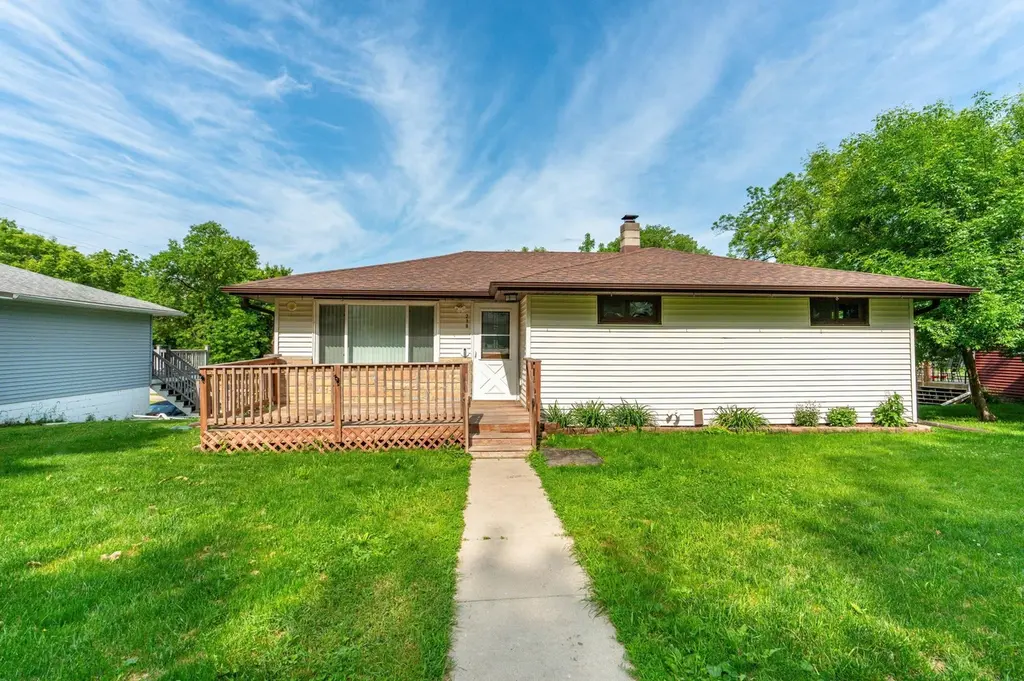
218 5th Ave SE · Elbow Lake, MN
Flood risk 4/10 · Minor
- FEMA flood zone
- —
- Chance of flooding over 30 yrs
- 0.13%
- Est. flood insurance / yr
- —
Fire risk 1/10 · Minimal
- Est. fire insurance / yr
- $888 – $1,650
Heat risk 1/10 · Minimal
- Hot days now (above 97°F)
- 7 days/yr
- Hot days in 30 yrs
- 13 days/yr
Wind risk 2/10 · Minimal
- Chance of severe wind over 30 yrs
- —
Air-quality risk 3/10 · Minor
- Unhealthy air days now
- 3 days/yr
- Unhealthy air days in 30 yrs
- 3 days/yr
Risk factors via First Street. Map © Google.
Why this score? — see what drove the D+ grade
The composite is a weighted blend of 9 inputs, each scored 0–100. Each bar is that input's sub-score; the figure is the points it added to the 100-point composite (weight × sub-score).
- Cash flow +11.4/30.0
- Appreciation +7.6/10.0
- ARV discount +7.5/15.0
- Schools +4.6/10.0
- Livability +3.8/5.0
- DSCR +3.3/10.0
- 1% rule +2.6/10.0
- Rent growth +2.5/5.0
- Condition / age +2.5/5.0
$159,900
🖨 Deal sheet 📄 Offer letter ✓ Due diligence
Listing remarks MLS
This 3 bedroom, 2 bath home has been given a whole new look on the main floor. Recently remodeled kitchen, dining, living room, and bath. New flooring throughout entire main floor. Lower level family room and double tuck under garage. Located on a manicured lot just 1 block from North Elementary. Move in ready and NO ASSESSEMTS!! Owner/agent
Key facts
- City parks
- Easy commute
- Local schools
Tags
Property features AI
Finance
- Financial info: VA mortgage type available
Exterior
- Parking: Attached tuck-under heated and insulated garage with automatic door opener; 2-car garage (16 x 24; garage door 14' wide x 7' high)
- Utilities: City water connected; City sewer connected; Propane fuel; 100 amp electrical service with circuit breakers
- Home design: Residential property; One-level living; Main living level finished; Walkout lower level
- Construction: Block and frame construction; Block foundation; Asphalt roof (over 8 years old); Foundation dimensions approximately 24 x 28
- Exterior features: Deck; Front porch; Vinyl siding; Storage shed; Tree coverage - light; Irregular lot
Interior
- Kitchen: Cooktop; Dishwasher; Microwave; Refrigerator; Stainless steel appliances
- Bedrooms: 4 bedrooms total; Main floor primary bedroom; Lower-level bedroom(s)
- Bathrooms: 1 full bathroom (main floor); 1 half bathroom
- Heating & cooling: Forced air heating; Central air conditioning; Gas water heater
- Interior features: Ceiling fan(s); Living/Dining room combination; Main floor primary bedroom; Kitchen window; Water filtration and water osmosis systems; Water softener (owned); Fuel tank - rented
- Laundry & utility: Laundry room; Washer hookup; Electric dryer hookup; Laundry sink
Neighborhood map
What this means for you Summary
Snapshot
- This is a 4-bed/2.0-bath single-family listed at $160k.
Deal economics
- At list price, monthly cash flow is $-55 ($-658/yr) — negative.
- To cash-flow at today's rent, offer at most $150k (6.1% below list).
- To meet the 1% rule (rent ≥ 1% of price), the offer needs to be $121k (24.1% below list).
- Recommended offer: $121k (24.1% below list) — sets the bar for 1% rule.
Location & tenants
- Location reads 75/100 on livability (#188 in MN, #4,060 nationally) — a middle-class / working-renter tenant base. Strengths: crime A+, cost of living A+, housing A+; Watch: amenities F, commute F.
- West Central Area (rural): math 47% / reading 61% proficiency, ranked #80 of 301 in MN (top 27%) — acceptable for families but not a draw, mixed tenant base, ~2y average lease.
- Market conditions: 22 active listings in the ZIP; 2 units permitted in Grant County in 2024 (0 in 5+ unit buildings).
Forward outlook
- In year one you build about $9k of equity ($1k loan paydown + $8k appreciation (5.1% local appreciation)).
- Grant County population projected at -20% by 2050 — secular population decline; favor cash flow + early exit over multi-decade hold.
- At projected returns (5.1% appreciation + 3.0% rent growth), your $45k cash investment doubles in ~5 years — after that, you're playing with house money.
- By year 4, paydown + projected appreciation supports a ~$31k cash-out refi (75% LTV) — recoverable capital for the next deal without selling this one.
Negotiation context
- Only 9 days on market — expect competitive offers; lowballing is unlikely to land.
- 6 sale attempts since 17y ago with the ask held roughly flat each time — persistent listings suggest the price (not the market) is what's stuck; bring a comps-based counter.
- Current owner paid $78k; list at $160k implies a 106% gain — meaningful room to come down on a strong offer.
Risks & watch-outs
- Watch-outs: built in 1956 — expect roof / HVAC / electrical / plumbing capex.
Questions for the listing agent
- What do current leases actually rent for vs. the listed asking? Can we see a recent rent roll and the last 12 months of T-12 income?
- Built in 1956 — when were the roof, HVAC, electrical panel, plumbing, and water heater last replaced?
- Is there a deadline driving the sale (1031 exchange, divorce, estate, relocation)? That informs how much negotiation room exists.
- Schools are B-rated — typically a magnet for longer-tenancy family renters. What's the average tenant stay here, and is there a school-zone premium baked into asking?
- The area grade is low — what's the realistic commute time and amenity access for the typical tenant pool here? Any planned neighborhood developments (good or bad) we should know about?
- What's the average days-on-market for RENTAL listings here right now (not sales)? A rising rental-DOM trend means longer vacancies and softer asking-rent achievability than the comps imply.
- What's the recent tenant-quality profile in this submarket — average credit score on applications, eviction rate, late-payment / NSF rate, and stable-employment percentage? A property-management company in the area should have these aggregated.
- How much new for-sale + rental construction is in the pipeline within 1–3 miles? Heavy new supply typically softens prices + rents 12–24 months out; constrained supply supports both.
Investment metrics
- 1% rule
- 0.76% ✗
- Cap rate
- 5.88%
- Cash-on-cash
- -1.47%
- DSCR
- 0.93
- GRM
- 11.0
CMA / ARV
No comps found within radius.
Projected returns pro-forma
5.12% appreciation · 3.0% rent growth · sell at horizon
- IRR
- 11.9%
- Equity multiple
- 1.77×
- Total profit
- $34,445
- Equity at exit
- $91,808
- IRR
- 13.0%
- Equity multiple
- 3.38×
- Total profit
- $106,589
- Equity at exit
- $159,444
Cash invested: $44,772 (down + closing). Projections, not guarantees.
Landlord ↔ Tenant lean methodology
- Overall (STATE)
- 46 Balanced
- State Minnesota
- 46 Balanced · D+2
- County
- — inherits STATE
- City
- — inherits STATE
ZIP-level market 56531
- Home prices YoY
- 2.1%
- Active inventory
- 22
- Price-to-rent
- 11.0×
Monthly cashflow live
- Estimated rent
- $1,213 medium interval (Pro) →
- Mortgage (P&I)
- −$839
- Tax from tax record
- −$108 /mo · $1,296/yr
- Insurance
- −$67
- HOA
- −$0
- Vacancy / Maint / Mgmt
- −$255
- Net cashflow
- $-55
Break-even live
UW: 25.0% down · 7.5% · 30yr · 1.5% tax · 5.0% vac · 8.0% maint · 8.0% mgmt
Financing live
Cash to close
- Down payment
- $39,975
- Closing costs
- $4,797
- Reserves months
- —
- Total cash needed
- —
Loan-product check · same deal, 3 products live
Conventional
25% down · 7.5% · 30yr
- Down + closing
- —
- Monthly P&I
- —
- Monthly cashflow
- —
- DSCR
- —
- Eligible?
- —
Personal DTI + credit; lowest rate.
DSCR
20% down · 8.5% · 30yr
- Down + closing
- —
- Monthly P&I
- —
- Monthly cashflow
- —
- DSCR
- —
- Eligible?
- —
No personal income docs; deal must DSCR.
Hard money
10% down · 12.0% · 12mo
- Down + closing
- —
- Monthly P&I
- —
- Monthly cashflow
- —
- DSCR
- —
- Eligible?
- —
Short-term bridge; refi at stabilization.
Listing history 8 events
-
2026-06-19days on market $159,900 Active 9 DOM
-
2026-06-18days on market $159,900 Active 8 DOM
-
2026-06-17days on market $159,900 Active 7 DOM
-
2026-06-16days on market $159,900 Active 6 DOM
-
2026-06-15days on market $159,900 Active 5 DOM
-
2026-06-14days on market $159,900 Active 3 DOM
-
2026-06-12remarks 699-char remark
-
2026-06-12$159,900 Active 2 DOM
ⓘ Source: listings_history table (triggers on properties + properties_extension) + one-shot
backfill from property_details.listing_events for pre-trigger history.
Tax reassessment forecast MN · Partial reset (capped growth)
- Current annual tax
- $1,296 · $108/mo
- Projected year-2 tax
- $1,543 · $129/mo
- Expected delta
- +$247/yr (+$21/mo · 19.1%)
ⓘ Screening estimate from a state-policy table — verify with the county assessor before closing.
Climate risk First Street
- Flood 4/10 Moderate 13% chance over 30 yrs
- Wildfire 1/10 Low
- Heat 1/10 Low 7 d/yr ≥97°F today · 13 d/yr by 30 yrs out
- Wind 2/10 Low
- Air quality 3/10 Moderate 3 unhealthy d/yr today · 3 by 30 yrs out
Nearby sold comps map
Loading sold comps map…
Walkable amenities ~0.75 mi
Loading nearby amenities…
Taxation est. · year 1
- Rental income
- $14,556
- − Mortgage interest
- −$8,957
- − Property taxes
- −$1,296
- − Insurance
- −$800
- − Repairs & maintenance
- −$1,165
- − Management
- −$1,165
- − Depreciation
- −$4,652
- Taxable loss
- −$3,477
- Est. tax savings @ 24.0%
- +$834
- After-tax cash flow
- $176/yr
For passive investors: Depreciation is non-cash, so a rental often shows a tax loss while cash-flowing — sheltering income. Rental losses are passive: they offset passive income freely, and up to $25,000/yr can offset ordinary (W-2) income if you actively participate and your MAGI is under $100k (phasing out to $0 by $150k); unused losses carry forward. On sale, claimed depreciation is recaptured at up to 25%, and gains may owe capital-gains tax (a 1031 exchange can defer both). Figures are a year-1 estimate at your 24.0% rate — not tax advice; consult a CPA.
Schools (NCES district)
- District
- West Central Area
- NCES district ID
- 2700104
- Math proficiency
- 47% ▼ -16.00%
- Reading proficiency
- 61% ▼ -8.00%
- Median HH income
- $48,888
- Composite
- 45.94/100
- National rank
- #2541
- State rank
- #80 of 301 in MN
Livability — Elbow Lake
- Score
- 75/100
- State rank
- #188
- US rank
- #4060
Category grades
Schools grade is shown separately in the Schools card above.
Census & demographics
- Census place
- Elbow Lake, MN
- City population
- 1,948
- Population (ZIP)
- 1,948
Population outlook (Grant County) Hauer SSP2
- Today (2025)
- 5,527 people
- By 2030
- 5,287 · -4.3%
- By 2040
- 4,829 · -12.6%
- By 2050
- 4,415 · -20.1%
- By 2075
- 3,504 · -36.6%
- By 2100
- 2,555 · -53.8%
Race, ethnicity, and origin ACS 2023
- Neighborhood character
- Predominantly White (94%)
- Race & ethnicity
- White 94% Two or more races 4% Hispanic / Latino 1%
- Common ancestry
- Portuguese 36% Scottish 3% Romanian 3%
- Foreign-born
- 0%
- Languages at home
- 99% English-only · Spanish 1%
Political lean MEDSL · Grant
- 2024 margin
- Solid R (+30.6) · D 33.6% · R 64.2% · Other 2.2%
- 2008→2024 swing
- -36.2pp toward R · 2008: 5.7pp · 2024: -30.6pp
- All cycles
- 2024: R+30.6 2020: R+26.5 2016: R+27.8 2012: R+2.9 2008: D+5.7
Not yet ingested
- Civics
- —
Market trends
- HPI YoY
- ▲ 5.12%
- Current HPI
- 253.9553
- Rent YoY
- —
- Metro
- —
- State GDP YoY
- ▲ 2.41%
- F500 in state
- 34
Industry mix (Fortune 500 HQ in MN)
| Industry | F500 HQs | Revenue |
|---|---|---|
| Healthcare | 2 | $407B |
|
||
| Retail | 2 | $150B |
|
||
| Consumer Goods | 2 | $32B |
|
||
| Industrial Machinery | 2 | $6B |
|
||
| Agriculture | 1 | $40B |
|
||
| Healthcare / Medical Devices | 1 | $32B |
|
||
Price history
+220.4% since first listed10 events — show timeline
- 2026-06-10 Listed $159,900 NORTHSTARMLS as Distributed by MLS Grid
- 2020-01-15 Sold (Public Records) $77,500 Public Records
- 2018-02-16 Sold (Public Records) $77,500 Public Records
- 2018-02-16 Sold (MLS) $77,500 NORTHSTARMLS as Distributed by MLS Grid
- 2017-11-24 Listed $79,900 NORTHSTARMLS as Distributed by MLS Grid
- 2010-03-01 Listing Removed — NORTHSTARMLS as Distributed by MLS Grid
- 2009-08-19 Listed $49,900 NORTHSTARMLS as Distributed by MLS Grid
- 2009-08-19 Listed $49,900 NORTHSTARMLS as Distributed by MLS Grid
- 2009-08-19 Listed $49,900 NORTHSTARMLS as Distributed by MLS Grid
- 2009-08-19 Listed $49,900 NORTHSTARMLS as Distributed by MLS Grid
Property tax history
-1.4%/yrLatest (2018): $1,296 · -4.4% YoY. Source: county tax records.
Cash-flow waterfall
monthlySold comps — $/sqft
last 12 mo · ≤1 miLoading sold comps…