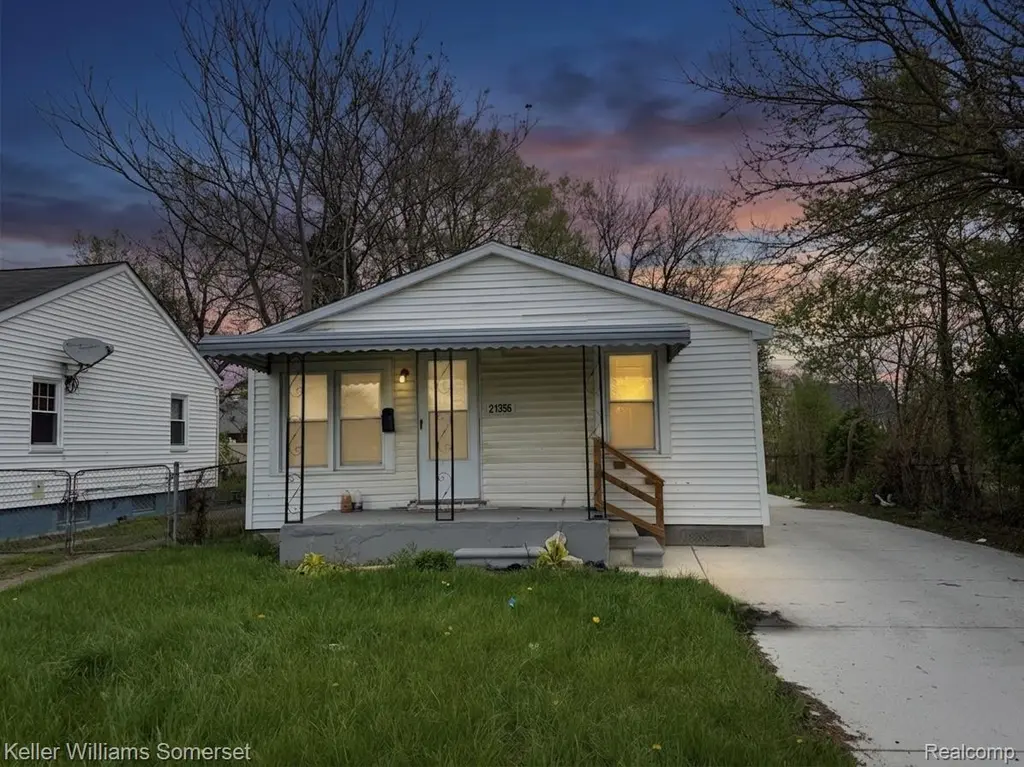
21356 Westview Ave · Royal Oak, MI
Flood risk 1/10 · Minimal
- FEMA flood zone
- X (unshaded)
- Chance of flooding over 30 yrs
- 0.0%
- Est. flood insurance / yr
- $473 – $860
Fire risk 1/10 · Minimal
- Est. fire insurance / yr
- $784 – $1,456
Heat risk 3/10 · Minor
- Hot days now (above 97°F)
- 7 days/yr
- Hot days in 30 yrs
- 15 days/yr
Wind risk 2/10 · Minimal
- Chance of severe wind over 30 yrs
- —
Air-quality risk 4/10 · Minor
- Unhealthy air days now
- 3 days/yr
- Unhealthy air days in 30 yrs
- 6 days/yr
Risk factors via First Street. Map © Google.
Why this score? — see what drove the B- grade
The composite is a weighted blend of 9 inputs, each scored 0–100. Each bar is that input's sub-score; the figure is the points it added to the 100-point composite (weight × sub-score).
- Cash flow +25.5/30.0
- ARV discount +14.2/15.0
- DSCR +8.5/10.0
- 1% rule +5.9/10.0
- Livability +4.2/5.0
- Rent growth +4.1/5.0
- Schools +2.5/10.0
- Condition / age +2.5/5.0
- Appreciation +0.0/10.0
$145,000
🖨 Deal sheet 📄 Offer letter ✓ Due diligence
Listing remarks MLS
Located just a few blocks from the vibrant downtown Ferndale, this 2 bedroom, 1 bathroom home was thoughtfully renovated from top to bottom in 2024, offering modern finishes, fresh updates, and a clean, contemporary feel throughout. Whether you're a first-time buyer or an investor looking for a turnkey property, this one checks the boxes. Enjoy the convenience and curb appeal of a newly poured concrete driveway - completed in 2024 - adding both function and long-term value. The home is now vacant and available for showings. The price increase is due to the home being sold at auction. The seller can still redeem the property to sell. All offers are subject to bank approval.
Key facts
- 5,227 sq ft lot
- Built 1945
- Listed 125 days
Tags
Neighborhood map
What this means for you Summary
Snapshot
- This is a 3-bed/1.0-bath single-family listed at $145k.
Deal economics
- At list price, monthly cash flow is $338 ($4k/yr) — positive.
- The deal already cash-flows at list — no discount required.
- Meets the 1% rule at list price ($2k rent vs $145k).
- Recommended offer: $128k (12.0% below list) — sets the bar for market timing.
- Cap rate 9.1% vs local median 3.8% in Royal Oak — top-decile yield for the area; either an underpriced asset or a hidden risk that comps aren't pricing in. Stress-test before assuming the spread holds.
Location & tenants
- Location reads 83/100 on livability (#50 in MI, #1,020 nationally) — a professional / high-income tenant draw. Strengths: crime A+, commute A+, employment A+; Watch: amenities D+.
- Ferndale Public Schools (suburban): math 18% / reading 39% proficiency, ranked #366 of 540 in MI (top 68%) — low school quality limits family demand, transient renter base, plan for 1-2y turnover.
- Market conditions: Rents rising fast (+6.2%/yr); 171 active listings in the ZIP; 40 comparable units currently listed for rent nearby; rentals at typical pace (median 24d on market — plan ~3-4 weeks tenant-placement turnaround); solid renter incomes; 2,614 units permitted in Oakland County in 2024 (721 in 5+ unit buildings).
Forward outlook
- Local home prices are declining (-3.0%/yr); year-one equity from $1k of loan paydown is wiped out by about $4k of value loss. Plan a longer hold.
- Oakland County population projected at +10% by 2050 — modest demand growth; plan on rents tracking national, not racing it.
- At projected returns (-3.0% appreciation + 6.2% rent growth), your $41k cash investment doubles in ~9 years — after that, you're playing with house money.
Negotiation context
- It's been on market 125 days — a 12% lower offer ($128k) is reasonable based on typical stale-listing flexibility.
- 19 sale attempts since 18y ago; this cycle's ask is 20% above the opening price — seller raised mid-cycle; expect resistance to lowballs.
- Current owner paid $105k; 38% above their basis — modest negotiation headroom, anchor on the comps not their cost.
Risks & watch-outs
- Watch-outs: built in 1945 — expect roof / HVAC / electrical / plumbing capex.
Questions for the listing agent
- It's been on market 125 days. Have you received any prior offers? Is the seller open to a 12% concession, seller financing, or rate buy-down credit?
- Built in 1945 — when were the roof, HVAC, electrical panel, plumbing, and water heater last replaced?
- Why hasn't it sold? Are there any deal-killer items the seller is aware of (foundation, flood, title, zoning, code violations)?
- Is there a deadline driving the sale (1031 exchange, divorce, estate, relocation)? That informs how much negotiation room exists.
- Schools are B-rated — typically a magnet for longer-tenancy family renters. What's the average tenant stay here, and is there a school-zone premium baked into asking?
- What's the average days-on-market for RENTAL listings here right now (not sales)? A rising rental-DOM trend means longer vacancies and softer asking-rent achievability than the comps imply.
- What's the recent tenant-quality profile in this submarket — average credit score on applications, eviction rate, late-payment / NSF rate, and stable-employment percentage? A property-management company in the area should have these aggregated.
- How much new for-sale + rental construction is in the pipeline within 1–3 miles? Heavy new supply typically softens prices + rents 12–24 months out; constrained supply supports both.
Investment metrics
- 1% rule
- 1.09% ✓
- Cap rate
- 9.09%
- Cash-on-cash
- 10.00%
- DSCR
- 1.45
- GRM
- 7.6
CMA / ARV
- ARV (median comp)
- $170,345
- List price
- $145,000
- Delta
- -14.88%
- Verdict
- UNDERPRICED
- Comps
- 20 within 1.0 mi
Show comp detail 12 sales within ~0.75 mi
| Address | Dist | Beds/Ba | Sqft | Sold | Price | $/sf | Match |
|---|---|---|---|---|---|---|---|
| 1169 W Marshall St | 0.42mi | 3/1.0 | 909 (+1%) | 1mo | $216,000 | $238 | 78 |
| 931 Emwill St | 0.65mi | 2/1.0 (-1) | 900 (-0%) | 1mo | $285,000 | $317 | 63 |
| 1636 W Troy St | 0.53mi | 3/1.0 | 829 (-8%) | 0mo | $250,000 | $302 | 61 |
| 8796 Saratoga St | 0.53mi | 3/1.0 | 985 (+9%) | 0mo | $233,000 | $237 | 60 |
| 8570 Troy St | 0.55mi | 3/1.5 | 969 (+7%) | 1mo | $260,000 | $268 | 59 |
| 10101 Albany St | 0.51mi | 2/1.0 (-1) | 827 (-8%) | 2mo | $150,000 | $181 | 56 |
| 1368 Northway St | 0.55mi | 3/1.0 | 1,017 (+13%) | 0mo | $264,900 | $260 | 53 |
| 20233 Roselawn St | 0.62mi | 2/1.0 (-1) | 829 (-8%) | 2mo | $33,000 | $40 | 50 |
| 10111 Troy St | 0.65mi | 2/1.0 (-1) | 829 (-8%) | 2mo | $149,999 | $181 | 50 |
| 10280 Troy St | 0.74mi | 3/1.0 | 988 (+9%) | 1mo | $180,000 | $182 | 49 |
| 1356 Albany St | 0.52mi | 4/1.0 (+1) | 1,032 (+14%) | 1mo | $205,000 | $199 | 46 |
| 10311 Saratoga St | 0.68mi | 2/1.0 (-1) | 1,029 (+14%) | 0mo | $139,000 | $135 | 40 |
Match score weights: distance 35% · size 25% · config 20% · recency 20%. Top-matched comps best support the ARV.
Projected returns pro-forma
-3.0% appreciation · 6.24% rent growth · sell at horizon
- IRR
- 2.1%
- Equity multiple
- 1.08×
- Total profit
- $3,362
- Equity at exit
- $21,620
- IRR
- 14.5%
- Equity multiple
- 2.33×
- Total profit
- $53,961
- Equity at exit
- $12,537
Cash invested: $40,600 (down + closing). Projections, not guarantees.
Landlord ↔ Tenant lean methodology
- Overall (STATE)
- 62 Landlord-Friendly
- State Michigan
- 62 Landlord-Friendly · EVEN
- County
- — inherits STATE
- City
- — inherits STATE
ZIP-level market 48220
- Rents YoY
- 6.2%
- Active inventory
- 171
- Price-to-rent
- 7.6×
Monthly cashflow live
- Estimated rent
- $1,585 high interval (Pro) →
- Mortgage (P&I)
- −$760
- Tax from tax record
- −$93 /mo · $1,118/yr
- Insurance
- −$60
- HOA
- −$0
- Vacancy / Maint / Mgmt
- −$333
- Net cashflow
- $338
Break-even live
UW: 25.0% down · 7.5% · 30yr · 1.5% tax · 5.0% vac · 8.0% maint · 8.0% mgmt
Financing live
Cash to close
- Down payment
- $36,250
- Closing costs
- $4,350
- Reserves months
- —
- Total cash needed
- —
Loan-product check · same deal, 3 products live
Conventional
25% down · 7.5% · 30yr
- Down + closing
- —
- Monthly P&I
- —
- Monthly cashflow
- —
- DSCR
- —
- Eligible?
- —
Personal DTI + credit; lowest rate.
DSCR
20% down · 8.5% · 30yr
- Down + closing
- —
- Monthly P&I
- —
- Monthly cashflow
- —
- DSCR
- —
- Eligible?
- —
No personal income docs; deal must DSCR.
Hard money
10% down · 12.0% · 12mo
- Down + closing
- —
- Monthly P&I
- —
- Monthly cashflow
- —
- DSCR
- —
- Eligible?
- —
Short-term bridge; refi at stabilization.
Rent comps 40 comps
| Address | Beds | Baths | Sqft | Rent | $/sqft | DOM | Units | Dist |
|---|---|---|---|---|---|---|---|---|
| 21374 Ithaca Ave Ferndale, MI | 3.0 | 1.0 | 996 | $1,775 | $1.78 | 24d | 1 | 0.29mi |
| 22811 Rosewood St Oak Park, MI | 3.0 | 1.0 | 1000 | $1,600 | $1.60 | 24d | 1 | 0.53mi |
| 20458 Indiana St Detroit, MI | 3.0 | 1.0 | 1049 | $1,300 | $1.24 | 17d | 1 | 0.55mi |
| 1491 W Nine Mile Rd Unit 9 Ferndale, MI | 2.0 | 1.0 | 900 | $1,350 | $1.50 | 43d | 1 | 0.56mi |
| 20445 Kentucky St Detroit, MI | 3.0 | 1.0 | 1046 | $1,200 | $1.15 | 24d | 1 | 0.59mi |
| 10020 Corning St Oak Park, MI | 2.0 | 1.0 | 829 | $1,400 | $1.69 | 24d | 1 | 0.59mi |
| 20515 Ilene St Detroit, MI | 3.0 | 1.0 | 891 | $1,450 | $1.63 | 43d | 1 | 0.61mi |
| 578 Kensington Ave Ferndale, MI | 2.0 | 1.0 | 860 | $1,600 | $1.86 | 4d | 1 | 0.63mi |
| 10000 W Nine Mile Rd Unit 3 Oak Park, MI | 2.0 | 1.0 | 900 | $1,000 | $1.11 | 43d | 1 | 0.64mi |
| 10050 W Nine Mile Rd Unit 18 Oak Park, MI | 2.0 | 1.0 | 900 | $1,000 | $1.11 | 4d | 1 | 0.65mi |
| 1260 W Nine Mile Rd Unit 13 Ferndale, MI | 2.0 | 1.0 | 1000 | $1,399 | $1.40 | 14d | 1 | 0.66mi |
| 20460 Griggs St Detroit, MI | 2.0 | 1.0 | 910 | $1,100 | $1.21 | 17d | 1 | 0.66mi |
| 20185 Indiana St Detroit, MI | 2.0 | 1.5 | 1096 | $1,275 | $1.16 | 43d | 1 | 0.69mi |
| 10400 Saratoga St Oak Park, MI | 2.0 | 1.0 | 829 | $1,450 | $1.75 | 4d | 1 | 0.69mi |
| 510 Stratford Rd Ferndale, MI | 2.0 | 1.0 | 965 | $1,750 | $1.81 | 43d | 1 | 0.70mi |
| 695 Livernois St Unit 2 Ferndale, MI | 2.0 | 1.0 | 950 | $2,350 | $2.47 | 4d | 1 | 0.72mi |
| 20110 Northlawn St Detroit, MI | 3.0 | 1.0 | 1100 | $1,350 | $1.23 | 17d | 1 | 0.75mi |
| 20045 Greenlawn St Detroit, MI | 3.0 | 1.0 | 925 | $1,350 | $1.46 | 43d | 1 | 0.81mi |
| 20009 Wisconsin St Detroit, MI | 3.0 | 1.5 | 1051 | $1,400 | $1.33 | 17d | 1 | 0.82mi |
| 20429 Monte Vista St Detroit, MI | 3.0 | 1.0 | 872 | $1,300 | $1.49 | 17d | 1 | 0.85mi |
| 851 Gardendale St Ferndale, MI | 2.0 | 1.0 | 933 | $1,625 | $1.74 | 24d | 1 | 0.88mi |
| 20245 Manor Detroit, MI | 3.0 | 1.0 | 1018 | $1,400 | $1.38 | 2d | 1 | 0.93mi |
| 23511 Majestic St Oak Park, MI | 3.0 | 1.0 | 1100 | $1,750 | $1.59 | 24d | 1 | 0.98mi |
| 20122 Manor St Detroit, MI | 3.0 | 1.0 | 1028 | $1,200 | $1.17 | 43d | 1 | 0.99mi |
| 20032 Monte Vista St Detroit, MI | 3.0 | 1.0 | 1000 | $1,294 | $1.29 | 20d | 1 | 1.00mi |
| 20038 Santa Rosa Dr Detroit, MI | 3.0 | 1.0 | 927 | $1,300 | $1.40 | 17d | 1 | 1.03mi |
| 12800 W 9 Mile Rd Oak Park, MI | 1.0–2.0 | 1.0 | 775 | $1,250 | $1.61 | 24d | 1 | 1.04mi |
| 430 W 9 Mile Rd Ferndale, MI | 1.0–2.0 | 1.0–2.0 | 754 | $2,827 | $3.75 | 1d | 3 | 1.07mi |
| 19929 Monte Vista St Detroit, MI | 3.0 | 1.0 | 860 | $1,450 | $1.69 | 17d | 1 | 1.09mi |
| 20643 Stratford Rd Unit 1 Detroit, MI | 2.0 | 1.5 | 1000 | $1,250 | $1.25 | 43d | 1 | 1.12mi |
| 901 Saint Louis St Unit 901-02 Ferndale, MI | 2.0 | 1.0 | 800 | $1,395 | $1.74 | 24d | 1 | 1.17mi |
| 901 Saint Louis St Ferndale, MI | 2.0 | 1.0 | 800 | $1,395 | $1.74 | 43d | 1 | 1.17mi |
| 22148 Dante St #212 Oak Park, MI | 2.0 | 2.0 | 916 | $1,475 | $1.61 | 21d | 1 | 1.20mi |
| 22148 Dante St #211 Oak Park, MI | 2.0 | 1.0 | 916 | $1,475 | $1.61 | 24d | 1 | 1.20mi |
| 22148 Dante St #211 Oak Park, MI | 2.0 | 2.0 | 916 | $1,475 | $1.61 | 17d | 1 | 1.20mi |
| 22108 Dante St #115 Oak Park, MI | 2.0 | 2.0 | 898 | $1,250 | $1.39 | 24d | 1 | 1.21mi |
| 22108 Dante St Oak Park, MI | 2.0 | 1.0 | 898 | $1,250 | $1.39 | 24d | 1 | 1.24mi |
| 20129 Stratford Rd Unit 2 Detroit, MI | 2.0 | 1.0 | 1100 | $1,223 | $1.11 | 24d | 1 | 1.25mi |
| 21880 Coolidge Hwy #203 Oak Park, MI | 2.0 | 1.0 | 938 | $1,300 | $1.39 | 24d | 1 | 1.26mi |
| 21850 Coolidge Hwy #203 Oak Park, MI | 3.0 | 2.0 | 1100 | $1,700 | $1.55 | 4d | 1 | 1.26mi |
Listing history 50 events
-
2026-06-18days on market $145,000 Active 125 DOM
-
2026-06-17days on market $145,000 Active 124 DOM
-
2026-06-16days on market $145,000 Active 123 DOM
-
2026-06-15days on market $145,000 Active 122 DOM
-
2026-06-13days on market $145,000 Active 120 DOM
-
2026-06-13days on market $145,000 Active 119 DOM
-
2026-06-09days on market $145,000 Active 116 DOM
-
2026-06-08days on market $145,000 Active 115 DOM
-
2026-06-07days on market $145,000 Active 114 DOM
-
2026-06-04days on market $145,000 Active 111 DOM
-
2026-06-03days on market $145,000 Active 110 DOM
-
2026-06-02days on market $145,000 Active 109 DOM
-
2026-06-01days on market $145,000 Active 108 DOM
-
2026-05-31days on market $145,000 Active 107 DOM
-
2026-04-29price $145,000 685-char remark
Show marketing remark (685 chars)
Located just a few blocks from the vibrant downtown Ferndale, this 2 bedroom, 1 bathroom home was thoughtfully renovated from top to bottom in 2024, offering modern finishes, fresh updates, and a clean, contemporary feel throughout. Whether you're a first-time buyer or an investor looking for a turnkey property, this one checks the boxes. Enjoy the convenience and curb appeal of a newly poured concrete driveway - completed in 2024 - adding both function and long-term value. The home is now vacant and available for showings. The price increase is due to the home being sold at auction. The seller can still redeem the property to sell. All offers are subject to bank approval.
-
2026-04-28price $145,000 693-char remark
Show marketing remark (693 chars)
Located just a few blocks from the vibrant downtown Ferndale, this 2 bedroom, 1 bathroom home was thoughtfully renovated from top to bottom in 2024, offering modern finishes, fresh updates, and a clean, contemporary feel throughout. Whether you're a first-time buyer or an investor looking for a turnkey property, this one checks the boxes. Enjoy the convenience and curb appeal of a newly poured concrete driveway — completed in 2024 — adding both function and long-term value. The home is now vacant and available for showings. The price increase is due to the home being sold at auction. The seller can still redeem the property to sell. All offers are subject to bank approval.
-
2026-02-13$120,900 Active 685-char remark
Show marketing remark (693 chars)
Located just a few blocks from the vibrant downtown Ferndale, this 2 bedroom, 1 bathroom home was thoughtfully renovated from top to bottom in 2024, offering modern finishes, fresh updates, and a clean, contemporary feel throughout. Whether you're a first-time buyer or an investor looking for a turnkey property, this one checks the boxes. Enjoy the convenience and curb appeal of a newly poured concrete driveway — completed in 2024 — adding both function and long-term value. The home is now vacant and available for showings. The price increase is due to the home being sold at auction. The seller can still redeem the property to sell. All offers are subject to bank approval.
-
2026-02-13$120,900 Active 693-char remark
Show marketing remark (693 chars)
Located just a few blocks from the vibrant downtown Ferndale, this 2 bedroom, 1 bathroom home was thoughtfully renovated from top to bottom in 2024, offering modern finishes, fresh updates, and a clean, contemporary feel throughout. Whether you're a first-time buyer or an investor looking for a turnkey property, this one checks the boxes. Enjoy the convenience and curb appeal of a newly poured concrete driveway — completed in 2024 — adding both function and long-term value. The home is now vacant and available for showings. The price increase is due to the home being sold at auction. The seller can still redeem the property to sell. All offers are subject to bank approval.
-
2025-08-09historical $1,150
-
2025-07-24price $1,150
-
2025-07-17price $1,200
-
2025-06-18price $1,300
-
2025-05-24price $1,350
-
2025-05-13historical
-
2025-05-13historical
-
2025-05-10$1,450
-
2025-05-01price $130,000
-
2025-05-01price $130,000
-
2025-04-23price $135,000
-
2025-04-23price $135,000
-
2025-04-16price $140,000
-
2025-04-16price $140,000
-
2025-04-09price $145,000
-
2025-04-09price $145,000
-
2025-03-31price $147,500
-
2025-03-31price $147,500
-
2025-03-24price $152,500
-
2025-03-24price $152,500
-
2025-02-25price $155,000
-
2025-02-24price $155,000
-
2025-01-10$160,000 Active
-
2025-01-10$160,000 Active
-
2024-08-16historical
-
2024-08-16historical
-
2024-07-30$159,500 Active
-
2024-07-30$159,500 Active
-
2024-06-12historical
-
2024-06-12historical
-
2024-05-06soldstatus $105,000
-
2024-05-03$160,000 Active
ⓘ Source: listings_history table (triggers on properties + properties_extension) + one-shot
backfill from property_details.listing_events for pre-trigger history.
Tax reassessment forecast MI · Partial reset (capped growth)
- Current annual tax
- $1,118 · $93/mo
- Projected year-2 tax
- $1,675 · $140/mo
- Expected delta
- +$558/yr (+$46/mo · 49.9%)
ⓘ Screening estimate from a state-policy table — verify with the county assessor before closing.
Climate risk First Street
- Flood 1/10 Low FEMA zone X (unshaded) · 0% chance over 30 yrs
- Wildfire 1/10 Low
- Heat 3/10 Moderate 7 d/yr ≥97°F today · 15 d/yr by 30 yrs out
- Wind 2/10 Low
- Air quality 4/10 Moderate 3 unhealthy d/yr today · 6 by 30 yrs out
Nearby sold comps map
Loading sold comps map…
Walkable amenities ~0.75 mi
Loading nearby amenities…
Taxation est. · year 1
- Rental income
- $19,023
- − Mortgage interest
- −$8,122
- − Property taxes
- −$1,118
- − Insurance
- −$725
- − Repairs & maintenance
- −$1,522
- − Management
- −$1,522
- − Depreciation
- −$4,218
- Taxable income
- $1,796
- Est. tax owed @ 24.0%
- −$431
- After-tax cash flow
- $3,630/yr
For passive investors: Depreciation is non-cash, so a rental often shows a tax loss while cash-flowing — sheltering income. Rental losses are passive: they offset passive income freely, and up to $25,000/yr can offset ordinary (W-2) income if you actively participate and your MAGI is under $100k (phasing out to $0 by $150k); unused losses carry forward. On sale, claimed depreciation is recaptured at up to 25%, and gains may owe capital-gains tax (a 1031 exchange can defer both). Figures are a year-1 estimate at your 24.0% rate — not tax advice; consult a CPA.
Schools (NCES district)
- District
- Ferndale Public Schools
- NCES district ID
- 2614280
- Math proficiency
- 18% ▼ -3.00%
- Reading proficiency
- 39% ▲ 5.00%
- Median HH income
- $56,069
- Composite
- 25.46/100
- National rank
- #7449
- State rank
- #366 of 540 in MI
Livability — Royal Oak
- Score
- 83/100
- State rank
- #50
- US rank
- #1020
Category grades
Schools grade is shown separately in the Schools card above.
Census & demographics
- County
- Oakland County · 1,009,092 people
- City population
- 57,974
- Metro
- Detroit-Warren-Dearborn, MI
- Population (ZIP)
- 21,527
- Household income
- $89,881
- Rent vs Own
- Severe rent burden
- 670.0
Population outlook (Oakland County) Hauer SSP2
- Today (2025)
- 1,335,747 people
- By 2030
- 1,375,100 · +2.9%
- By 2040
- 1,435,385 · +7.5%
- By 2050
- 1,469,250 · +10.0%
- By 2075
- 1,531,946 · +14.7%
- By 2100
- 1,450,485 · +8.6%
Race, ethnicity, and origin ACS 2023
- Neighborhood character
- Predominantly White (72%)
- Race & ethnicity
- White 72% Black 15% Two or more races 6% Hispanic / Latino 5% Asian 3%
- Common ancestry
- Romanian 11% Lithuanian 6% Slovak 3%
- Foreign-born
- 4% · Canada, South Korea
- Languages at home
- 95% English-only · Spanish 2% Other Indo-European 1% German/W. Germanic 1%
Political lean MEDSL · Oakland
- 2024 margin
- D (+10.6) · D 54.4% · R 43.8% · Other 1.9%
- 2008→2024 swing
- -3.9pp toward R · 2008: 14.5pp · 2024: 10.6pp
- All cycles
- 2024: D+10.6 2020: D+14.1 2016: D+8.1 2012: D+8.1 2008: D+14.5
Not yet ingested
- Civics
- —
Market trends
- HPI YoY
- ▼ -394.92%
- Current HPI
- 273.0986
- Rent YoY
- ▲ 6.24%
- Metro
- Detroit-Warren-Dearborn, MI
- State GDP YoY
- ▲ 1.37%
- F500 in state
- 28
Industry mix (Fortune 500 HQ in MI)
| Industry | F500 HQs | Revenue |
|---|---|---|
| Automotive Parts | 3 | $48B |
|
||
| Automotive | 2 | $372B |
|
||
| Chemicals | 1 | $45B |
|
||
| Automotive Retail | 1 | $29B |
|
||
| Healthcare / Medical Devices | 1 | $23B |
|
||
| Automotive Technology | 1 | $20B |
|
||
Price history
+1712.5% since first listed64 events — show timeline
- 2026-04-29 Price Changed $145,000 MiRealSource-MiMLS
- 2026-04-28 Price Changed $145,000 REALCOMP
- 2026-02-13 Listed $120,900 REALCOMP
- 2026-02-13 Listed $120,900 MiRealSource-MiMLS
- 2025-08-09 Rental Removed $1,150 PROPERTYWARE
- 2025-07-24 Price Changed $1,150 PROPERTYWARE
- 2025-07-17 Price Changed $1,200 PROPERTYWARE
- 2025-06-18 Price Changed $1,300 PROPERTYWARE
- 2025-05-24 Price Changed $1,350 PROPERTYWARE
- 2025-05-13 Listing Removed — REALCOMP
- 2025-05-13 Listing Removed — MiRealSource-MiMLS
- 2025-05-10 Listed for Rent $1,450 PROPERTYWARE
- 2025-05-01 Price Changed $130,000 MiRealSource-MiMLS
- 2025-05-01 Price Changed $130,000 REALCOMP
- 2025-04-23 Price Changed $135,000 MiRealSource-MiMLS
- 2025-04-23 Price Changed $135,000 REALCOMP
- 2025-04-16 Price Changed $140,000 MiRealSource-MiMLS
- 2025-04-16 Price Changed $140,000 REALCOMP
- 2025-04-09 Price Changed $145,000 MiRealSource-MiMLS
- 2025-04-09 Price Changed $145,000 REALCOMP
- 2025-03-31 Price Changed $147,500 MiRealSource-MiMLS
- 2025-03-31 Price Changed $147,500 REALCOMP
- 2025-03-24 Price Changed $152,500 MiRealSource-MiMLS
- 2025-03-24 Price Changed $152,500 REALCOMP
- 2025-02-25 Price Changed $155,000 MiRealSource-MiMLS
- 2025-02-24 Price Changed $155,000 REALCOMP
- 2025-01-10 Listed $160,000 REALCOMP
- 2025-01-10 Listed $160,000 MiRealSource-MiMLS
- 2024-08-16 Listing Removed — MiRealSource-MiMLS
- 2024-08-16 Listing Removed — REALCOMP
- 2024-07-30 Listed $159,500 MiRealSource-MiMLS
- 2024-07-30 Listed $159,500 REALCOMP
- 2024-06-12 Listing Removed — MiRealSource-MiMLS
- 2024-06-12 Listing Removed — REALCOMP
- 2024-05-06 Sold (Public Records) $105,000 Public Records
- 2024-05-03 Listed $160,000 MiRealSource-MiMLS
- 2024-05-03 Listed $160,000 REALCOMP
- 2024-03-11 Sold (MLS) $105,000 MiRealSource-MiMLS
- 2024-03-11 Sold (MLS) $105,000 SW Michigan MLS
- 2024-03-11 Sold (MLS) $105,000 REALCOMP
- 2024-01-22 Pending — REALCOMP
- 2024-01-22 Pending — SW Michigan MLS
- 2024-01-01 Listing Removed — MiRealSource-MiMLS
- 2024-01-01 Listing Removed — REALCOMP
- 2023-12-26 Listed $105,000 MiRealSource-MiMLS
- 2023-12-26 Listed $105,000 SW Michigan MLS
- 2023-12-26 Listed $105,000 REALCOMP
- 2023-12-04 Listed $105,000 MiRealSource-MiMLS
- 2023-12-04 Listed $105,000 REALCOMP
- 2023-12-02 Coming Soon — MiRealSource-MiMLS
- 2023-12-02 Coming Soon — REALCOMP
- 2022-05-12 Price Changed $925 RENT.
- 2020-11-17 Sold (Public Records) $80,000 Public Records
- 2009-02-02 Listing Removed — REALCOMP
- 2008-11-25 Listed $98,221 REALCOMP
- 2008-09-30 Listing Removed — REALCOMP
- 2008-09-30 Listing Removed — MiRealSource-MiMLS
- 2008-08-27 Listing Removed — MiRealSource-MiMLS
- 2008-08-26 Listed $8,000 REALCOMP
- 2008-08-26 Listed $8,000 MiRealSource-MiMLS
- 2008-07-31 Listing Removed — REALCOMP
- 2008-05-05 Listed $10,000 REALCOMP
- 2008-05-05 Listed $8,000 MiRealSource-MiMLS
- 2002-07-24 Sold (Public Records) $8,000 Public Records
Property tax history
+0.6%/yrLatest (2025): $1,118 · -28.9% YoY. Source: county tax records.
Cash-flow waterfall
monthlySold comps — $/sqft
last 12 mo · ≤1 miLoading sold comps…